Published: October 1st, 2020
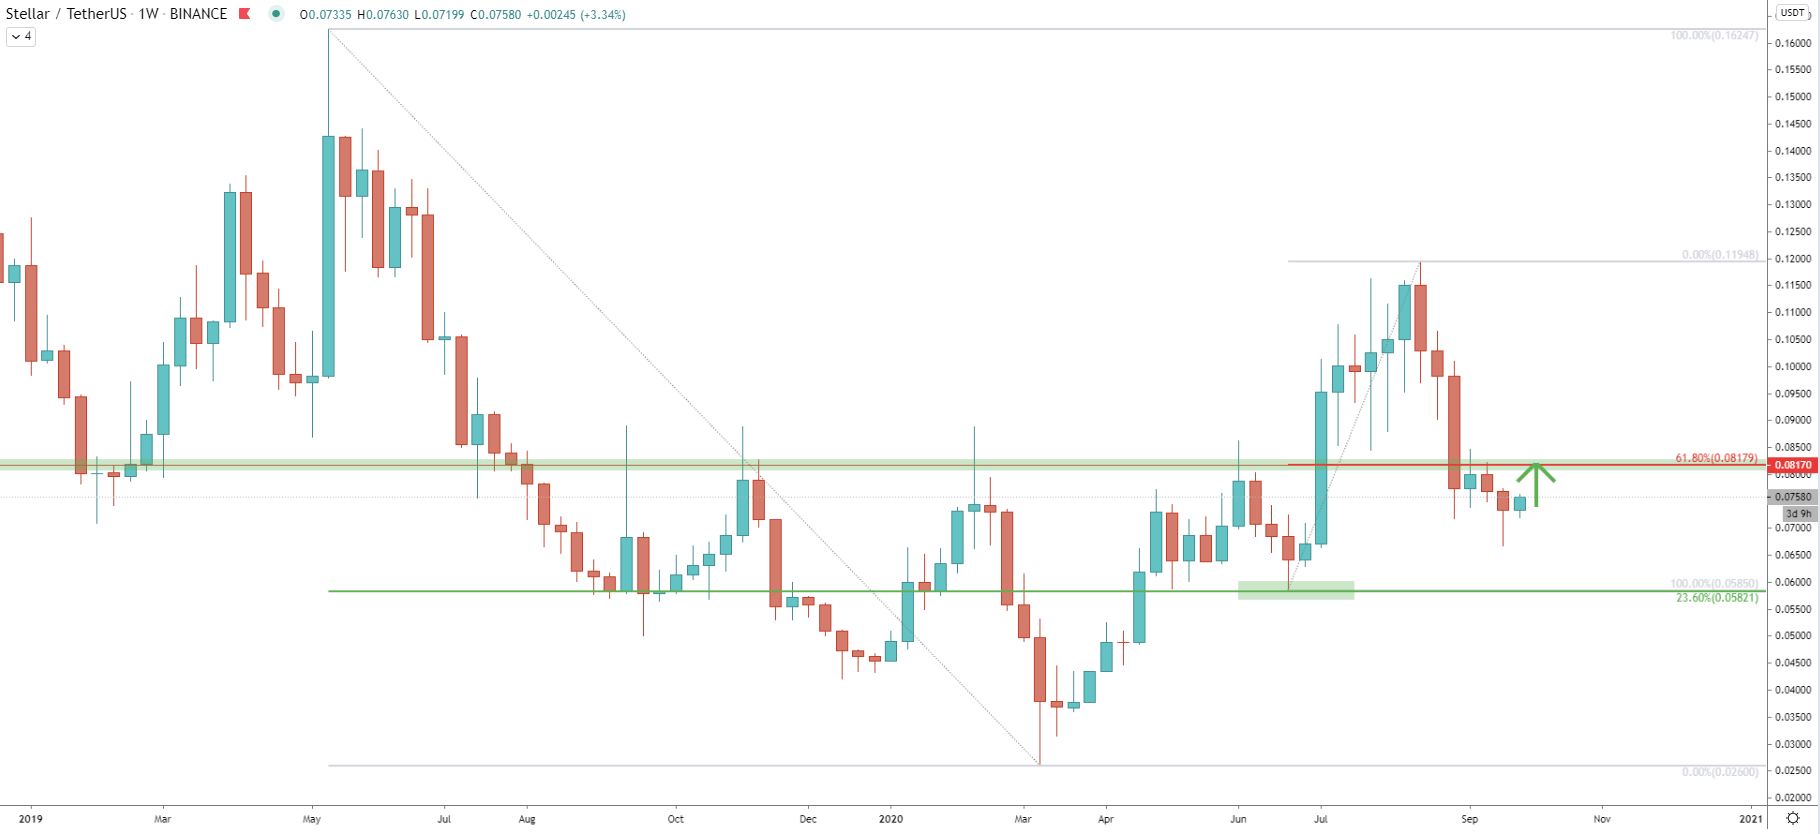
The weekly chart goes to show that trend is bullish. Higher highs and higher lows are being produced, besides, there was a clear rejection of the 23.6% Fibs at 0.058 back in June this year. The key resistance and the supply/demand zone is located at 0.081, which is confirmed by 61.8% Fibonacci retracement level. And while the trend is certainly up, Stellar must break and close above this resistance, to confirm further bullish intentions.
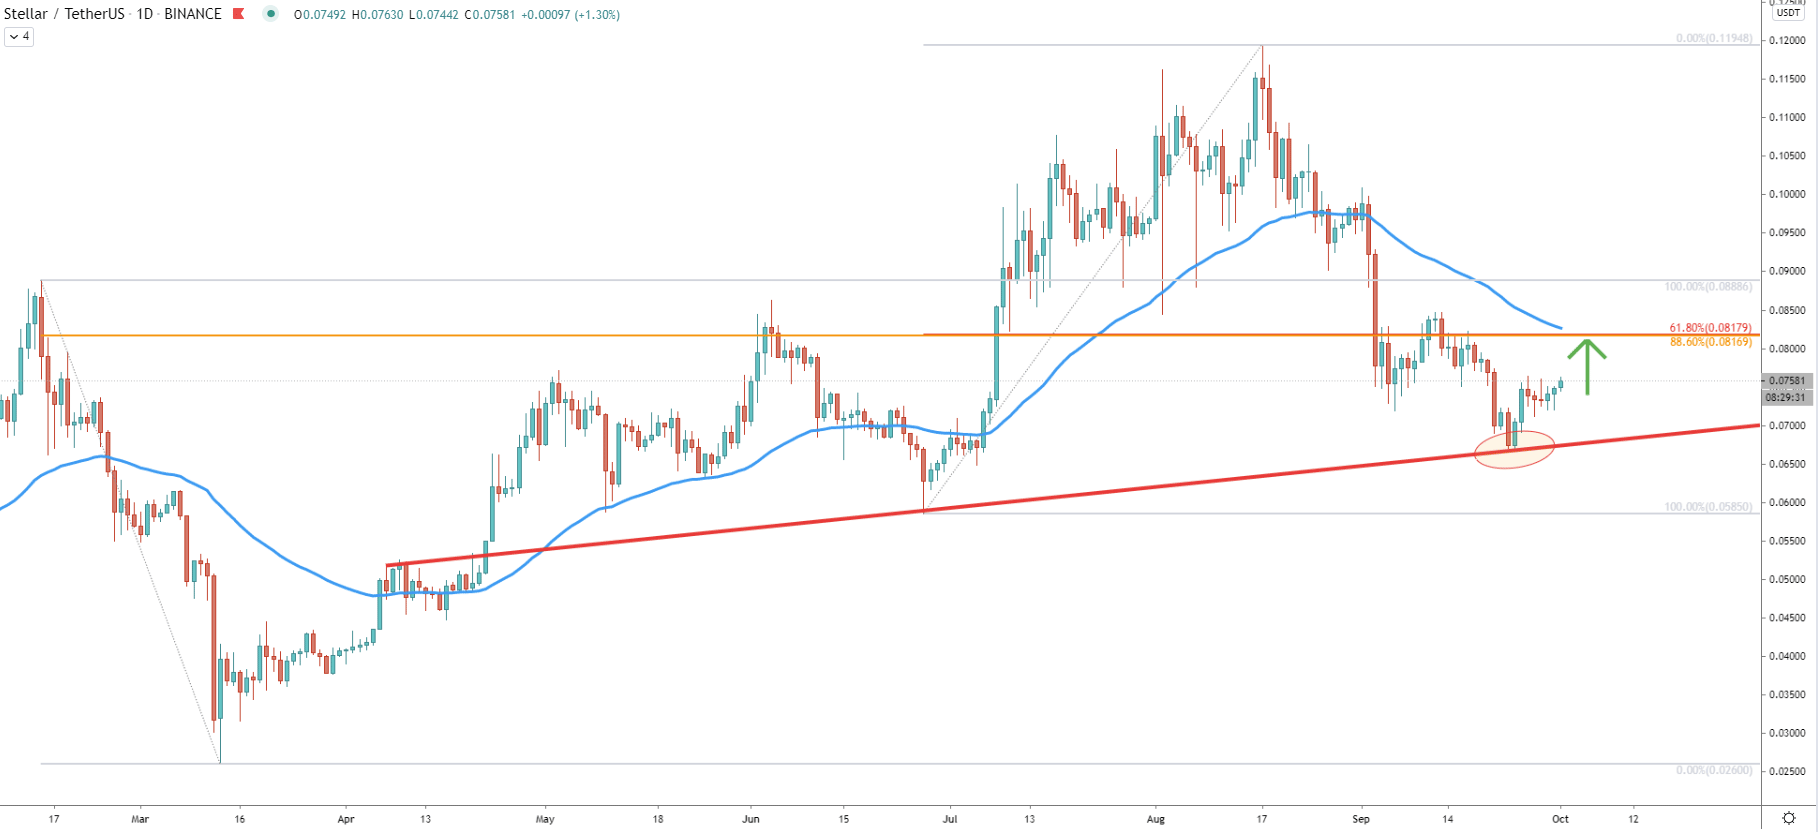
Just recently XLM/USDT cleanly rejected the average price uptrend trendline, while testing the 0.066 low on September 24. During the past 7 days, the price has been ranging, which might suggest that the next move is just around the corner. While further consolidation can be expected, at some point price might start moving towards the upside target at 0.081. On this chart it is confirmed by two Fibonacci retracement levels, 61.8% Fibs as per the Weekly chart, and 88.6% Fibs applied to he downside wave when XLM has reached the bottom back in March this year.
After price found the recent bottom at 0.066, the RSI oscillator formed a bullish divergence, suggesting a potential trend reversal to the upside. After that, the downtrend trendline has been broken, although currently XLM/USDT is rejecting the average-price downtrend trendline. The local resistance has been formed at 0.076, which must be penetrated in order for the price to continue moving higher. This means that the consolidation phase is still on, and buyers are likely to be waiting for the breakout to the upside before taking any action.
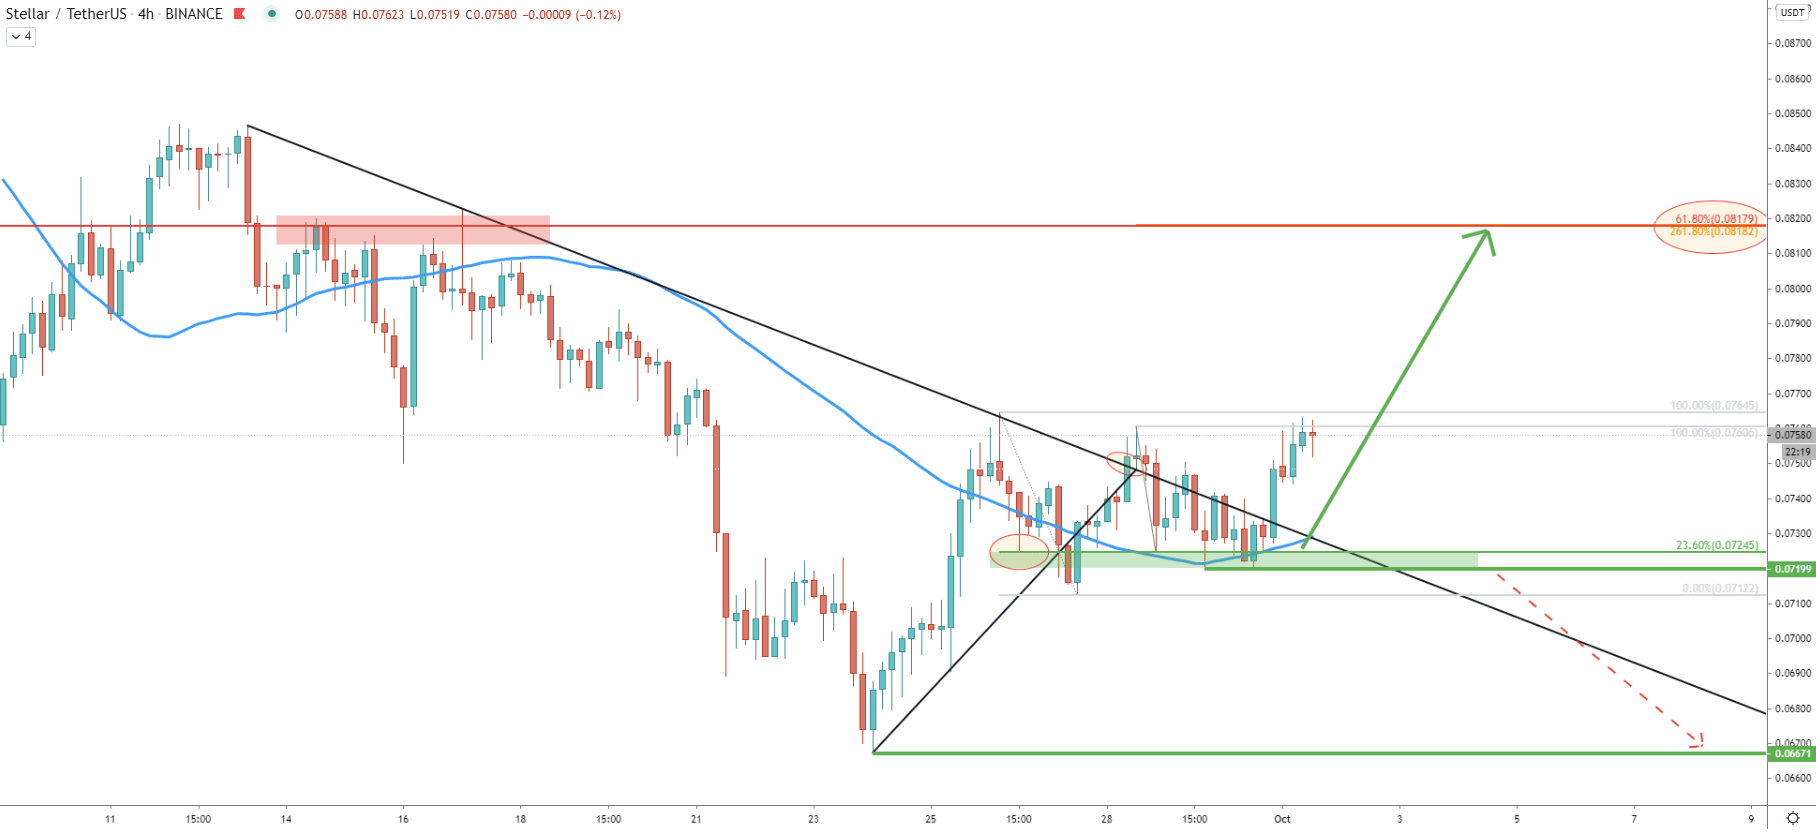
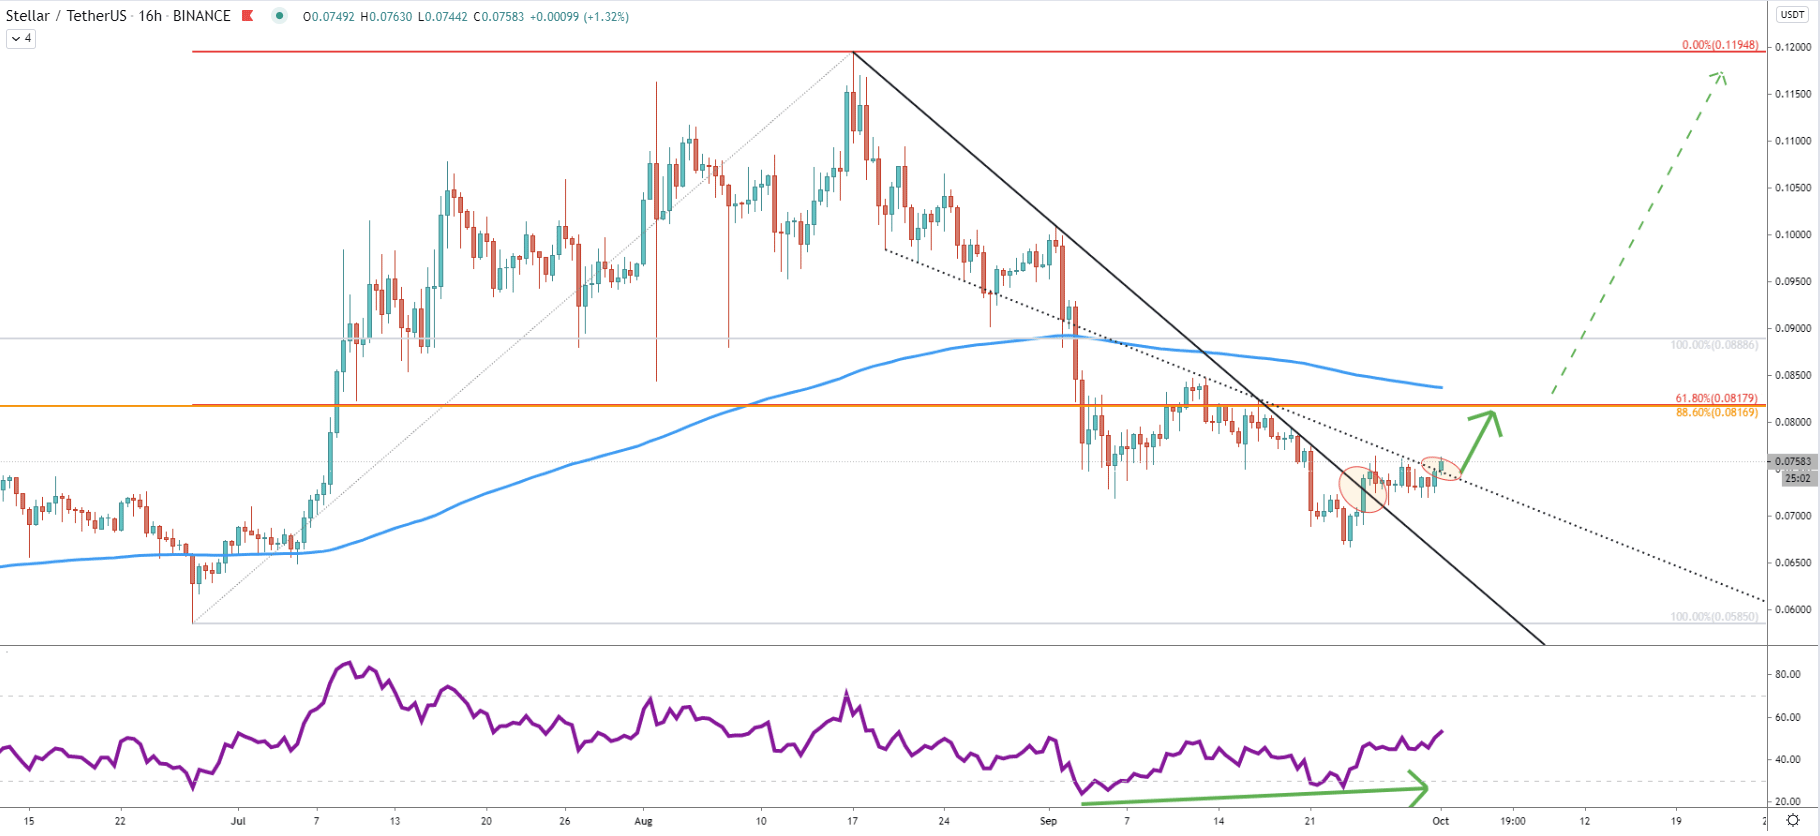
As has been mentioned, the previous level of the rejection of the downtrend trendline at 0.076 must be broken before buying pressure will increase. Therefore, the range trading between 0.076 resistance and 0.072 support is still ongoing. The support has been confirmed by the 23.6% Fibonacci retracement level applied to the previously made pullback down after rejecting the downtrend trendline. There were multiple bounced off this support level and yet another Fibonacci was applied to the downside move where it was rejected. It can be seen, that 261.8% Fibs is precisely corresponding to the previously shown resistance at 0.081.
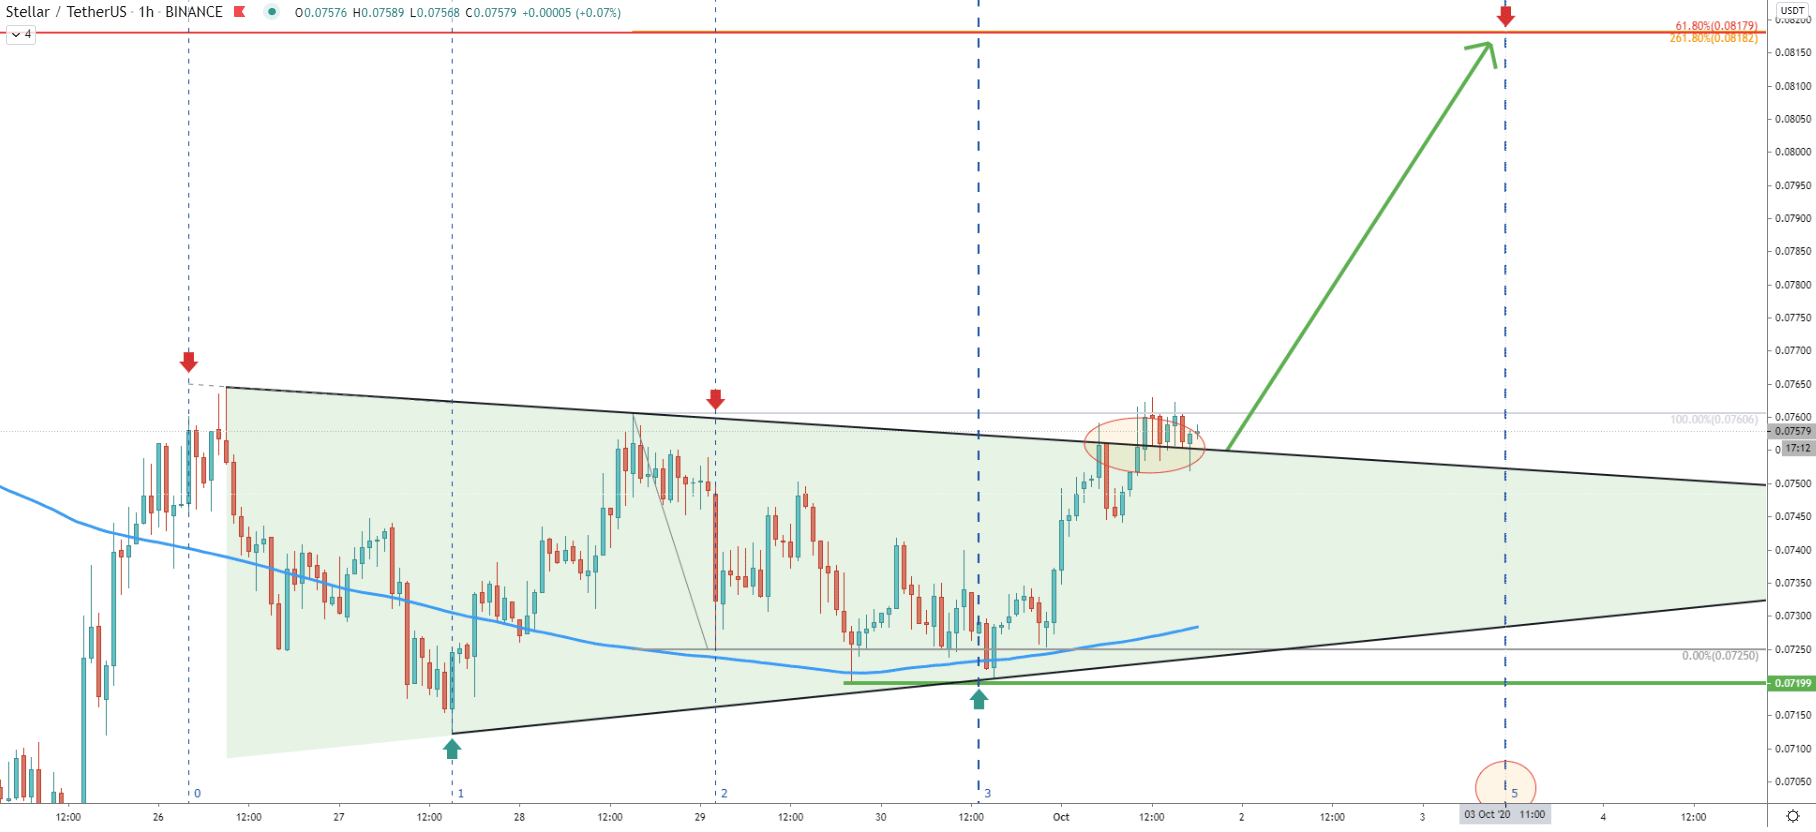
XLM/USDT still didn’t break and close above the triangle pattern with confidence. There were multiple spikes produced about the downtrend trendline, although no bullish confirmation followed. This might result in the continuation of the range-trading, and price can potentially re-test the bottom of the triangle and/or the 200 Exponential Moving Average. However, the Fibonacci time zone indicator shows that the bullish cycle has already started. The next cycle is on October 3, which could be either the time when the upside target will be tested or when the new bullish cycle will start.
The Stellar long-term trend remains bullish, although on lower timeframes it is facing the resistance, at 0.076. At some point, a break above the resistance is expected, which could be a trigger point for the next wave up.
The key resistance is located at 0.081 level and it confirmed by multiple Fibonacci retracement levels. Based on the Fibonacci time zone indicator, the target could be reached as soon as October 3, but on the other hand, this could also be the time when the next bullish cycle starts.
As per the 4-hour chart, the key support level is located at 0.072. There was a spike below this level, although the daily closing price remained below. Therefore, only a daily break and close below 0.071 will completely invalidate the bullish outlook and XLM/USDT could be heading towards the 0.066 key long-term support level.
Support: 0.071
Resistance: 0.076, 0.081