Published: August 17th, 2020
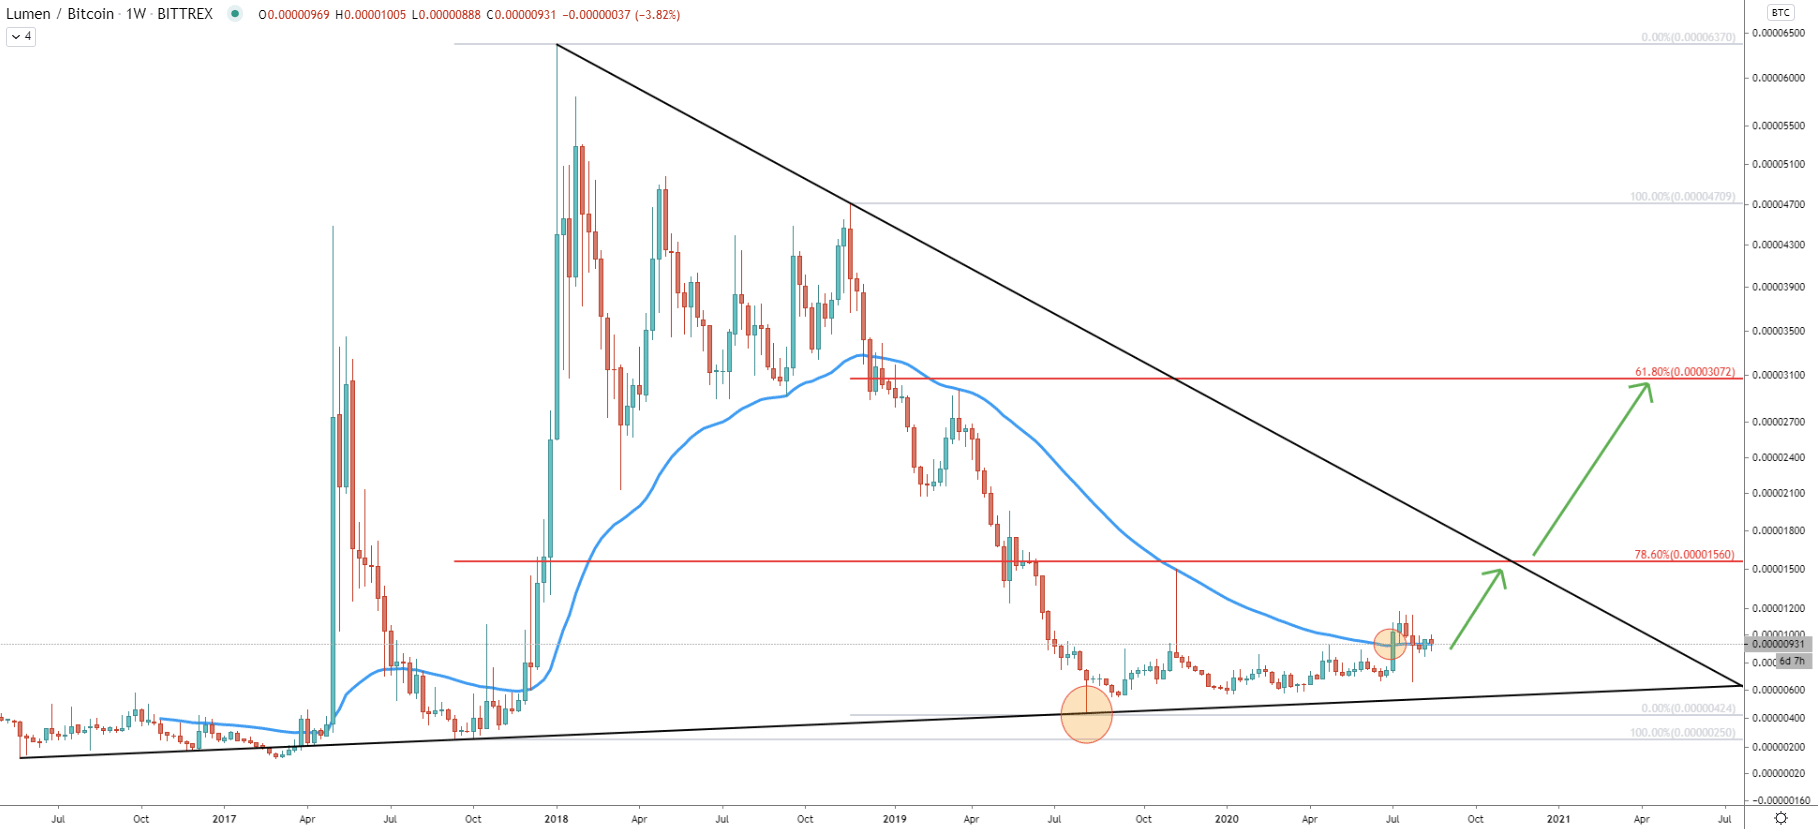
Back in August 2019, Stellar has found the bottom at 424 satoshis and cleanly rejected the long term uptrend trendline. Since then, XLM/BTC has been consolidating between 500 and 1000 satoshis area. It was an extremely extended consolidation phase, lasted for over one year. However, a month ago, the price finally broke above the 50 Simple Moving Average, which could have been the first strong bullish signal since November 2017, when XLM previously broke above the 50 EMA.
This should result in the price moving towards the downtrend trendline, which corresponds to the 78.6% Fibonacci retracement level at 1560 satoshis. It also corresponds to the previous resistance area, where back in November 2019 price rejected the 50 EMA, at 1500 satoshis. But Stellar could be on the long term rise, and if 1560 satoshis resistance will be broken on the Weekly chart, the price might continue moving north, to test 3000 satoshis area, which is the next technical and psychological resistance area. In the following charts, we’ll go deeper into these target levels.
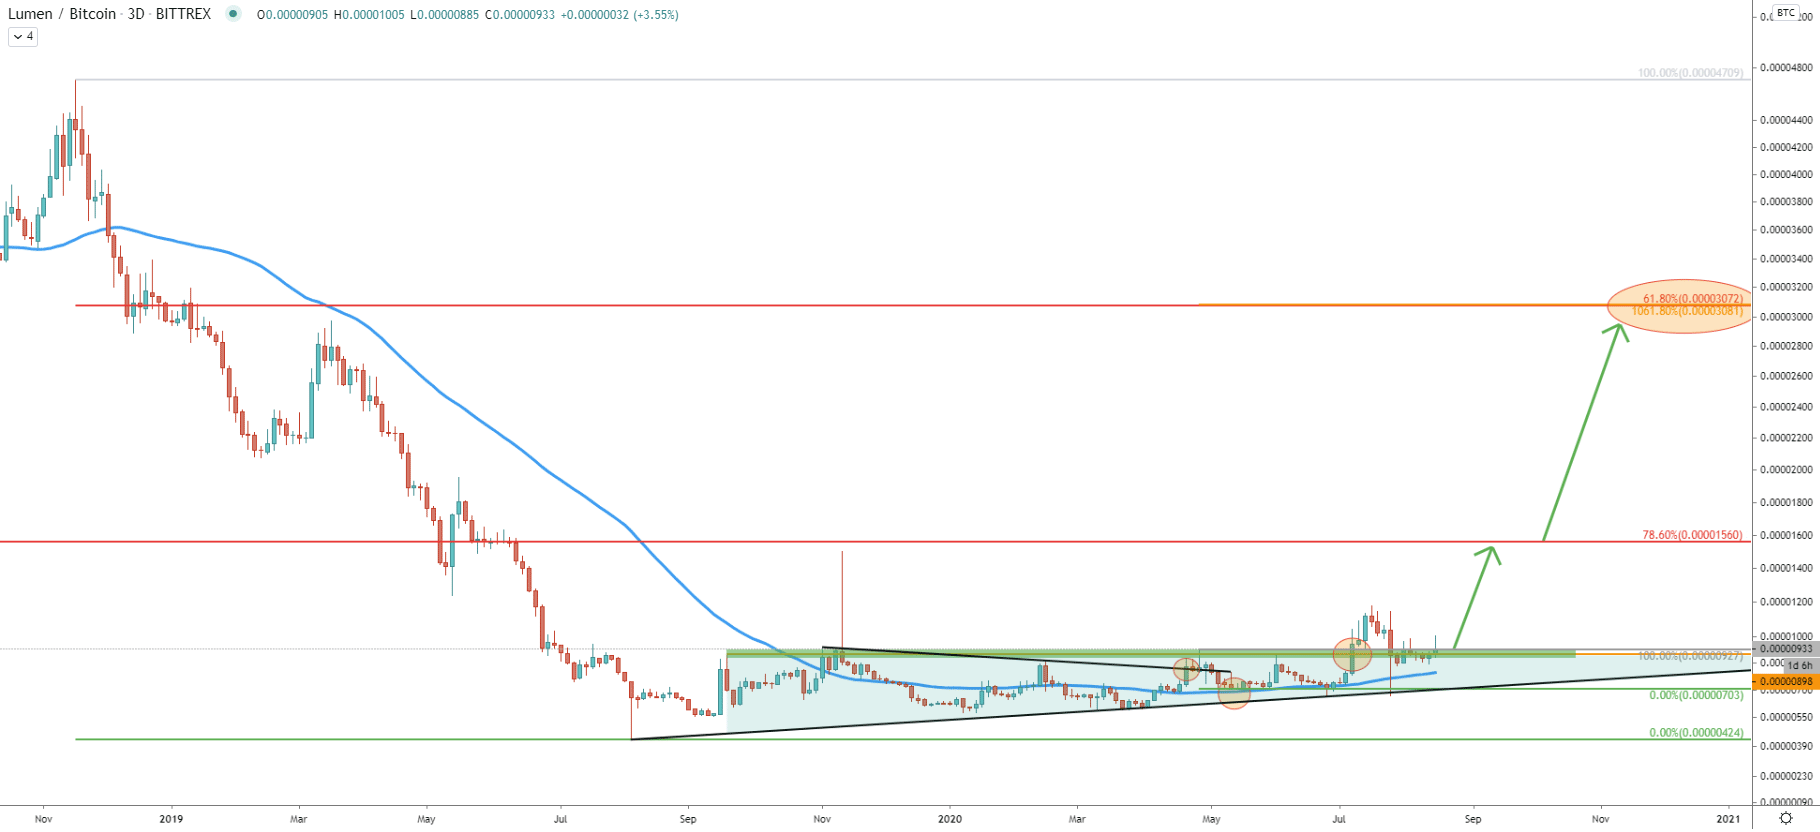
Between October 2019 and September 2020, Stellar price formed a triangle pattern while breaking above the downtrend trendline. The 200 Exponential Moving Average has been rejected multiple times along with the uptrend trendline. Then finally, price broke above the triangle with a daily and weekly close above 1000 satoshis resistance.
This was indeed an extremely bullish price action which should result in an upcoming rally. The second upside target is confirmed by 1061.8% Fibs applied to the point of the first rejection of the 200 EMA. If this target will be reached, XLM will outperform the BTC by over 225% in the coming months.
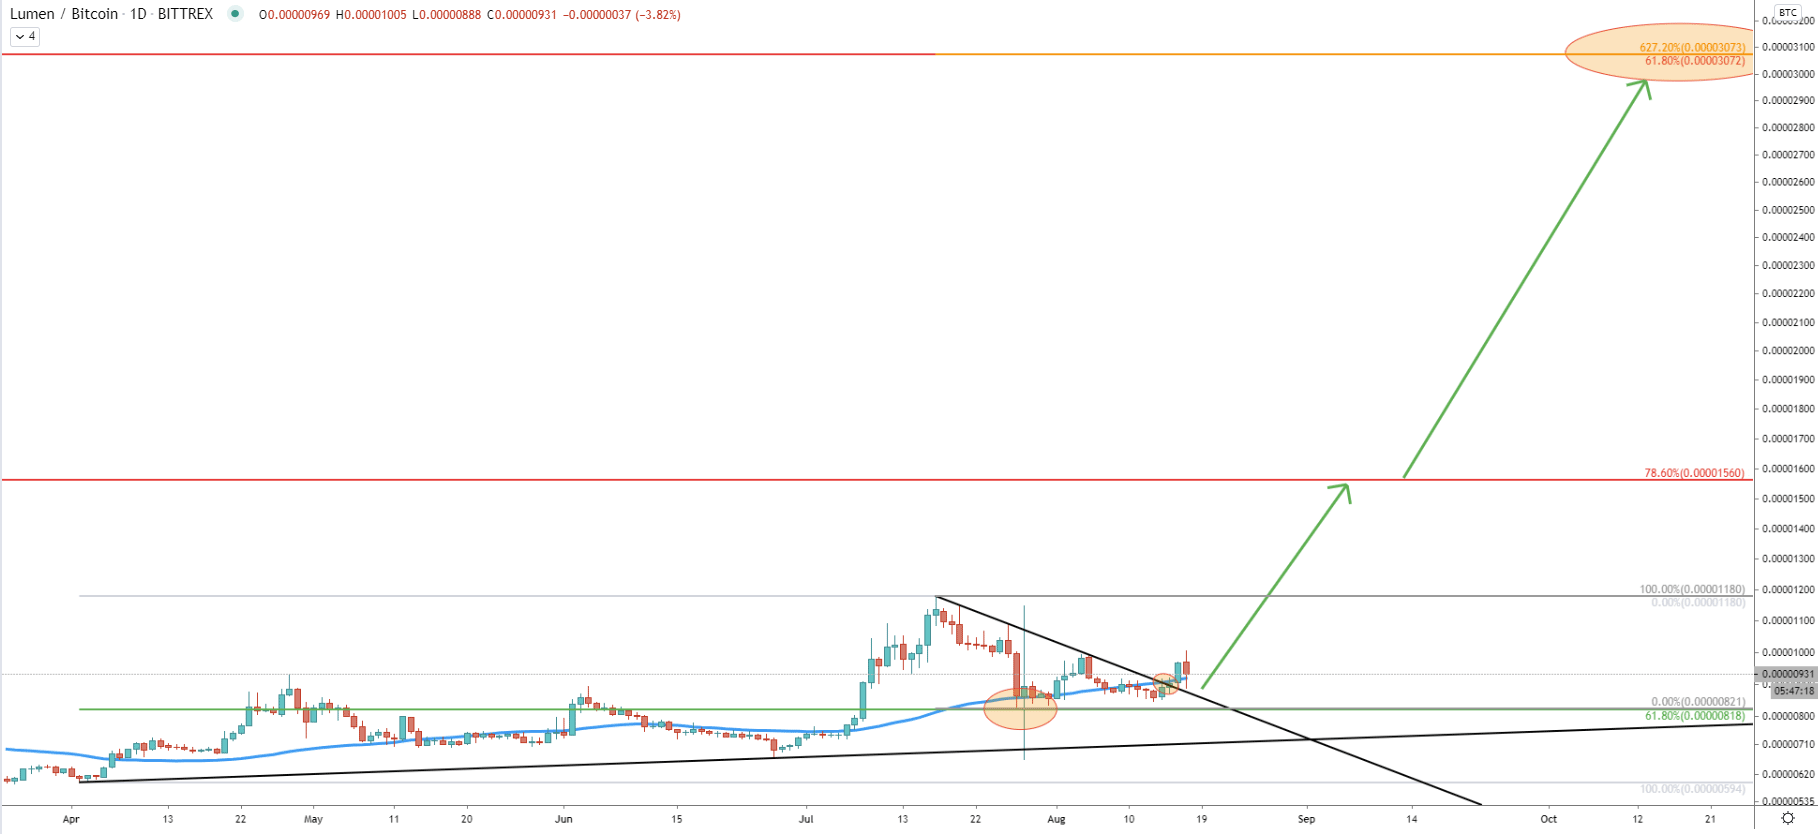
On the Daily chart price tested 1180 satoshis high and corrected down to 821 satoshis support, where 61.78% Fibonacci retracement level has been rejected cleanly. XLM/BTC produced the spike below the support, although failed to close lower. At the same time, the 50 Exponential Moving Average was rejected, after which price broke above the downtrend trendline.
Fibonacci applied to the recent corrective wave down shows, that second resistance at 3072 satoshis cleanly corresponds to the 627.2% retracement level. However, it will be important to see the break above the first resistance, before/if the price will move towards the second one.
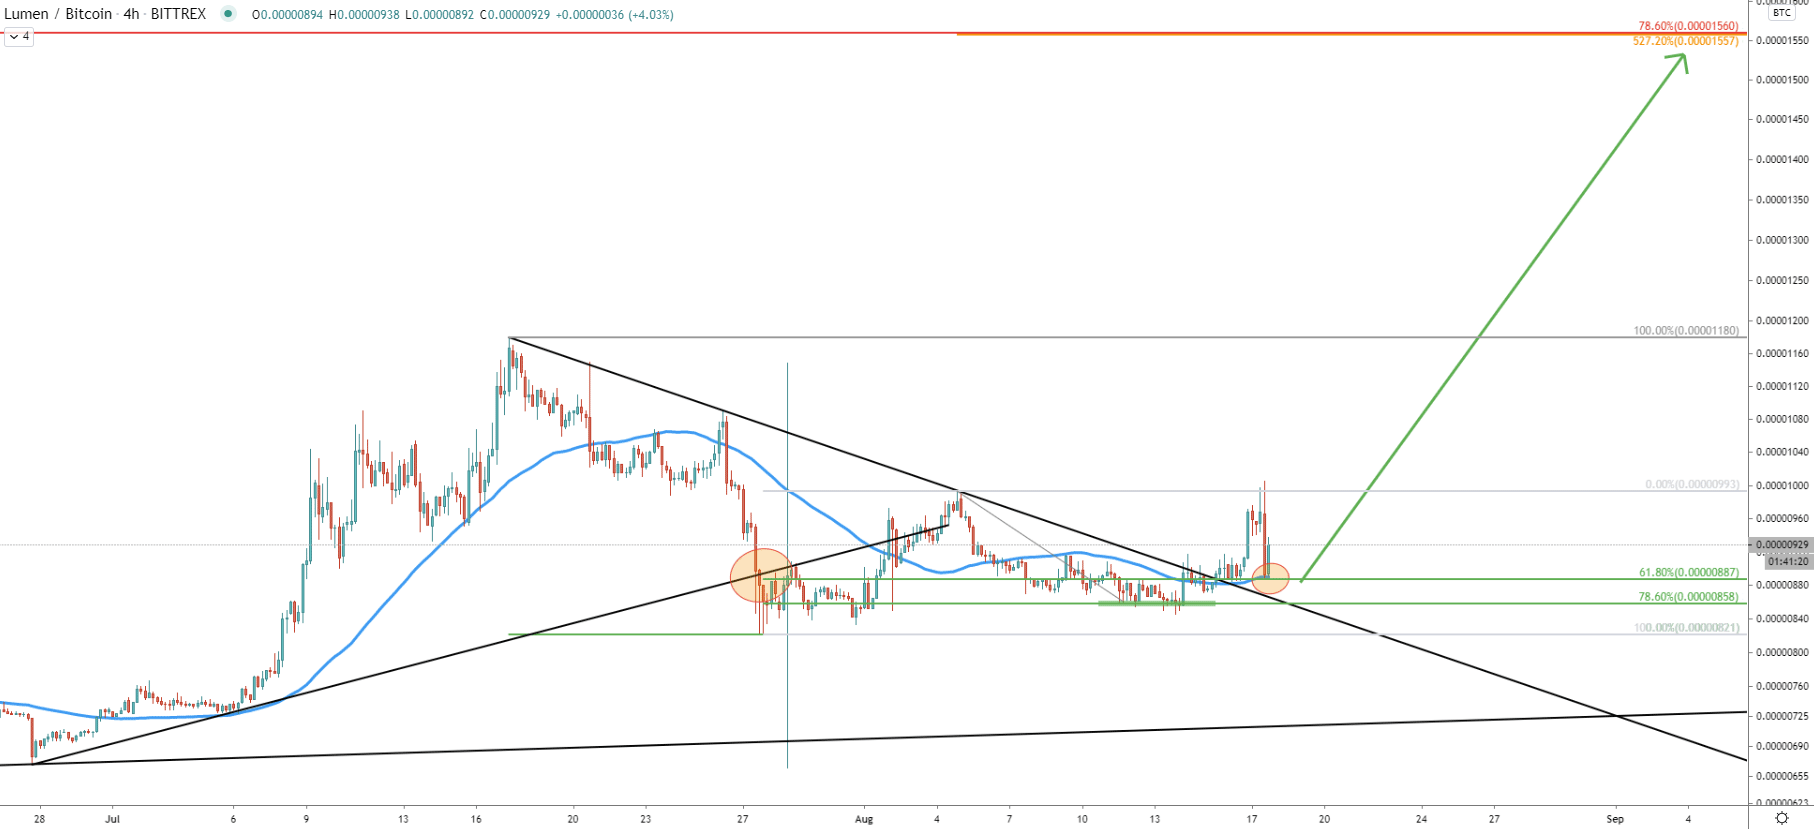
The 4-hour chart shows, that the uptrend trendline has been rejected and price attempted to break lower on a few occasions. Nonetheless, uptrend trendline was respected, after which Stellar rejected 78.6% Fibs at 858 satoshis.
The downtrend trendline has been broken and on the current correction down, XLM rejected 61.8% Fibs alone that the 50 EMA at 887 satoshis. This could have been a strong demand zone for the Stellar, and as long as daily close remains above 888, price is extremely likely to continue rising.
On this chart, we have applied yet another Fib to the corrective wave down where 78.6% Fib support was rejected. It shows that 527.2% cleanly corresponds to the first upside target at 1557 satoshis.
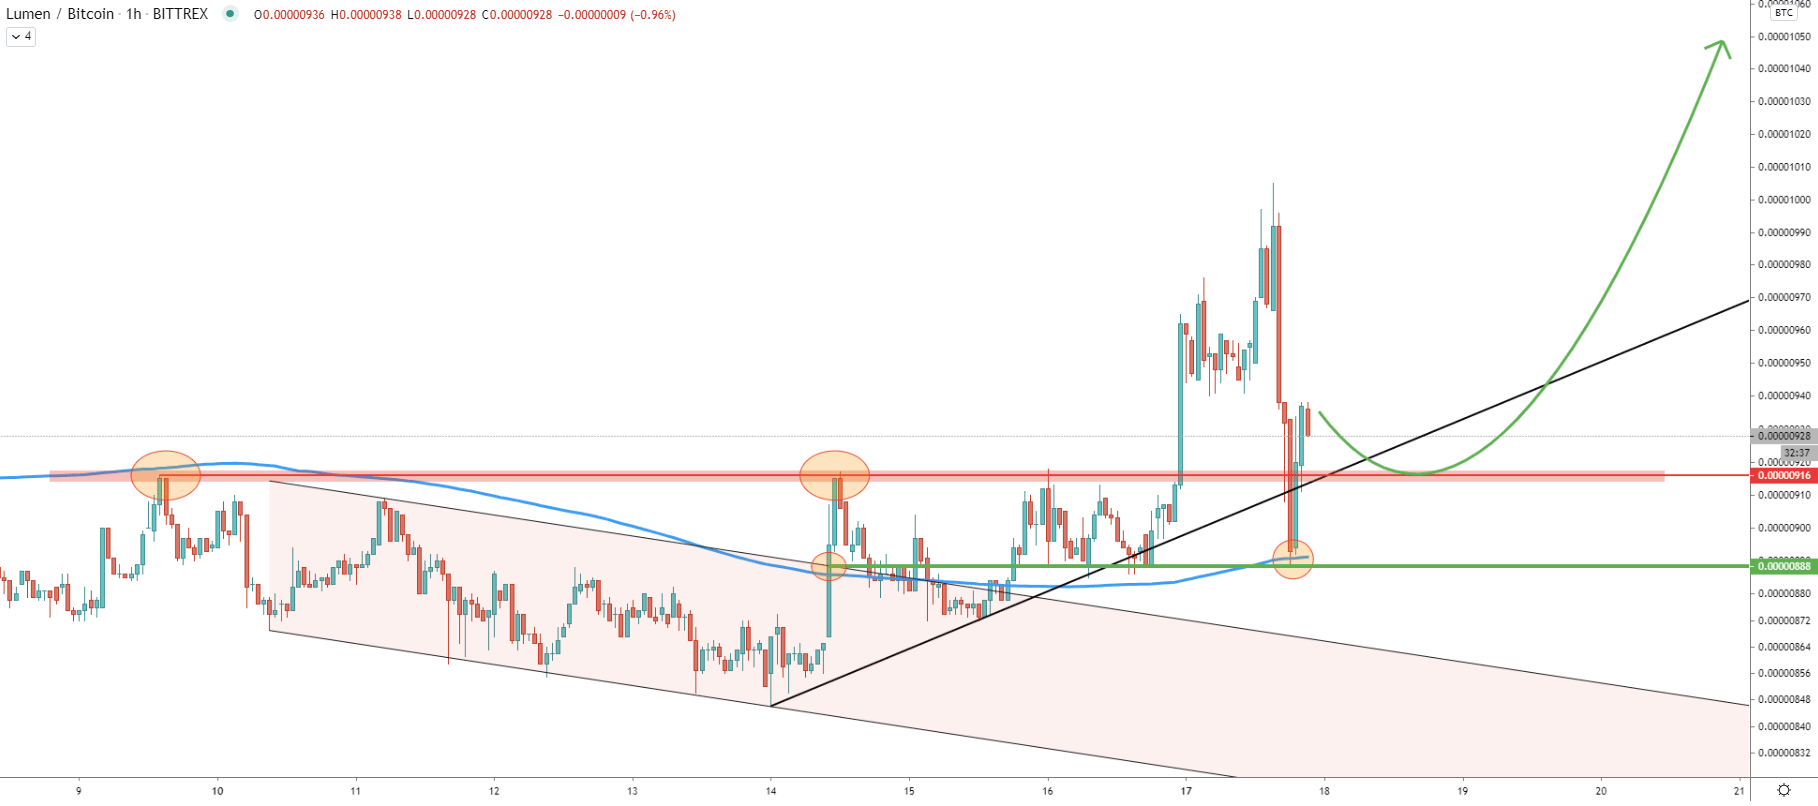
The descending channel was broken and then price rejected the short term uptrend trendline. The support has been formed at 888 satoshis, which corresponds to the point of the channel breakout. Today price bounced off the 888 support once again along with the 200 EMA.
The 900-1000 satoshis area is currently acting as a very strong demand zone. This means taht Stellar can retrace back to this price area and only then begging a massive upside rally.
The Stellar coin is showing an extremely bullish price action on the weekly, daily, and lower timeframes. After breaking the 1000 satoshis resistance price should continue to rise, although consolidation could take place and might take a while before the price will start to move up.
As per the Weekly, 3-day, Daily, and 4-hour chart, we have marked two key resistance levels to watch in the medium to long term. Both of them correspond to multiple Fibonacci retracement levels and are located at 1560 and 3080 satoshis.
Todays’ low at 888 satoshis, could have been the bottom of the week. As long as price is holding above, uptrend will remain valid. But, daily break and close below this support level will invalidate an extremely bullish forecast and Stellar might lose the interest of investors for the next couple of months.
Support: 888, 1000
Resistance: 1560, 3072