
Published: December 21st, 2023
During the third quarter of 2023, Steel Dynamics disclosed earnings per share of $3.47, reflecting a decline from the previous year's figure of $5.03. The realized amount marginally fell short of the Zacks Consensus Estimate for earnings per share, which was $3.49. Notwithstanding obstacles such as decreased steel prices, the organization observed a steadfast demand for steel and consistent client orders.
Despite a year-over-year decline of 19% from $4,553.8 million to $4,587.1 million, net sales for the quarter exceeded expectations at $4,587.1 million, indicating a mixed performance.
Earnings for steel fabrication operations are anticipated to be lower in the fourth quarter compared to the sequential results of the third quarter. The decline in shipments and compression of metal spreads during this period can be attributed to the combined effects of declining realized selling prices and increased steel input costs. In contrast, order activity for steel joists and decks has increased since the third quarter, and prices have stabilized.
A year prior to December 13, 2023, the organization repurchased common stocks for $1.4 billion, or approximately 8%. Additionally, throughout the course of the year, cash dividends amounting to $271 million were disbursed to shareholders. Within the same time frame, Steel Dynamics' stock has gained 18.3%, which stands in contrast to the industry's 29.4% increase.
Let’s see the upcoming price direction of this stock from the STLD technical analysis:
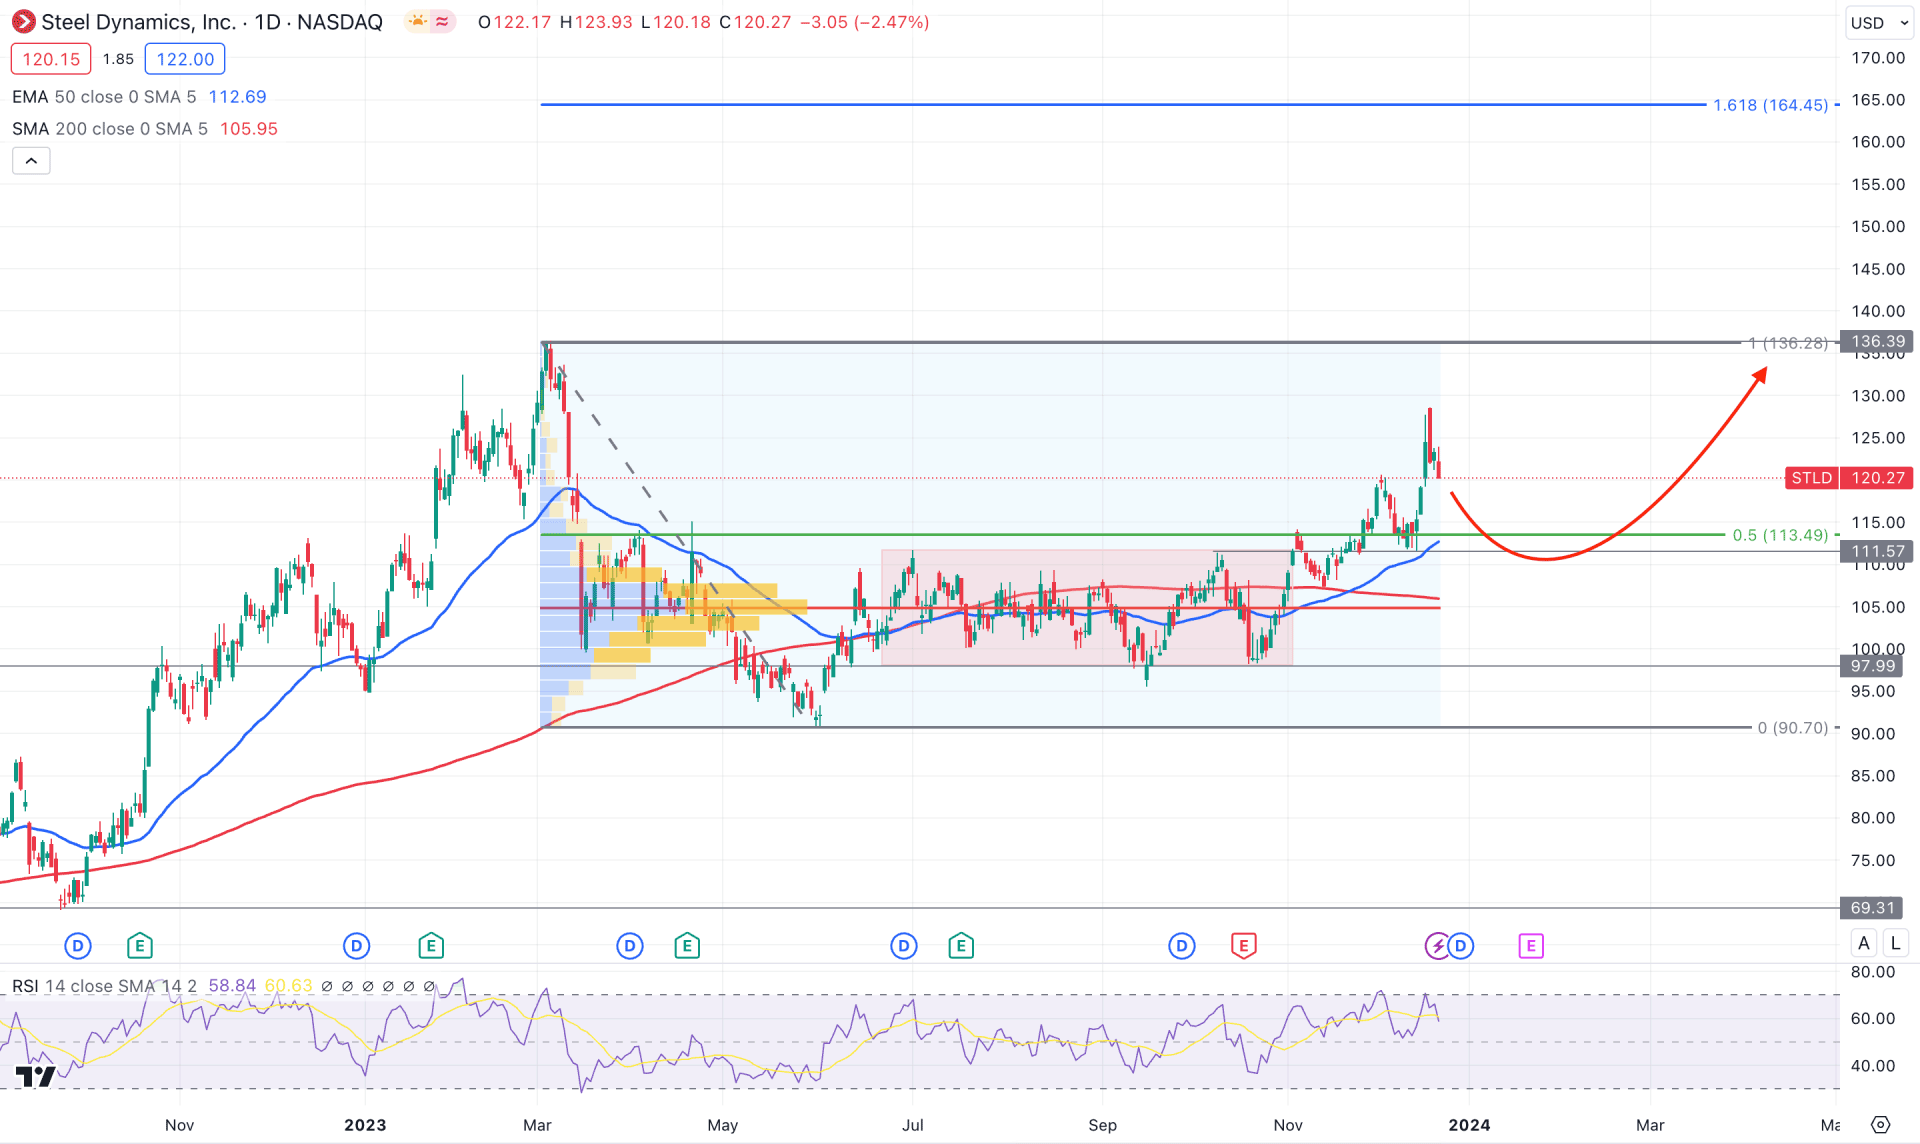
In STLD's daily chart, the broader market direction is bullish, as the most recent price indicates a bullish continuation from the rectangle breakout. In that case, the primary trading idea is to wait for the sufficient downside correction to complete before anticipating a long opportunity.
In the higher timeframe price action, the monthly candle suggests a clear bullish continuation, as the November close came with a strong bullish candle within the existing bullish trend. As long as the current price trades within the 50% body of November’s body, we may expect the bullish continuation to continue.
In the daily chart, the recent price shows a bullish breakout from the rectangle pattern, which is a strong sign of a bullish trend continuation. Moreover, the continuation of the bullish trend is supported by the Golden Cross formation, where the 50-day EMA crosses above the 200-day EMA with an upward slope. As the current price remains above the 50 and 200-day Moving Averages, we may expect a bullish trend trading opportunity after a bearish correction.
In the volume structure, the bullish accumulation is visible within the rectangle pattern where investors showed the most interest. In that case, the rectangle low of 97.99 would be a crucial price level as the downside correction might happen until there.
In the secondary window, the overall market pressure is corrective as the recent RSI reached the overbought 70.00 level.
Based on the daily structure of STDL, investors might expect a bearish correction in this instrument, where the primary target is to test the 50-day EMA level. Therefore, a valid bullish rebound from the 113.40 to 100.00 area could be a valid long opportunity, targeting the 136.39 level.
The alternative approach is to look for a short opportunity after violating the 200-day Simple Moving Average, which could lower the price towards the 90.70 level.
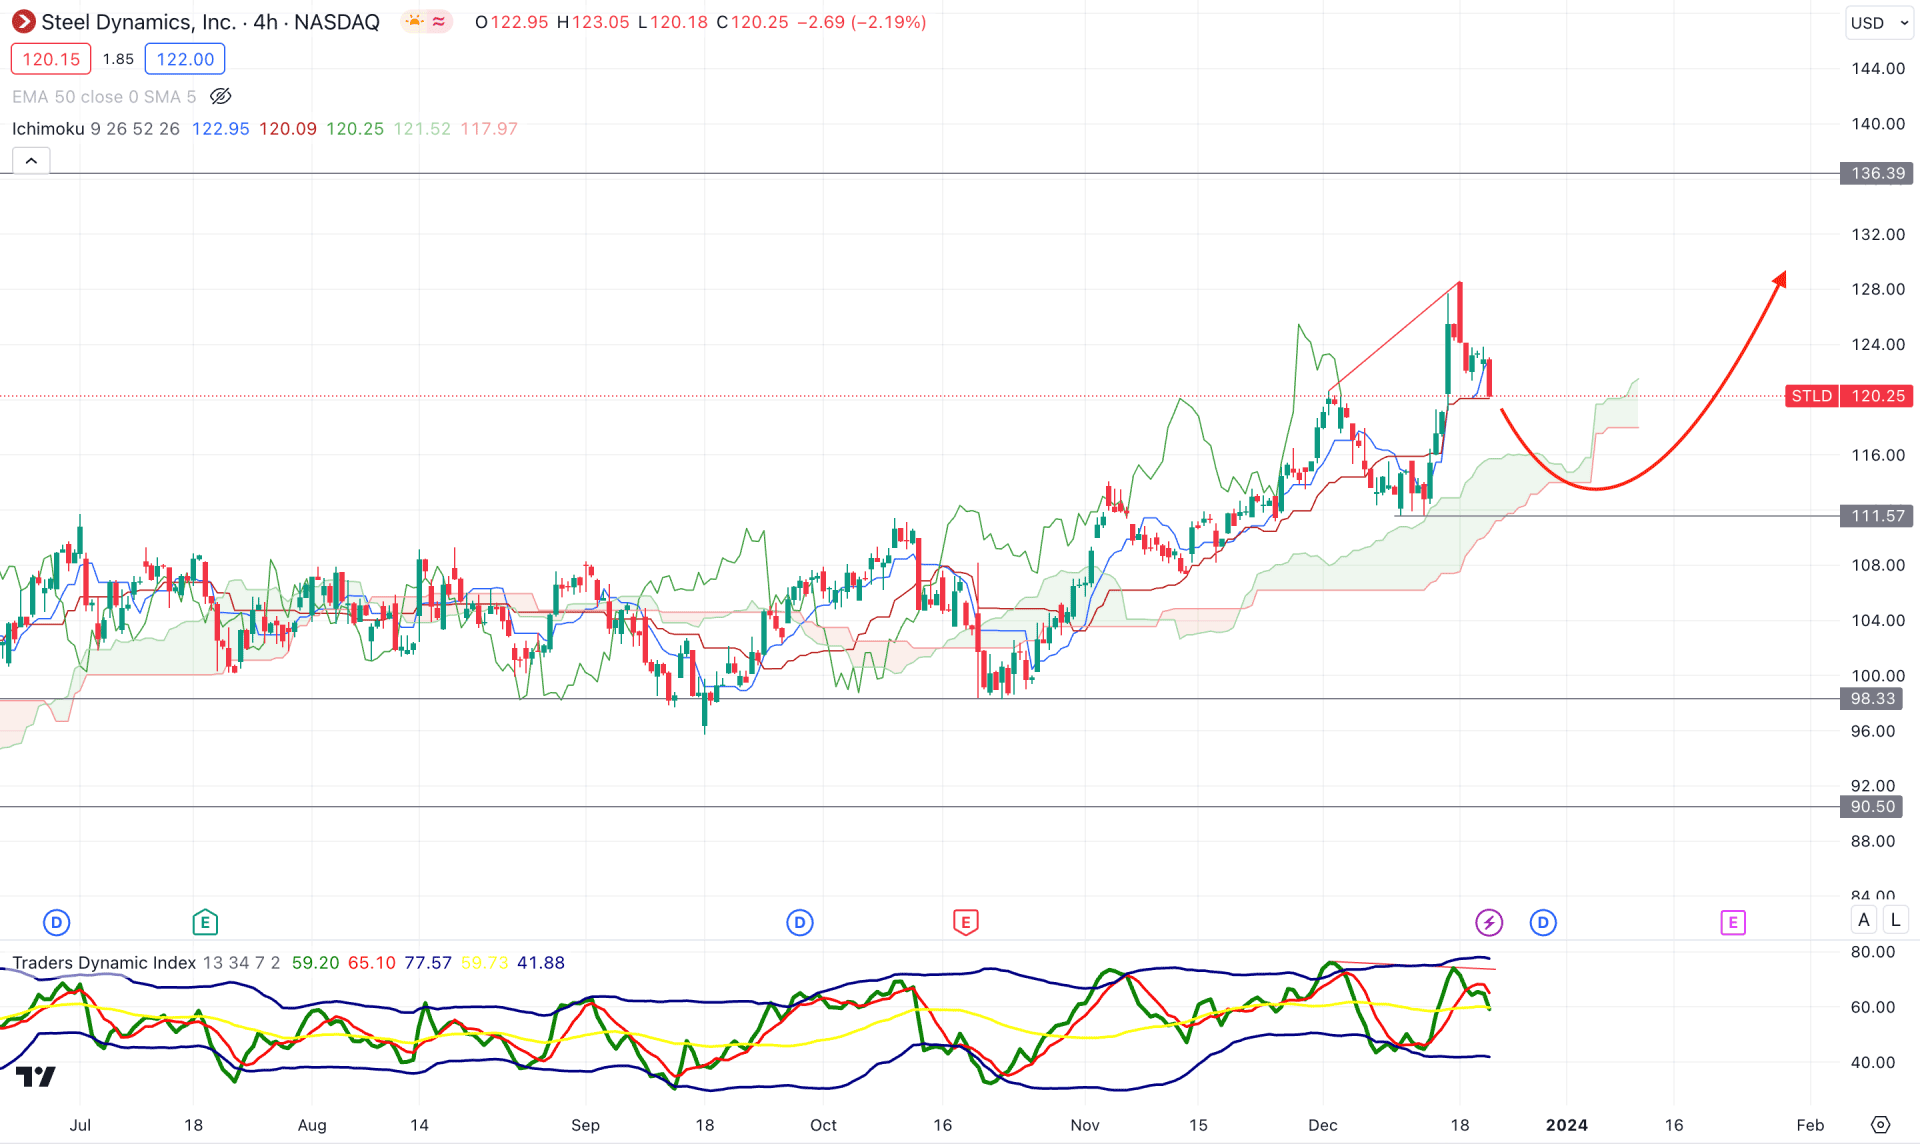
In the H4 timeframe, a stable market is visible above the dynamic Ichimoku Cloud zone, which indicates a primary bullish continuation opportunity.
In the future cloud, the Senkou Span A and B show upward momentum, which is a primary sign of a continuation of a bullish trend. Moreover, the dynamic Tenkan Sen and Kijun Sen are below the current price with an upward slope.
In the secondary window, the current TDI level remains above the 50.00 neutral line, followed by a divergence with the main price.
Based on this outlook, a downside correction is possible, where the main aim is to test the 111.57 support level. However, further selling pressure and an H4 candle below the 100.00 psychological level could lower the price towards the 90.00 level.
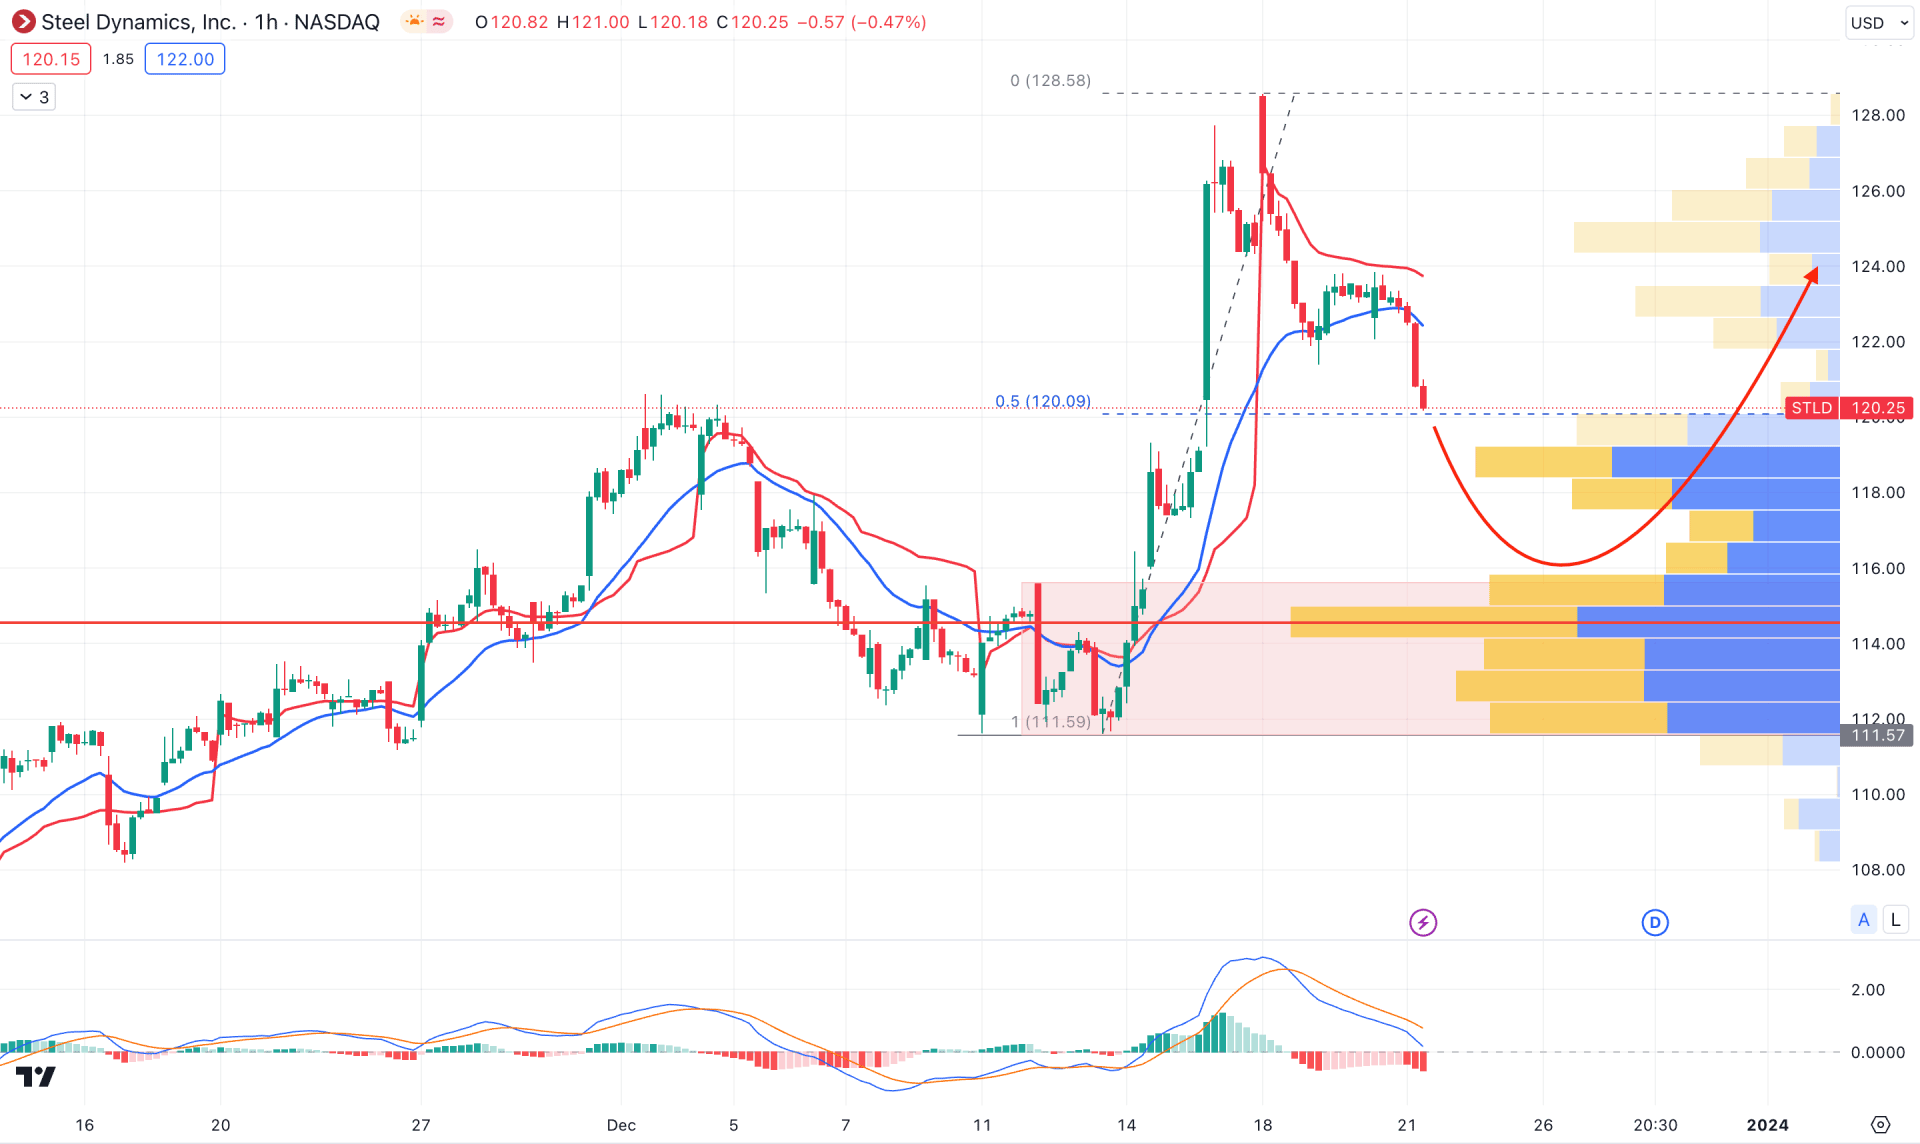
In the hourly chart, the broader market direction is bullish, where the recent swing high indicates an overbought price action. In that case, a sufficient downside correction is pending before anticipating a bullish continuation.
In the current structure, the recent price moved below the dynamic 20 EMA and weekly VWAP, which indicates an ongoing bearish pressure. In that case, a selling pressure below the 120.09 price level could offer a long opportunity from the discounted zone.
Moreover, the MACD Histogram moved below the neutral line, while the current Signal line shows bearish traction above the neutral level.
In that case, a break below the 111.57 level could eliminate the current bullish structure and lower the price in the coming days.
Based on the current price action, STLD price has a higher possibility of completing a sufficient downside correction after the existing range breakout. Therefore, investors should keep a close eye on the intraday price before finding an early buying opportunity.


