
Published: November 19th, 2025
The price of Starknet (STRK) has increased by 95% in the last 30 days, and the trend may still be ongoing. Development of its foundations has additionally led to an increase, aside from the technical setup.
First, there is a significant demand for privacy-focused cryptocurrencies due to growing interest in them. Additionally, zero-knowledge proofs (ZKPs) for confidential transactions were initially introduced by Zcash (ZEC).
Now, users may check Zcash-style proofs straight on-chain with Starknet, which is based on STARK proofs.
In the midst of this excitement, developers have unveiled ZTARNET, a network that combines the performance and scale of Starknet with the privacy assurances of Zcash.
Since STRK wants to imitate Zcash, which has increased by around 2,000% in the last ninety days, this has also coincidentally affected its price.
As per the on-chain data, the number of addresses with over 100 STRK has increased to a remarkable 21,868. It indicates that smaller shareholders are actively accumulating instead of switching to other assets.
Concurrently, wallets with more than 10,000 STRK have hit a record high of 5,073, a sign of persistent demand from cryptocurrency whales.
In general, retail inflows offer consistent, widespread support, which over time may result in decreased sell-side liquidity.
Let's see the complete outlook from the STRK/USDT price analysis:
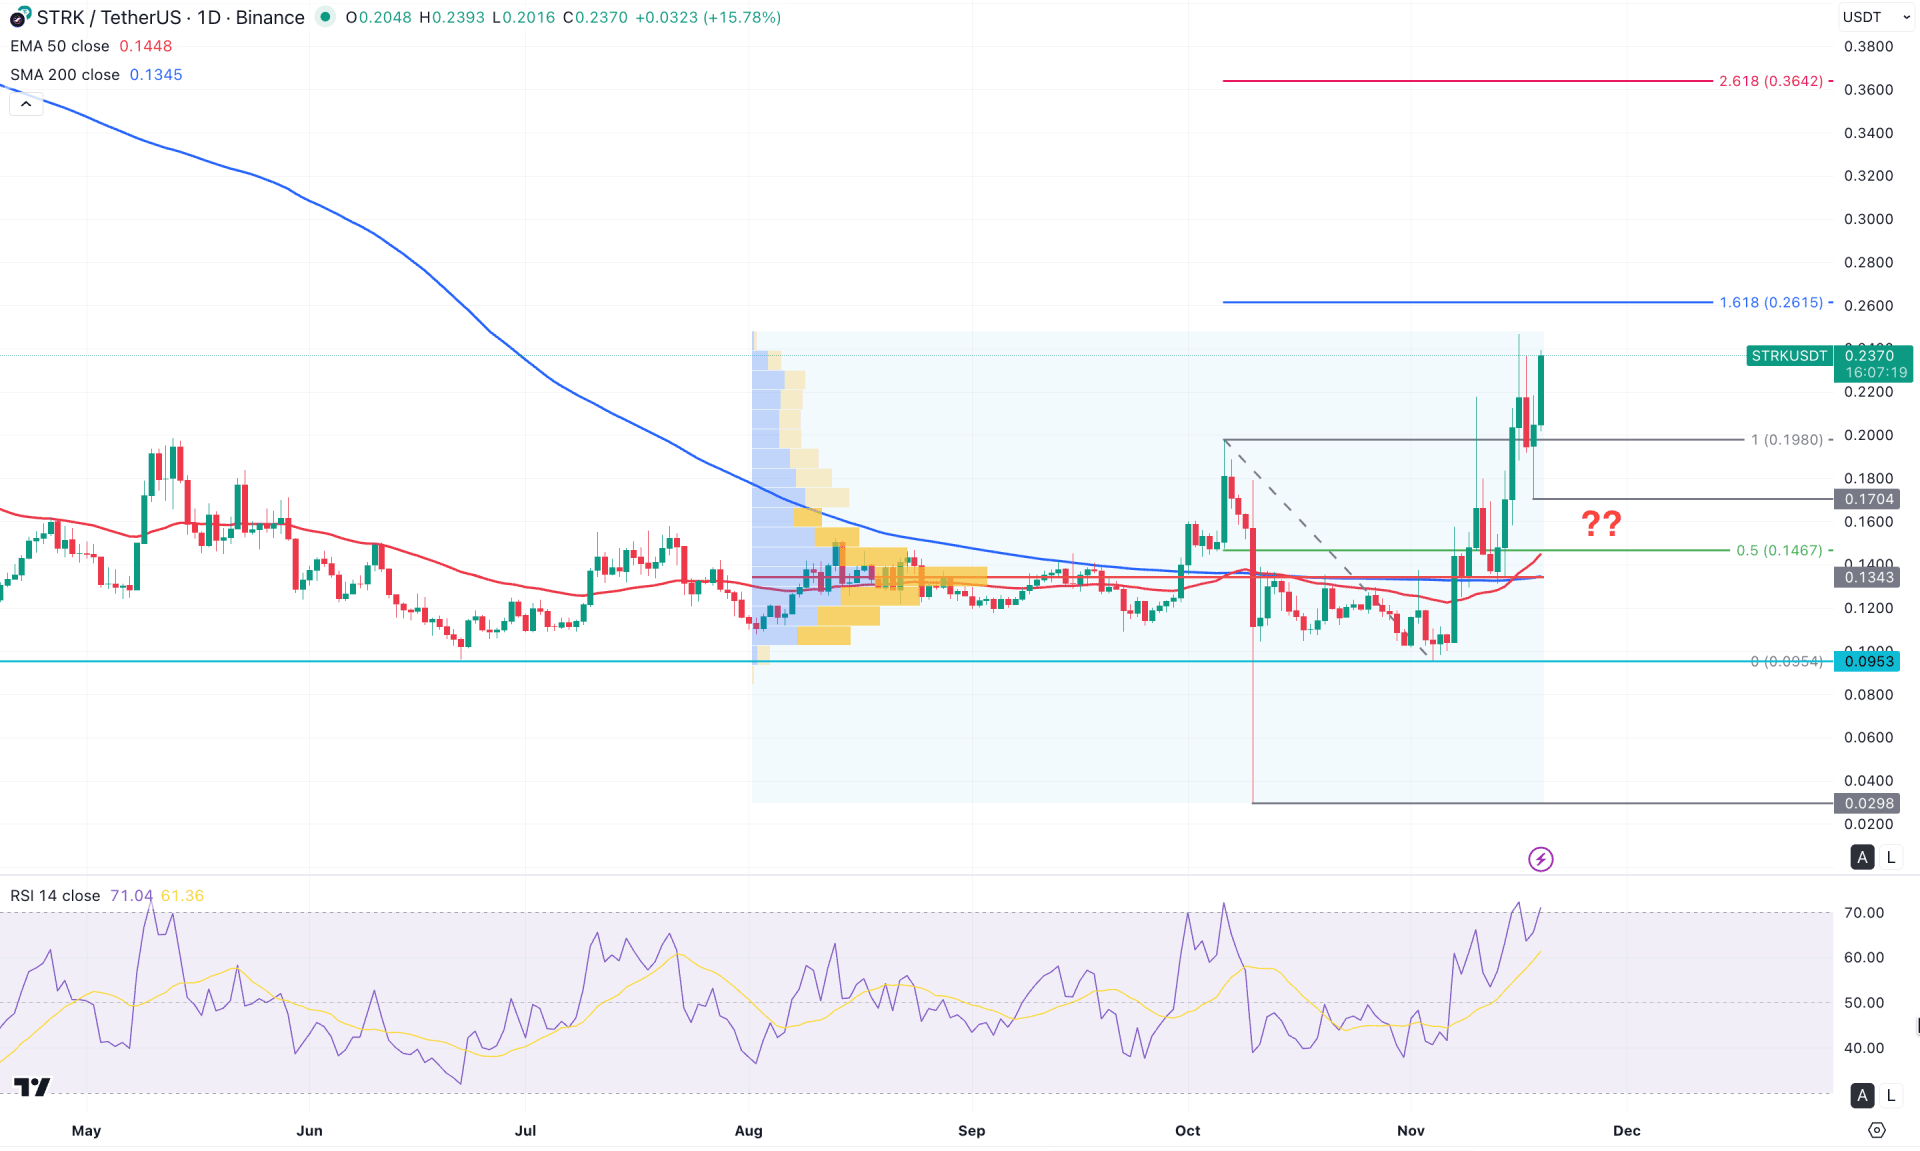
In the daily chart of STRK/USDT, the ongoing buying pressure is supported by a massive sell-side liquidity sweep and strong fundamentals. As the bullish momentum is impulsive, a decent trend trading opportunity is present until exhaustion appears at the top.
In the higher timeframe, a strong buying pressure has come after eight consecutive corrective months. A bullish Gravestone Doji breakout is visible, where the current price is trading above the multi-month high. The weekly price shows the same story, where the current price has been rising for three consecutive weeks with no sign of a bearish recovery.
In terms of the volume, a bullish range breakout is visible, where the current price is trading way above the high volume level. Primarily, the buying pressure above the high volume area suggests a potential bullish continuation where a minor downside correction is pending as a mean reversion.
In the main price chart, the 200-day Simple Moving Average is below the current price and working as a major support. Moreover, the 50-day EMA crossed over the 200-day SMA line, suggesting a potential Golden Cross formation.
In the secondary indicator window, the Relative Strength Index (RSI) remains steady above the 70.00 overbought line, suggesting buyer dominance.
Based on the overall market outlook, STRK/USDT is trading within a bullish impulsive pressure, where more upward pressure is pending. Primarily, the price is likely to move higher and find resistance from the 0.2610 Fibonacci Extension level. However, a stable price above the 0.2000 psychological line might extend the gain towards the 0.3600 area.
The alternative trading approach is to wait for a decent downside recovery as a mean reversion towards the 50-day EMA line before opening another long trade. However, an extended selling pressure below the 0.1600 level might invalidate the bullish possibility and take the price towards the 0.0800 area.
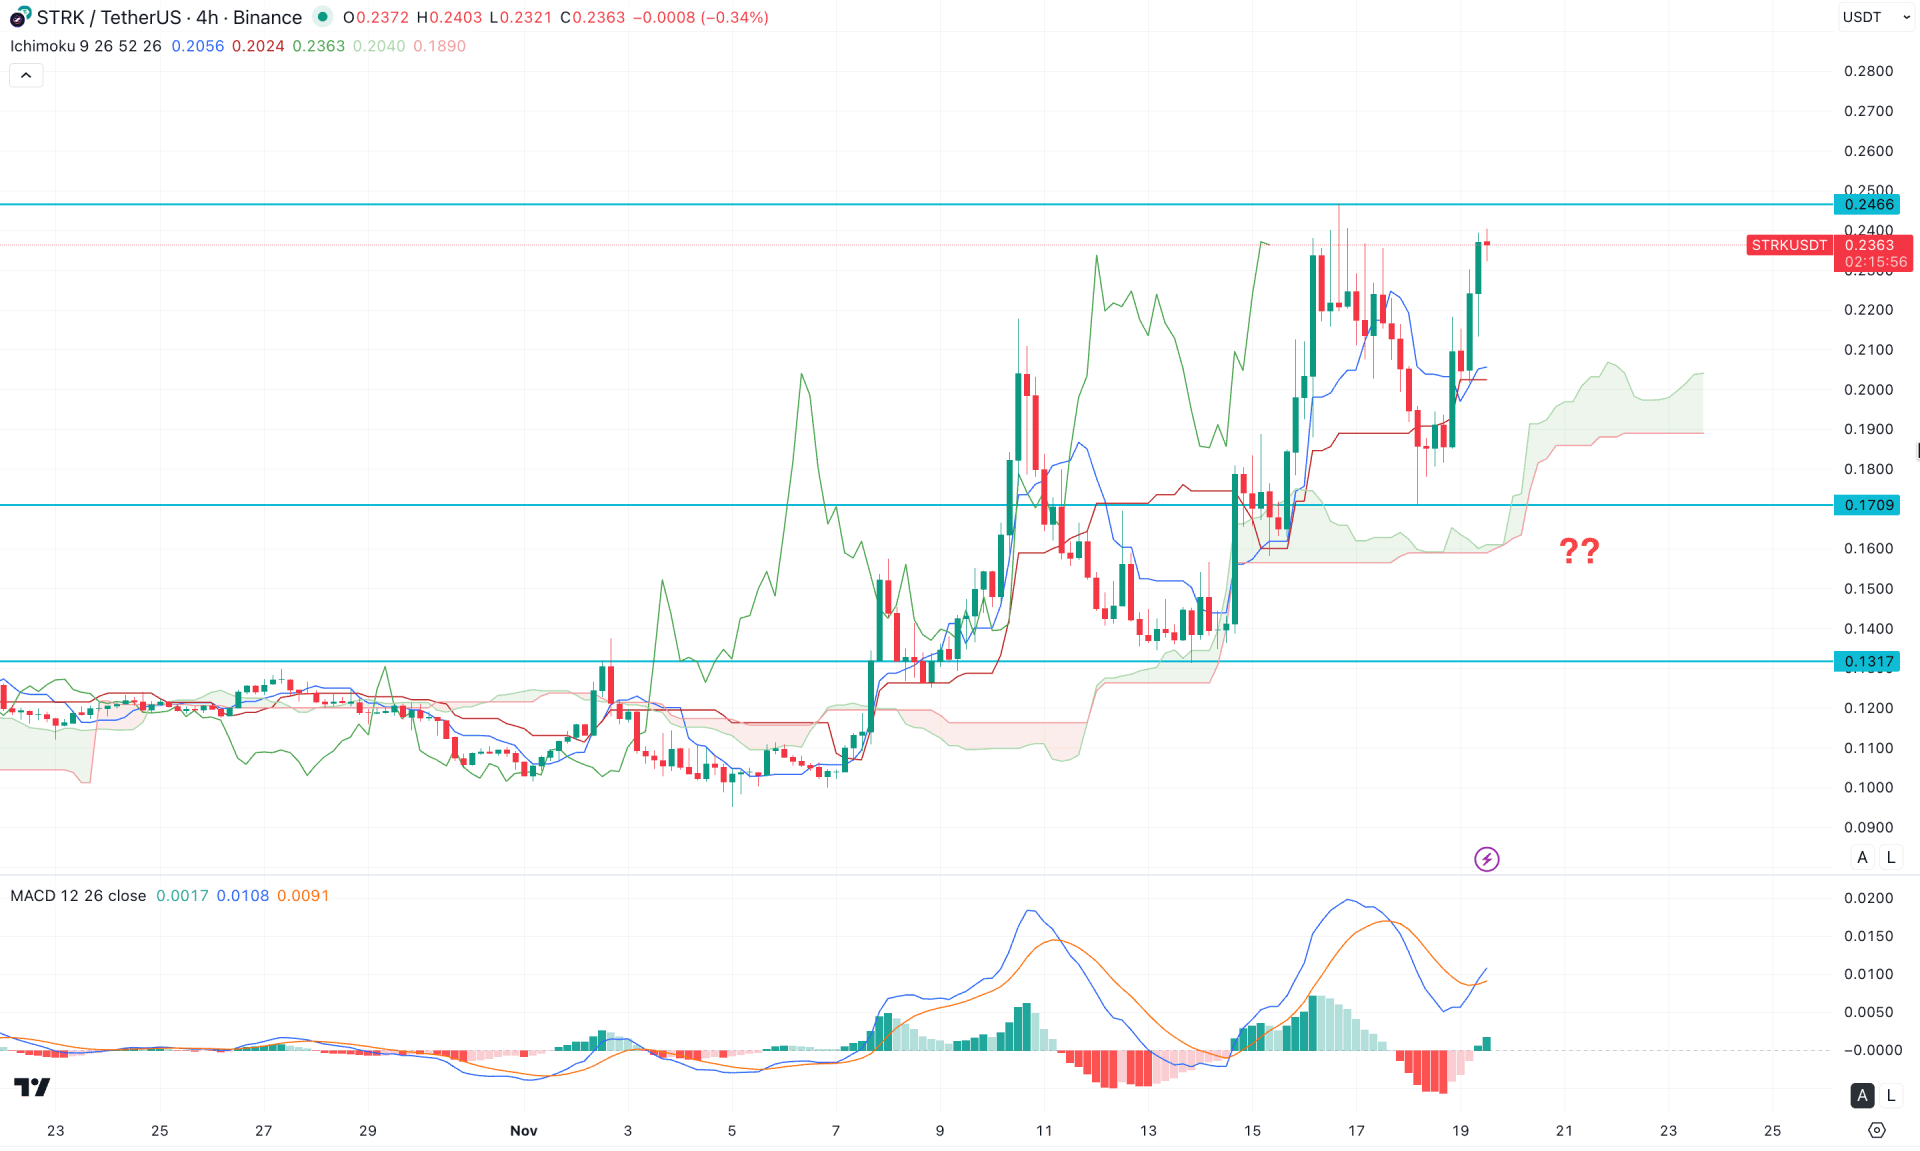
In the H4 timeframe, a bullish rally-base-rally is visible above the Ichimoku Kumo Cloud area, suggesting a stable buying pressure. Moreover, the Senkou Span A remains above the Senkou Span B, suggesting a confluence of buying pressure.
In the secondary indicator window, the MACD Histogram flipped the position to buyers' zone, where the Histogram shows a bullish crossover in the middle.
Based on this outlook, the intraday price is still bullish, from where a continuation of momentum could come from a decent downside correction. Primarily, the price is facing minor resistance at the 0.2466 level. In that case, overcoming this line could validate the bullish breakout, opening the room to reach the 0.2800 area.
On the other hand, a failure to sustain the price at the current area with an immediate bearish pressure below the cloud support might test the 0.1200 area.
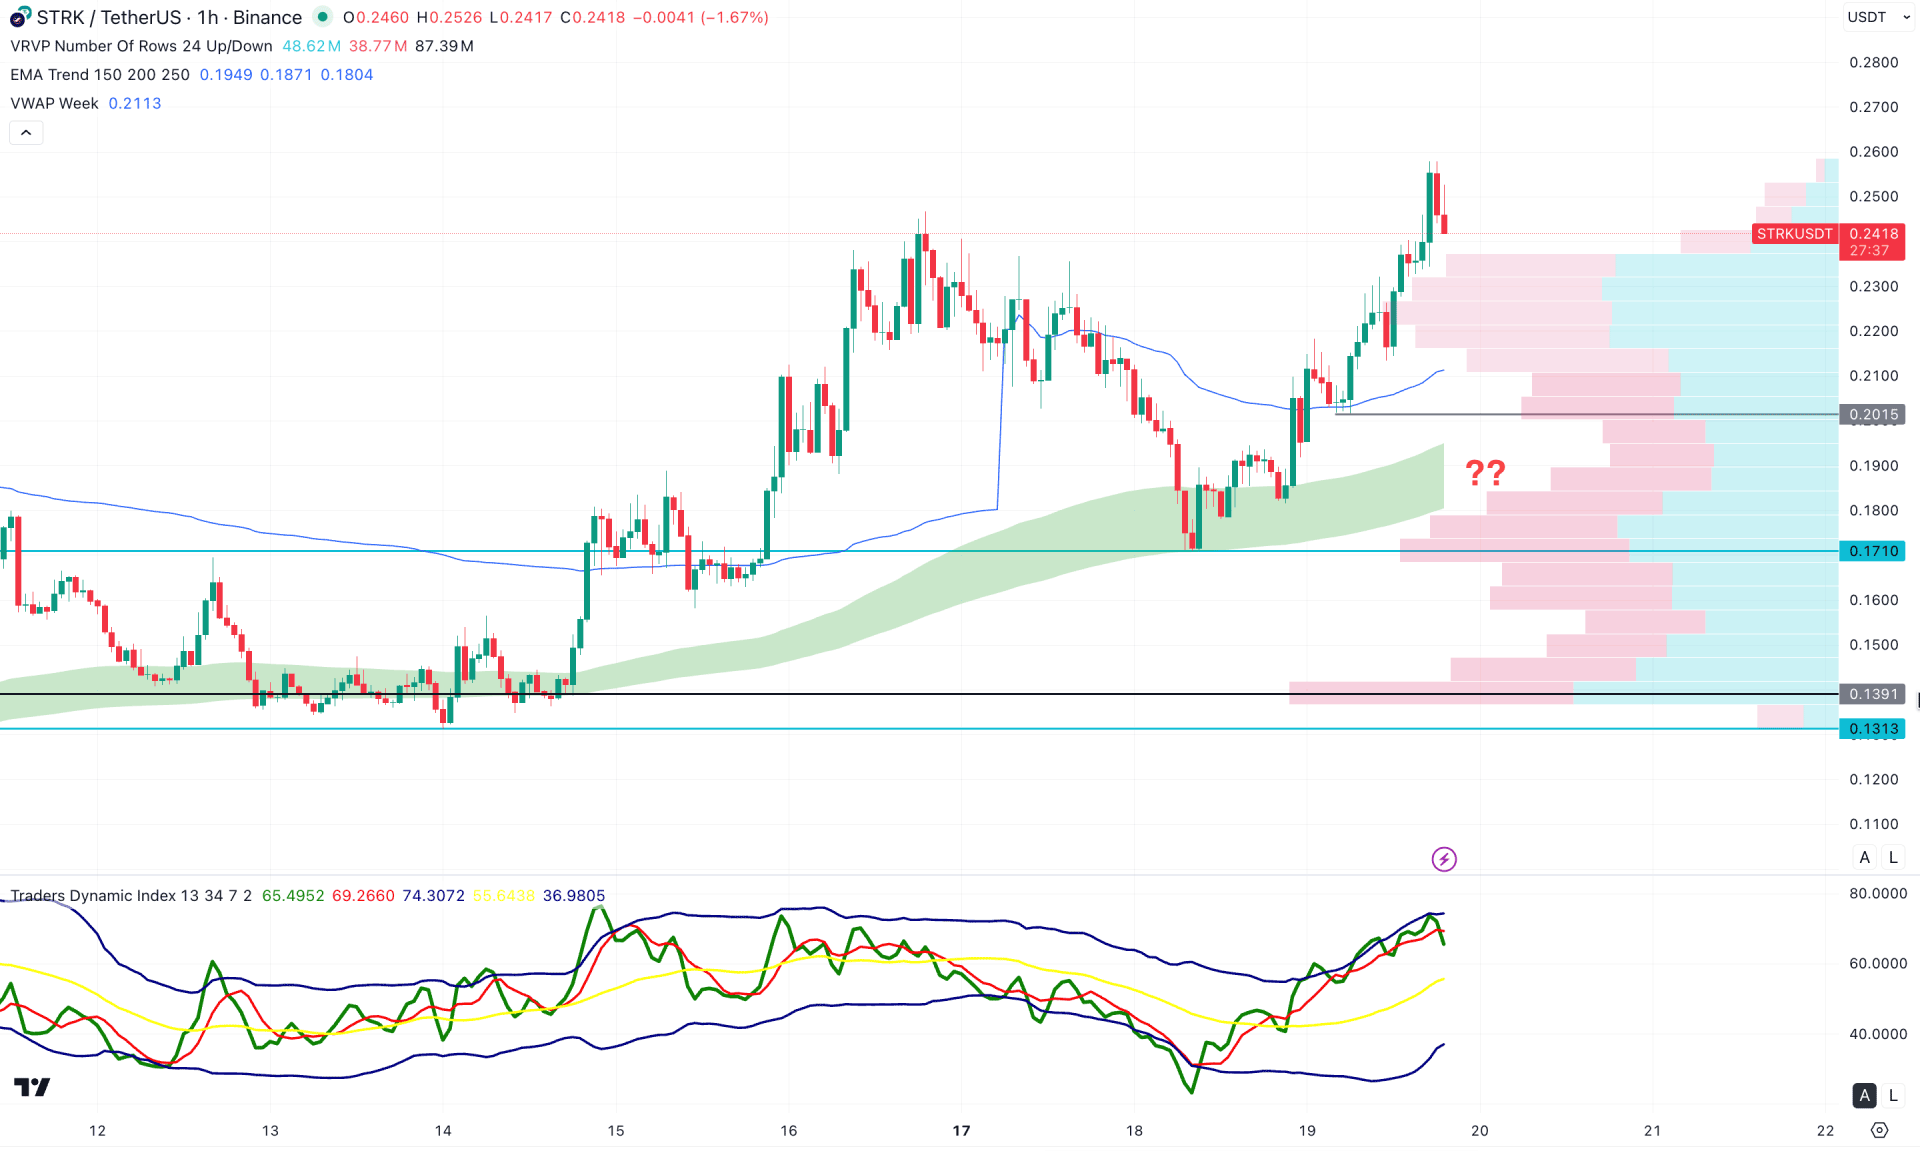
In the hourly timeframe, the ongoing buying pressure is clear, with the current price trading near the session high. Moreover, the dynamic lines are positioned below the current price with a bullish slope, supporting the broader bullish continuation structure.
In the indicator window, a top has formed as a decent recovery appears in the Traders Dynamic Index (TDI). Additionally, a failure to hold the price above the existing swing high is evident, which signals a potential downside correction within the ongoing corrective momentum.
Based on the hourly market structure, the major bullish continuation pattern may resume once the price reaches the EMA wave area and forms a valid bullish reversal candlestick pattern. For now, corrective pressure remains possible, but an extended move below the EMA wave could invalidate the intraday bullish outlook.
Based on the overall market outlook, STRK/USDT has a higher possibility of continuing its buying pressure, as the price has more room to move upward on the higher timeframe. Investors should closely monitor the market, as a decent downside correction followed by a bullish rebound from a key price area could offer a high-probability investment opportunity.


