Published: August 25th, 2021
Starbucks showed a better than expected result in its most recent fiscal Q3 results, where the company has earned $1.01 per share against the revenue of $7.5 billion. Analysts expectation on the Q3 was a gain of 77 cents a share on sales of $7.25 billion.
Starbucks CEO Kevin Johnson said that most Starbucks customers have adopted to work or study from home, which influenced the company to change some business methods. In this process, the chain has worked to attract more customer orders through digital, drive-thru, and curbside pickup. Moreover, group ordering has become more common as people are working from home in a group.
In the Q2 and Q3 of fiscal 2021, Starbucks showed a year-to-year growth of 91% and 19%, respectively. In particular, the US comps moved higher by 83% in Q3 while it entered 15 new cities in China. Mobile order sales reached a record high of 34% in China, compared to its previous quarter of 23%. The company is consistently working on expanding the business to operate 6,000 stores by the end of 2022.
Let’s see the upcoming price direction from the Starbucks Stock [SBUX] technical analysis:
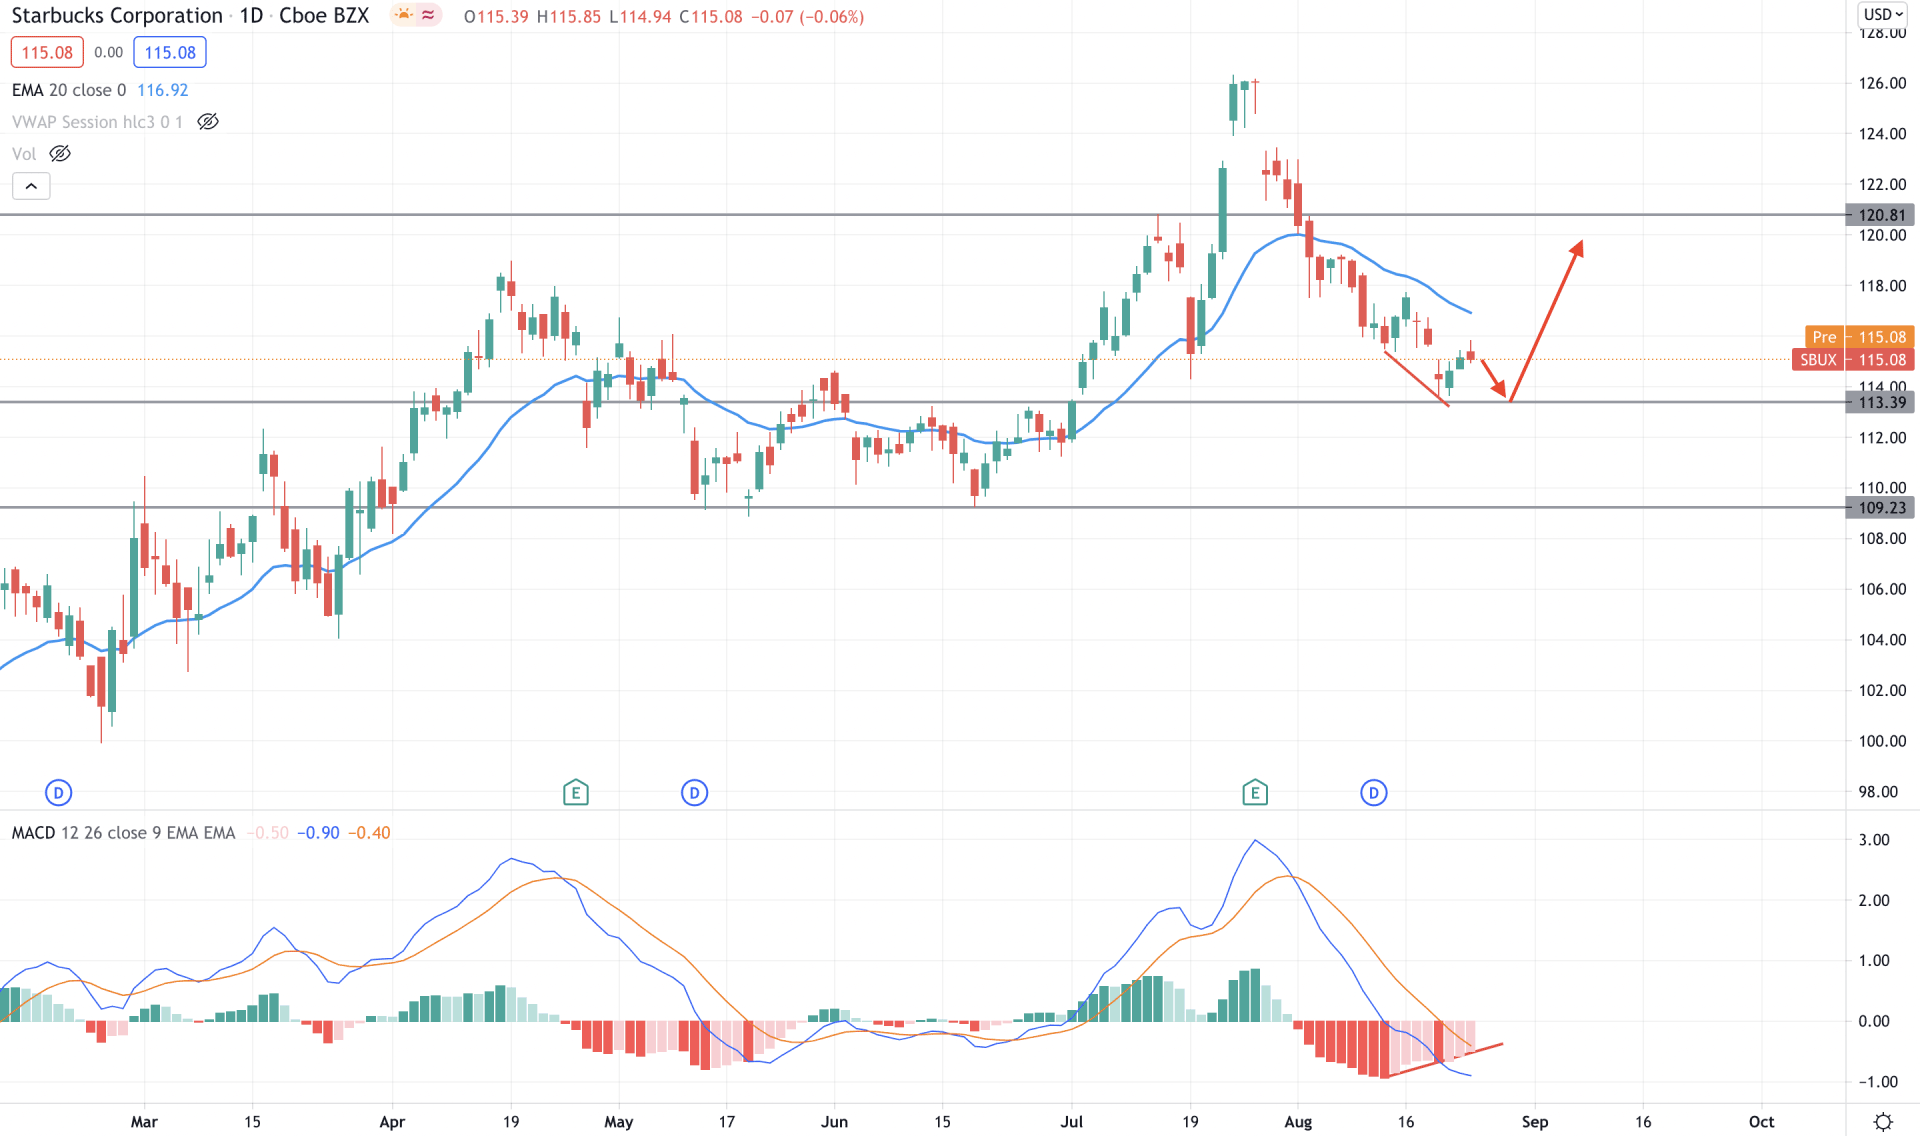
Starbucks Stock is trading within a long-term bullish trend that started from the 2020 COVID-19 market crash. As a result, the price started to increase from the bottom of $50.00 and reached a record high at 126.31 in July 2021. However, the price bounced back immediately after testing the all-time high and found support at the 113.39 level. Currently, the price is trading higher above the 113.39 level, pointing out that buyers’ may regain the momentum and take the price higher.
In the above image, we can see the daily chart of Starbucks Stock [SBUX], where the most recent price showed an indecision candle from the 113.39 support level. Later on, the price showed multiple bullish daily closes but failed to move higher above the dynamic 20 EMA.
In the indicator window, a potential Hidden divergence is forming with the MACD lines and price that may increase bullish correction. However, as the price is trading below the dynamic 20 EMA a daily close below the 113.39 level may increase the selling possibility. On the other hand, any rejection from the 113.39 level with a bullish daily close above the dynamic 20 EMA may increase the buying pressure.
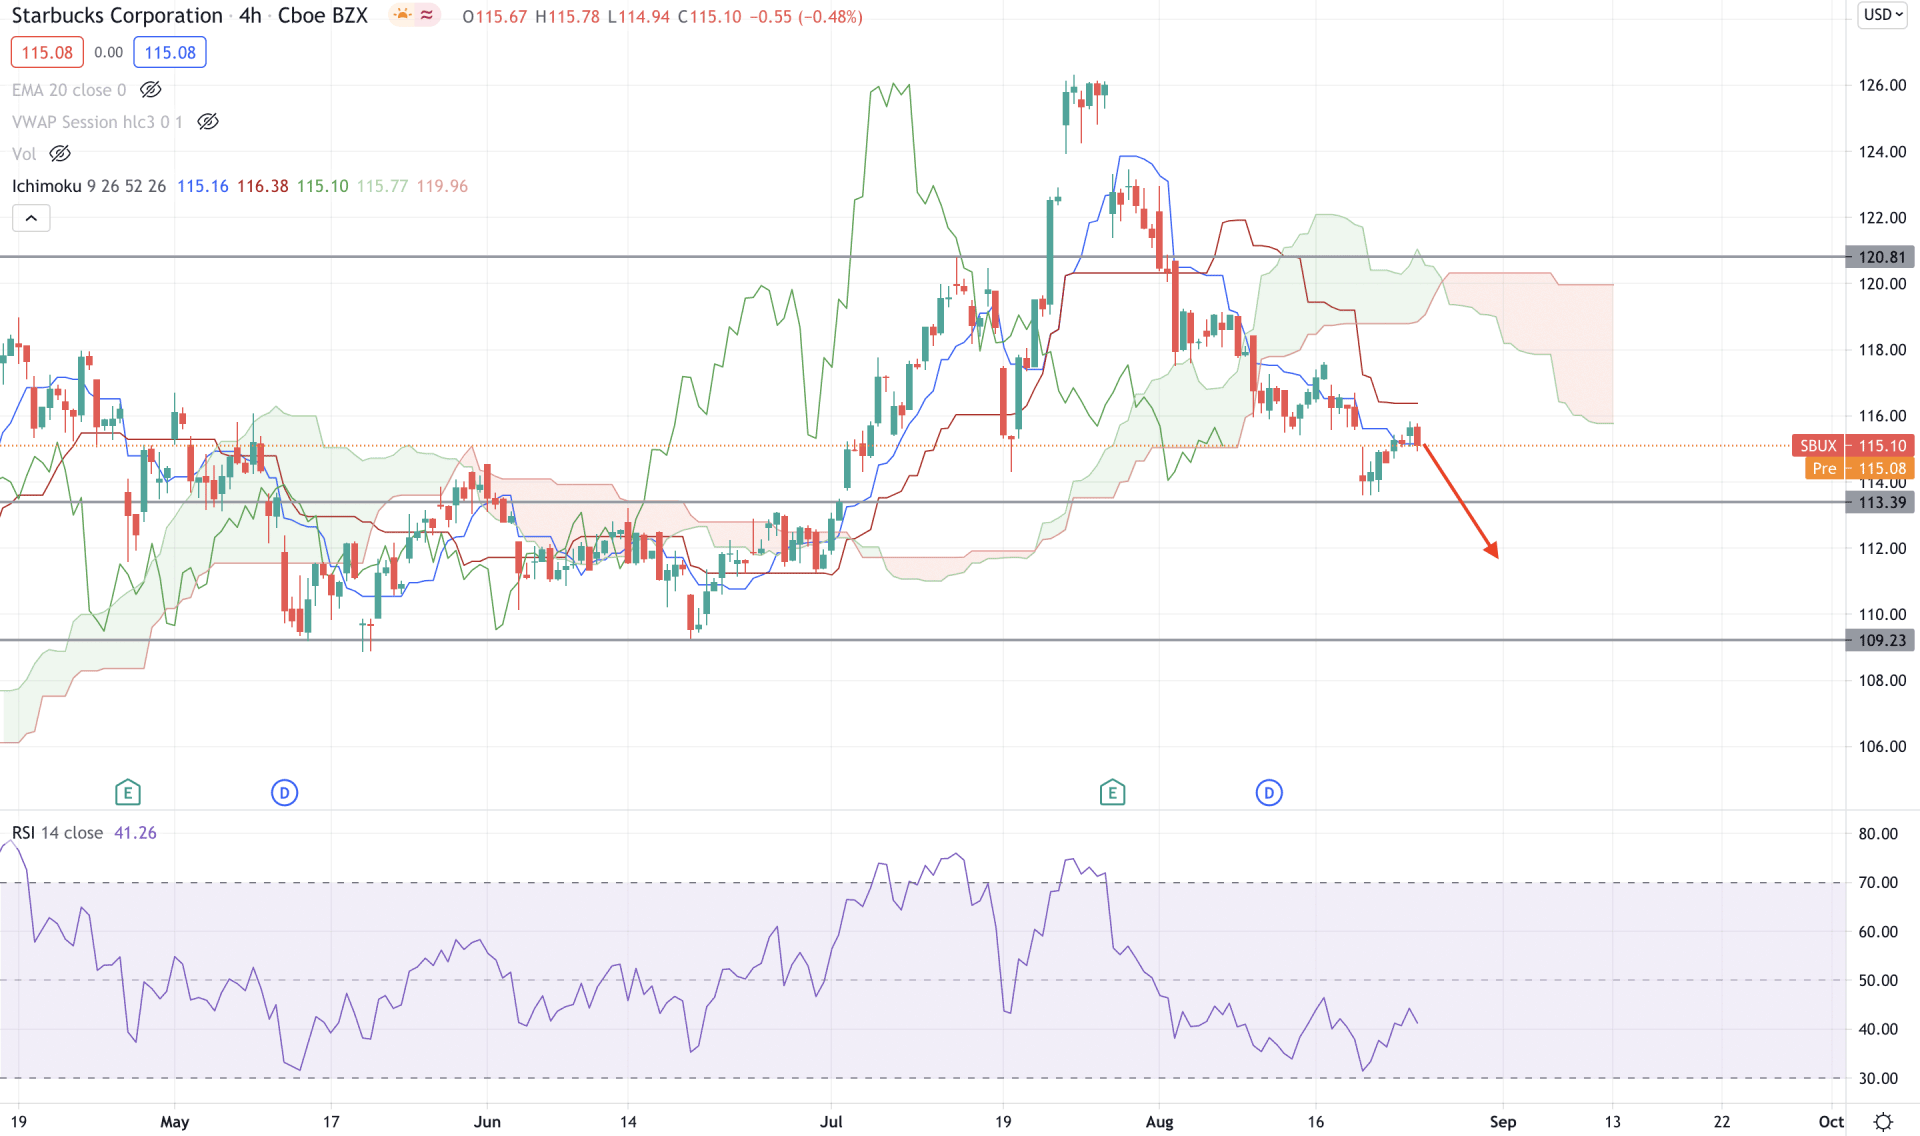
Starbucks stock moved higher above the Kumo Cloud and peaked at an all-time high at the 126.31 level but failed to hold the momentum. As a result, the price moved below the Cloud support with a bearish pressure. Moreover, in the future cloud, Senkou Span A remained below Senkou Span B, pointing out that selling pressure is strong in the price.
In the above image, we can see that the price is trading below the Cloud support and dynamic level, where the dynamic Tenkan Sen is below the Kijun Sen, indicating that short-term bears are still active in the price.
In the indicator window, we can see that the RSI is below 50 levels, possibly moving the oversold 30 levels. In that case, investors should wait for a bearish H4 close below the Tenkan Sen with the target of 109.23 support level. On the other hand, a bullish H4 close above the dynamic Kijun Sen may initiate a broader correction to the price.
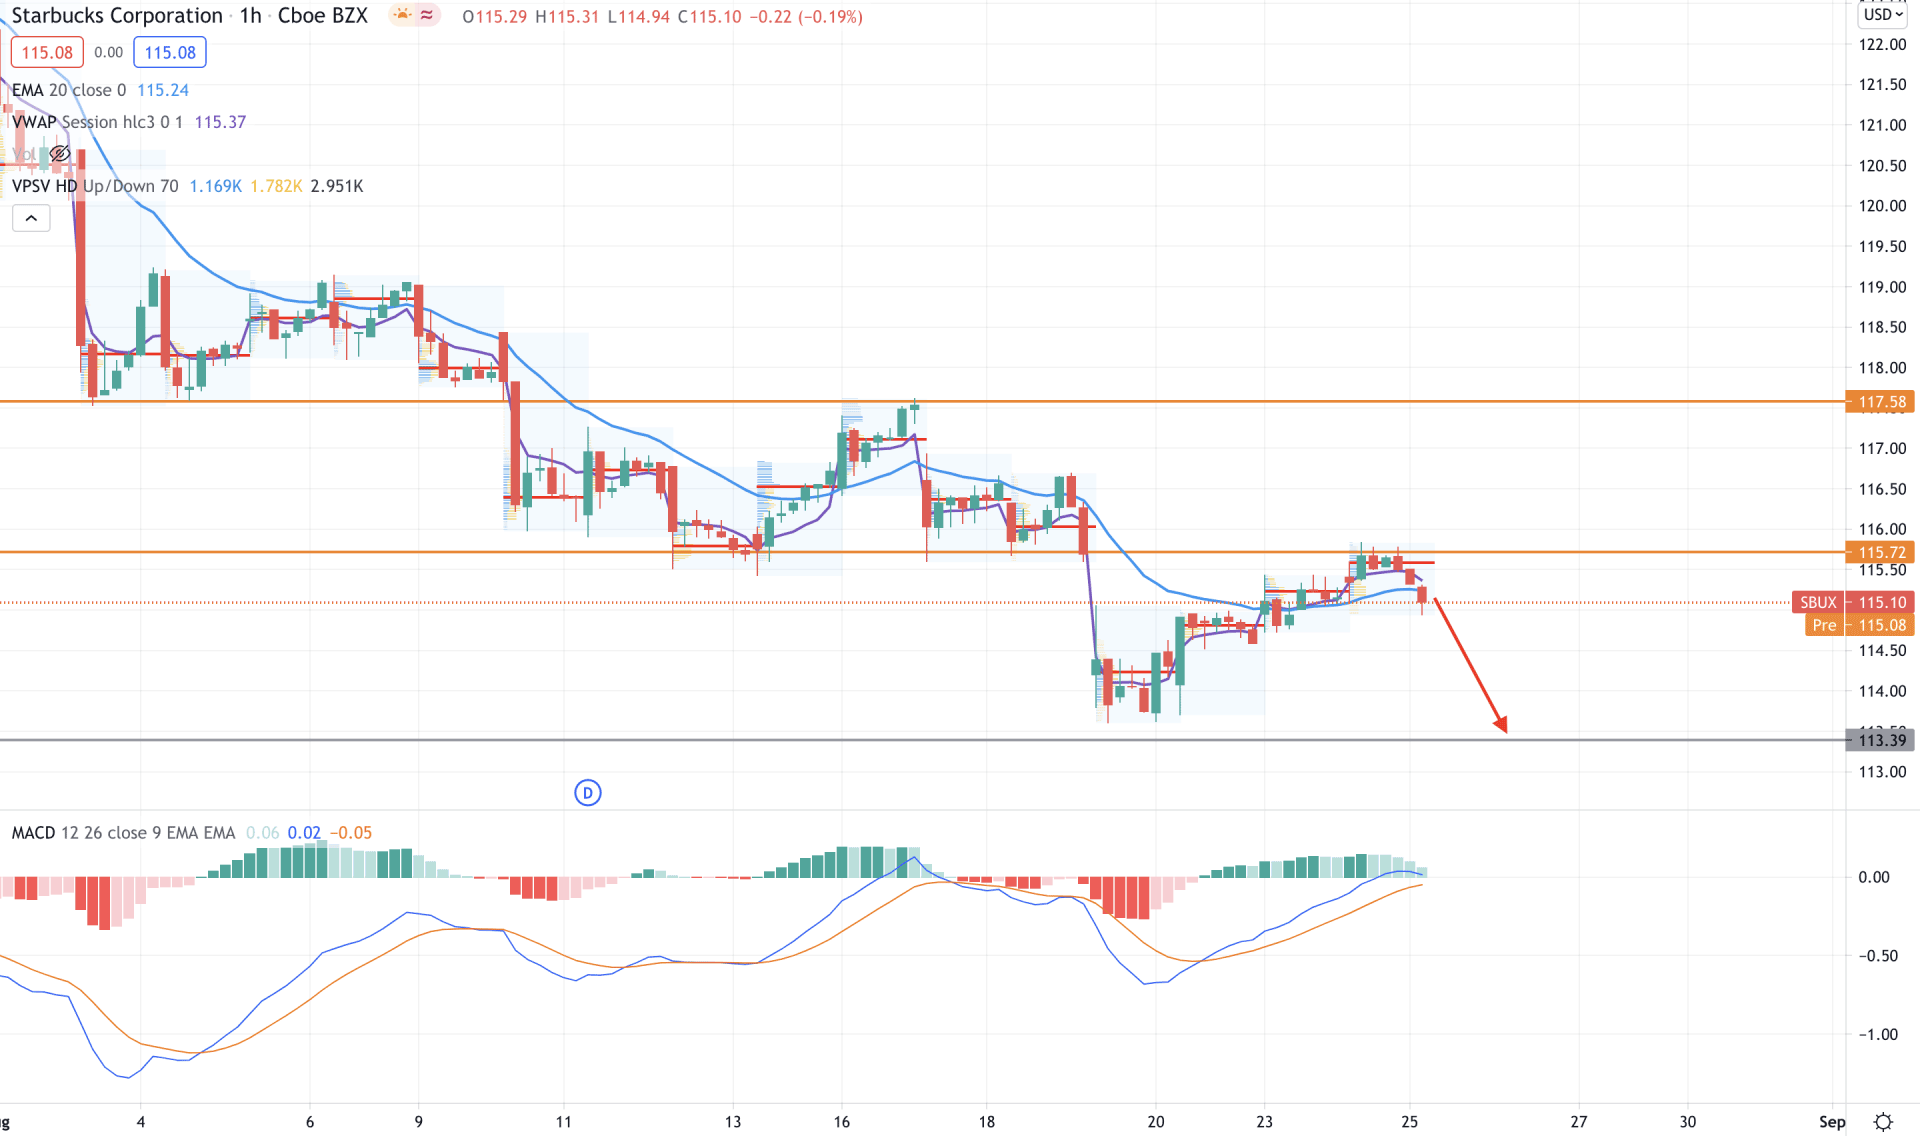
In the intraday chart, Starbucks stock is trading with a strong bearish pressure that pushed the price below the intraday event level of 115.72. In the most recent chart, the price moved below the most recent high volume level of 115.51, which increased the possibility of extending the bearish pressure as long as it is trading below the 115.72 level.
In the above image, we can see how the price is trading below the 115.72 level with a bearish H1 close. Moreover, the price moved below the dynamic 20 EMA and weekly vwap, indicating that the selling pressure may increase in the coming session.
Based on the H1 context, sellers are still active, and the price may move lower towards the 113.39 support level. However, investors should closely monitor how the price reacts on the 113.39 level. Any bounce back from this level with a bullish H1 close above the dynamic 20 EMA may initiate a long-term bull run.
As of the above observation, Starbucks stock is more likely to extend the current bearish pressure towards the 113.39 level. Moreover, a break below this level with a bearish H4 close may increase the selling pressure towards the 109.23 level.
On the other hand, any sharp rebound from the 113.39 level with a bullish daily close above the dynamic 20 EMA may resume the long-term bullish trend towards the 126.00 area.


