Published: May 4th, 2023
The sudden 10% increase of Stacks (STX) has captured traders' attention despite the bearish trend in the cryptocurrency market. This increase has brought the STX coin into the limelight, making it a topic of interest among traders. According to price analysis, traders should consider adding STX to their portfolios until it reaches the $1.0 resistance level.
Stacks is a layer constructed atop the Bitcoin blockchain that enables smart contracts and decentralized applications to settle transactions using Bitcoin as an asset. Its Proof of Transfer consensus and Clarity language allows Stacks to read the entire Bitcoin state, one of its essential characteristics.
According to data from Coinmarketcap, the market capitalization of Stacks (STX) has risen to $1.07 billion, while the completely diluted market capitalization has risen to $1.41 billion.
Let’s see the upcoming price direction of this token from the STX/USDT technical analysis:
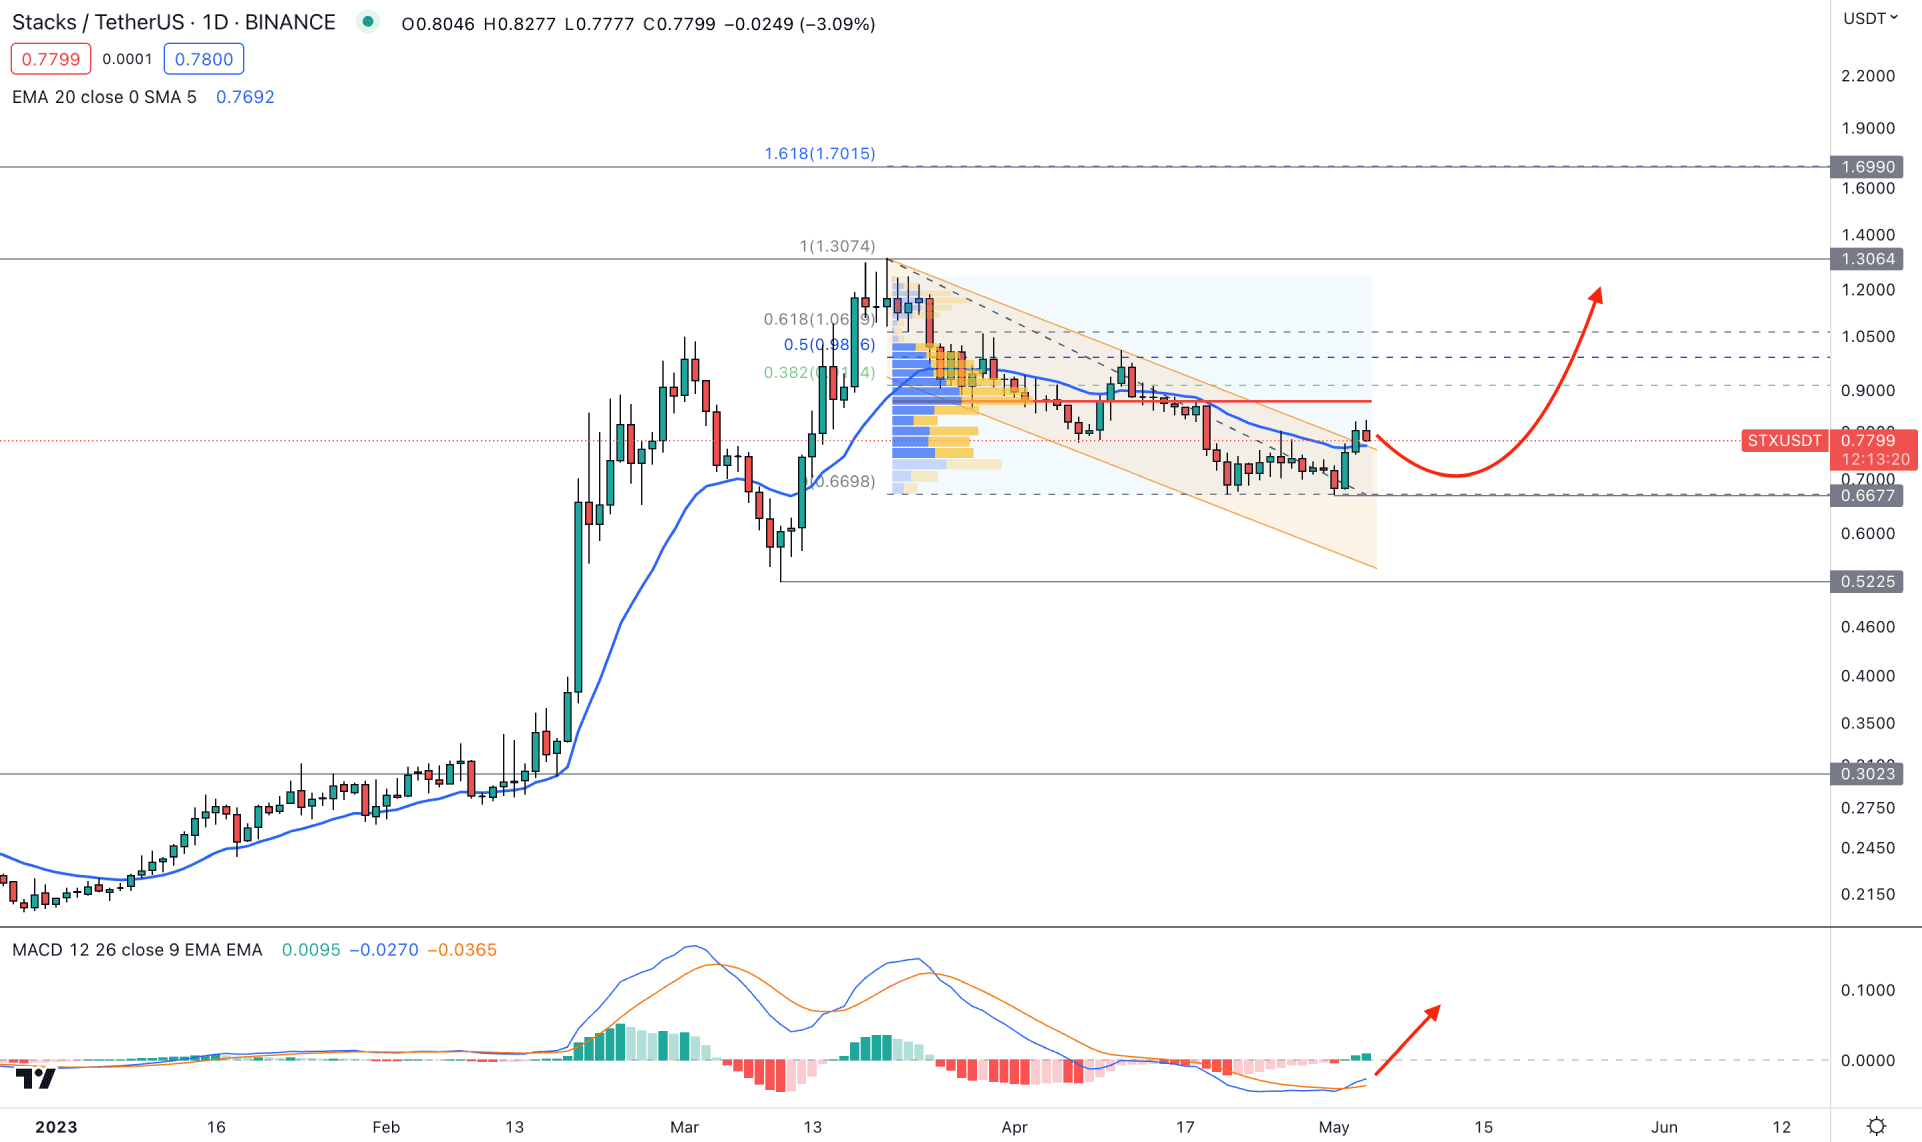
In the daily chart, the current price of STX/USDT is trading within a descending channel, where the most recent daily candle above the channel resistance indicates a bullish trend continuation opportunity.
The upside pressure is potent in the higher timeframe price action as bulls from the February 2023 monthly candle hold momentum in the next two months. Although April 2023 was bearish, it closed as an inside bar, which raises the possibility of a bullish breakout in May.
The corrective price behavior is seen from the high volume level since the 20 March high, which is 0.8720 level. As the current price is below the high volume level, another downside pressure may come before forming a buy signal.
In the main chart, the dynamic 20-day EMA is closer to the price and working as an immediate support level. Moreover, the current MACD Histogram is bullish, while MACD EMA’s have formed a bullish crossover from the oversold area.
Based on the daily outlook, the broader market context is bullish for STX/USDT, and any long opportunity could provide a higher success rate. Based on the structure, a minor downside correction may occur in this pair, but a bullish rejection from the 0.6680 to 0.5500 area could offer a high probable buying opportunity, targeting the 1.4000 psychological level.
The alternative approach is to look for bearish opportunities if the daily candle exceeds the 0.5225 support level. In that case, a bearish pressure may come, targeting the 0.3000 level.
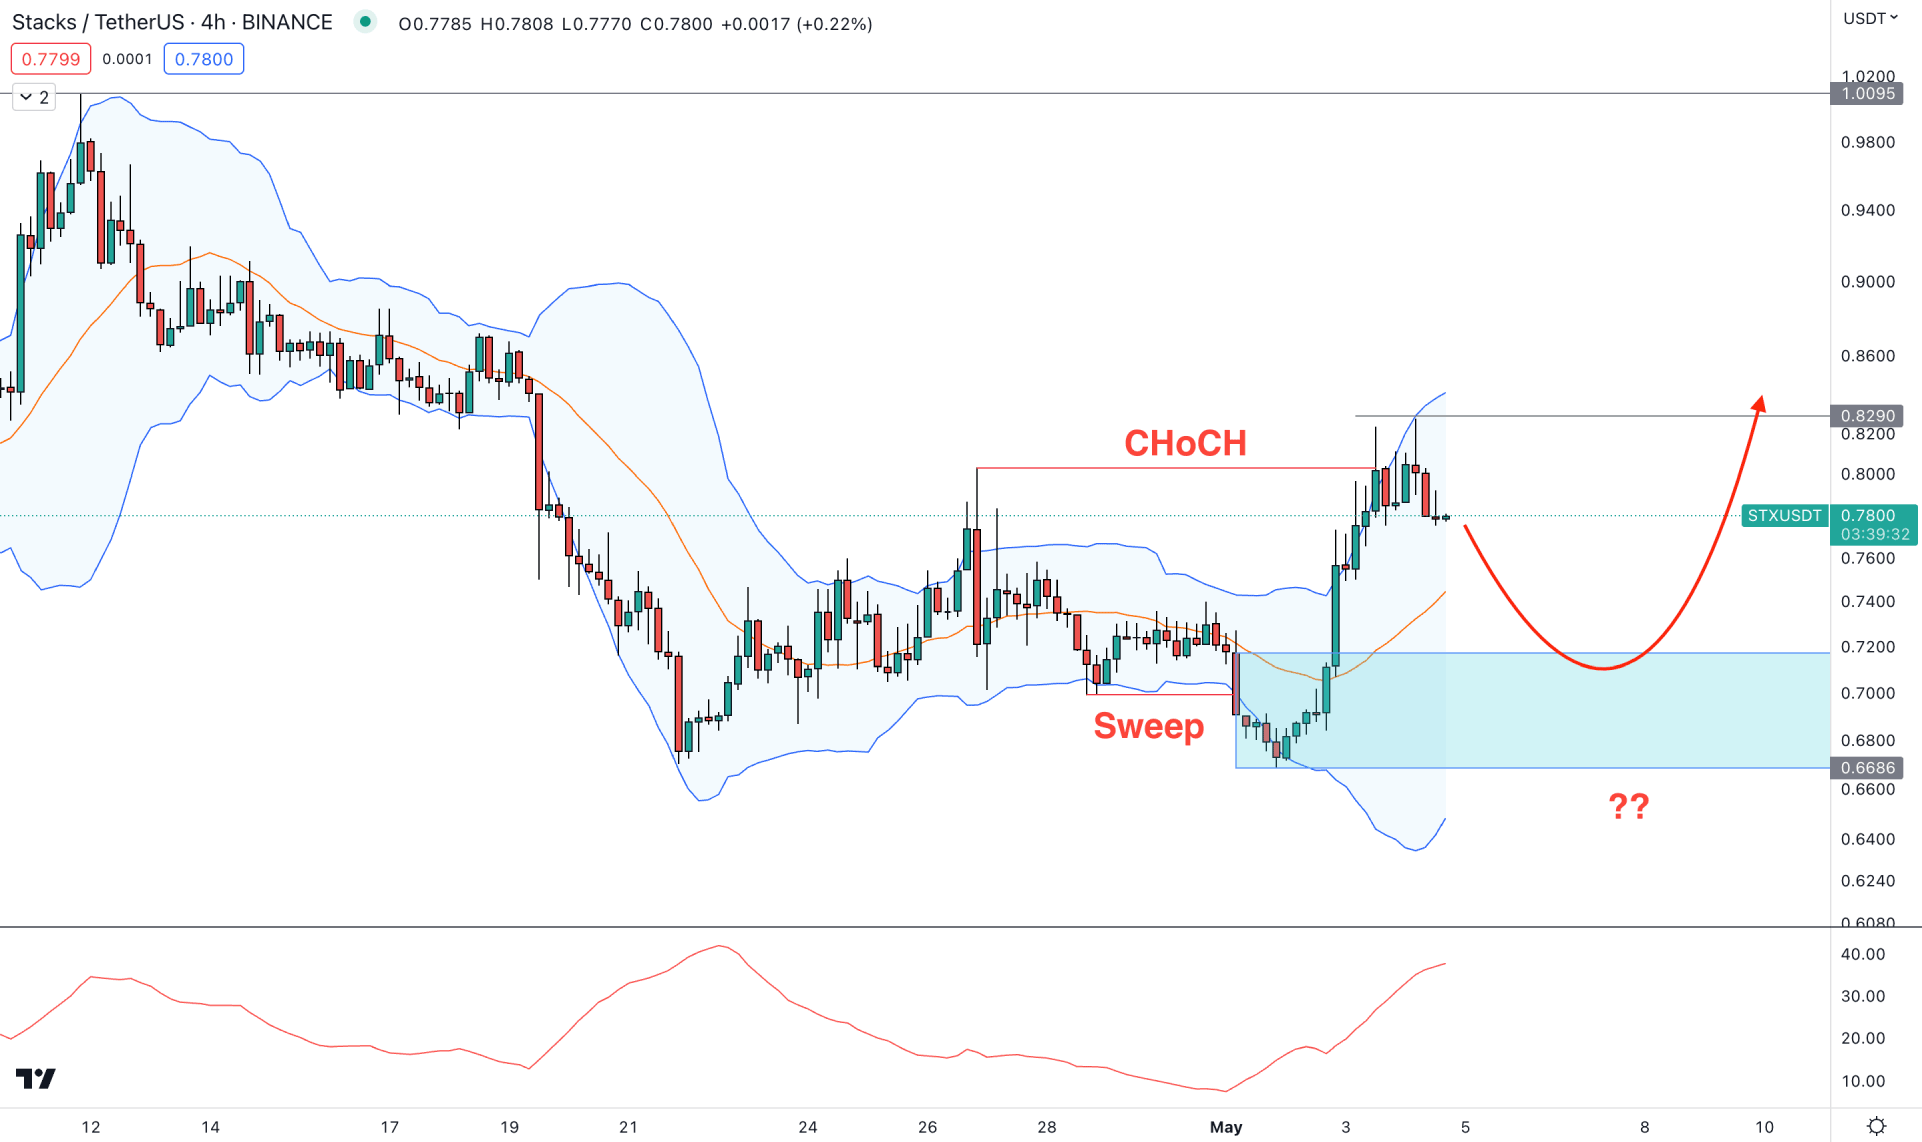
In the H4 chart, a bearish liquidity sweep with a new higher high formation above 0.8033 is the primary sign that bulls are active in the market and can regain momentum at any time.
In the most recent chart, the price trades sideways at the upper Bollinger Bands, where the 0.8290 is the near-term resistance level. As the price became volatile at the resistance, a minor downside correction may come in the coming hours.
In the indicator window, the current ADX is above the 20.00 line, which is a sign of a stable trend in the market.
Based on the current price behavior, downside pressure may come toward the middle Bollinger Bands level. However, a bullish recovery from the 0.7171 to 0.6686 demand zone could offer a long opportunity, where the ultimate target is to test the 1.0000 level.
On the other hand, a bearish opportunity is present if a new H4 candle closes below the 0.6668 level, which will increase the possibility of testing the 0.5000 level.
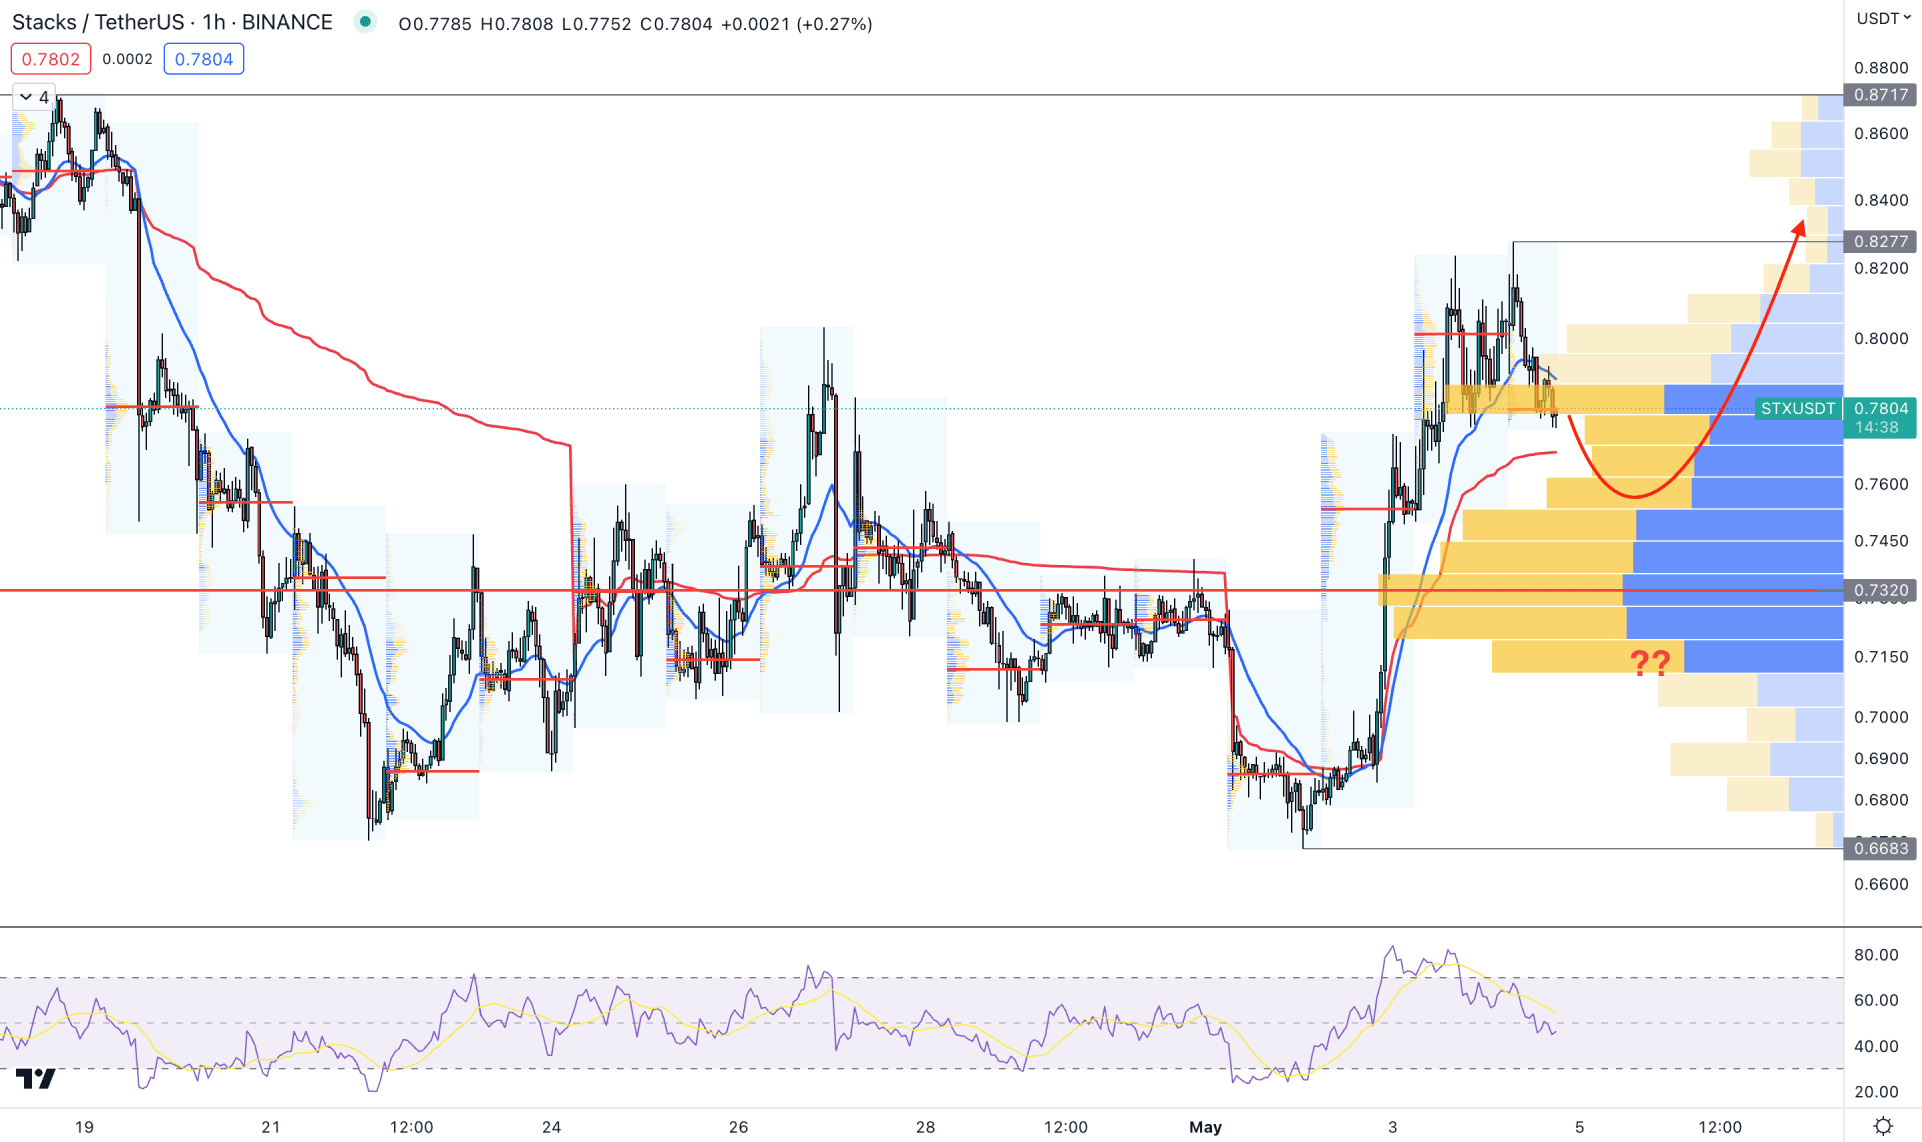
In the H1 timeframe, the broader market context is corrective, but as the recent price trades above the visible range high volume level, bulls have a higher possibility of winning the battle.
The downside correction in the main price chart pushed the price below the 20 EMA support, while the weekly VWAP is still untested. A corrective pressure is seen from the indicator window, where the current RSI level is at the neutral 50.00 level.
Based on the H1 structure, extending the downside pressure with a strong bullish rebound above the dynamic 20 EMA support could increase the price in the coming days. However, breaking below the 0.7320 high volume level with a bearish H4 candle could eliminate the buying possibility and lower the price toward the 0.6683 level.
Based on the current findings, STX/USDT buying pressure is valid as long as the price trades above the 0.5225 critical support level. The ideal trading approach in this pair is to find a strong intraday bullish rejection from near-term support levels to join the long-term trend.


