![Square Stock [SQ] Found Bottom While CEO-Sharing Arrangement Ends](https://d3kvcd8uuqwmxt.cloudfront.net/filecache/articles_img/tech-analysis-main-page.jpg_841_61a9dc0c3fb322.31972308.jpeg)
Published: December 2nd, 2021
Square Stock grabbed investors’ attention as soon as the Square [SQ] and Twitter [TWTR] CEO resigned from Twitter. From 29 November, Jack Dorsey will devote all of his efforts to Square, where the significant change may come with integrating blockchain technology.
Under Dorsey, Square has embraced Bitcoin. Moreover, the company said that they have a plan to change the company name to Block while keeping the ticker as SQ. It is a clear sign that the company has a solid commitment to blockchain technology.
As of December 1, Square stock dropped 4.5% in 2021 and marked itself as under-performing against the S&P 500 index. Moreover, Square reported the September quarter report where the revenue and gross payment volume missed analysts’ expectations due to its slow growth for the consumer cash App.
In the price chart, Square stock [SQ] is nearing the 190.00 support level from where a bullish pressure is expected. In that case, any development of blockchain implementation and Cash App would be a strong influencer.
Let’s see the upcoming price direction from the Square Stock [SQ] technical analysis:
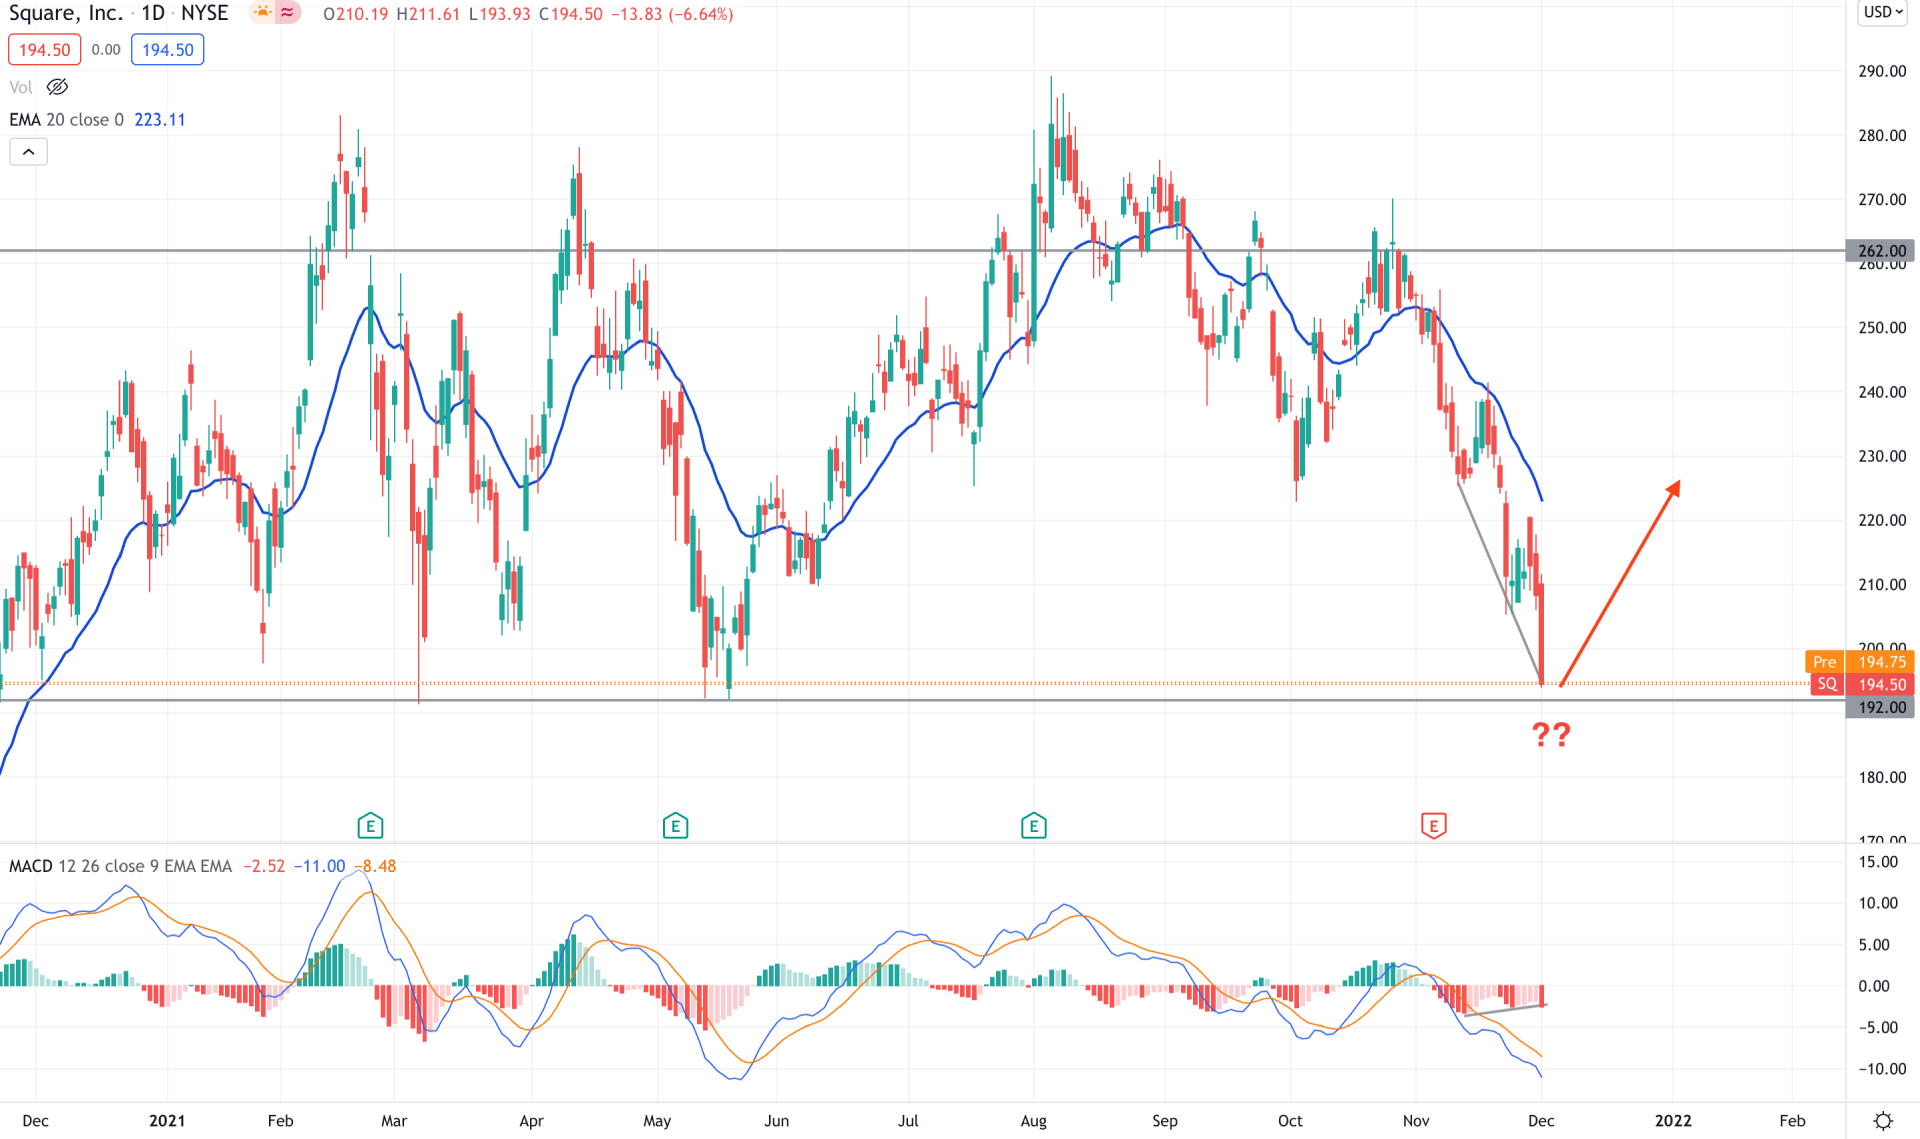
Square Stock is trading within a long consolidation where the long upside movement backs the bullish pressure during the COVID-19 pandemic. However, the price tried to breach the 280.00 level but failed to hold the momentum. As a result, the most recent price shot lower after testing the 289.23 all-time high and made a swing low at the 222.92 level. Later on, bulls tried to get momentum, but an aggressive selling pressure from the 262.00 area forced the price to decrease with impulsive pressure.
The above image shows how the price moved lower from the dynamic 20 EMA resistance and reached near the 192.00 key support level. The aggressive selling pressure extended the gap between the price and dynamic 20 EMA with a possibility of a bullish correction. Moreover, the Hidden Divergence with the MACD Histogram is another sign of possible bullish pressure.
Based on the daily context, investors should closely monitor how Jack Dorsey implements blockchain technology in its payment system. Any sign of development with a bullish rejection from the 192.00 area would attract bulls for the coming days. On the other hand, any fresh low below the 192.00 level would lower the price towards the 152.00 area.
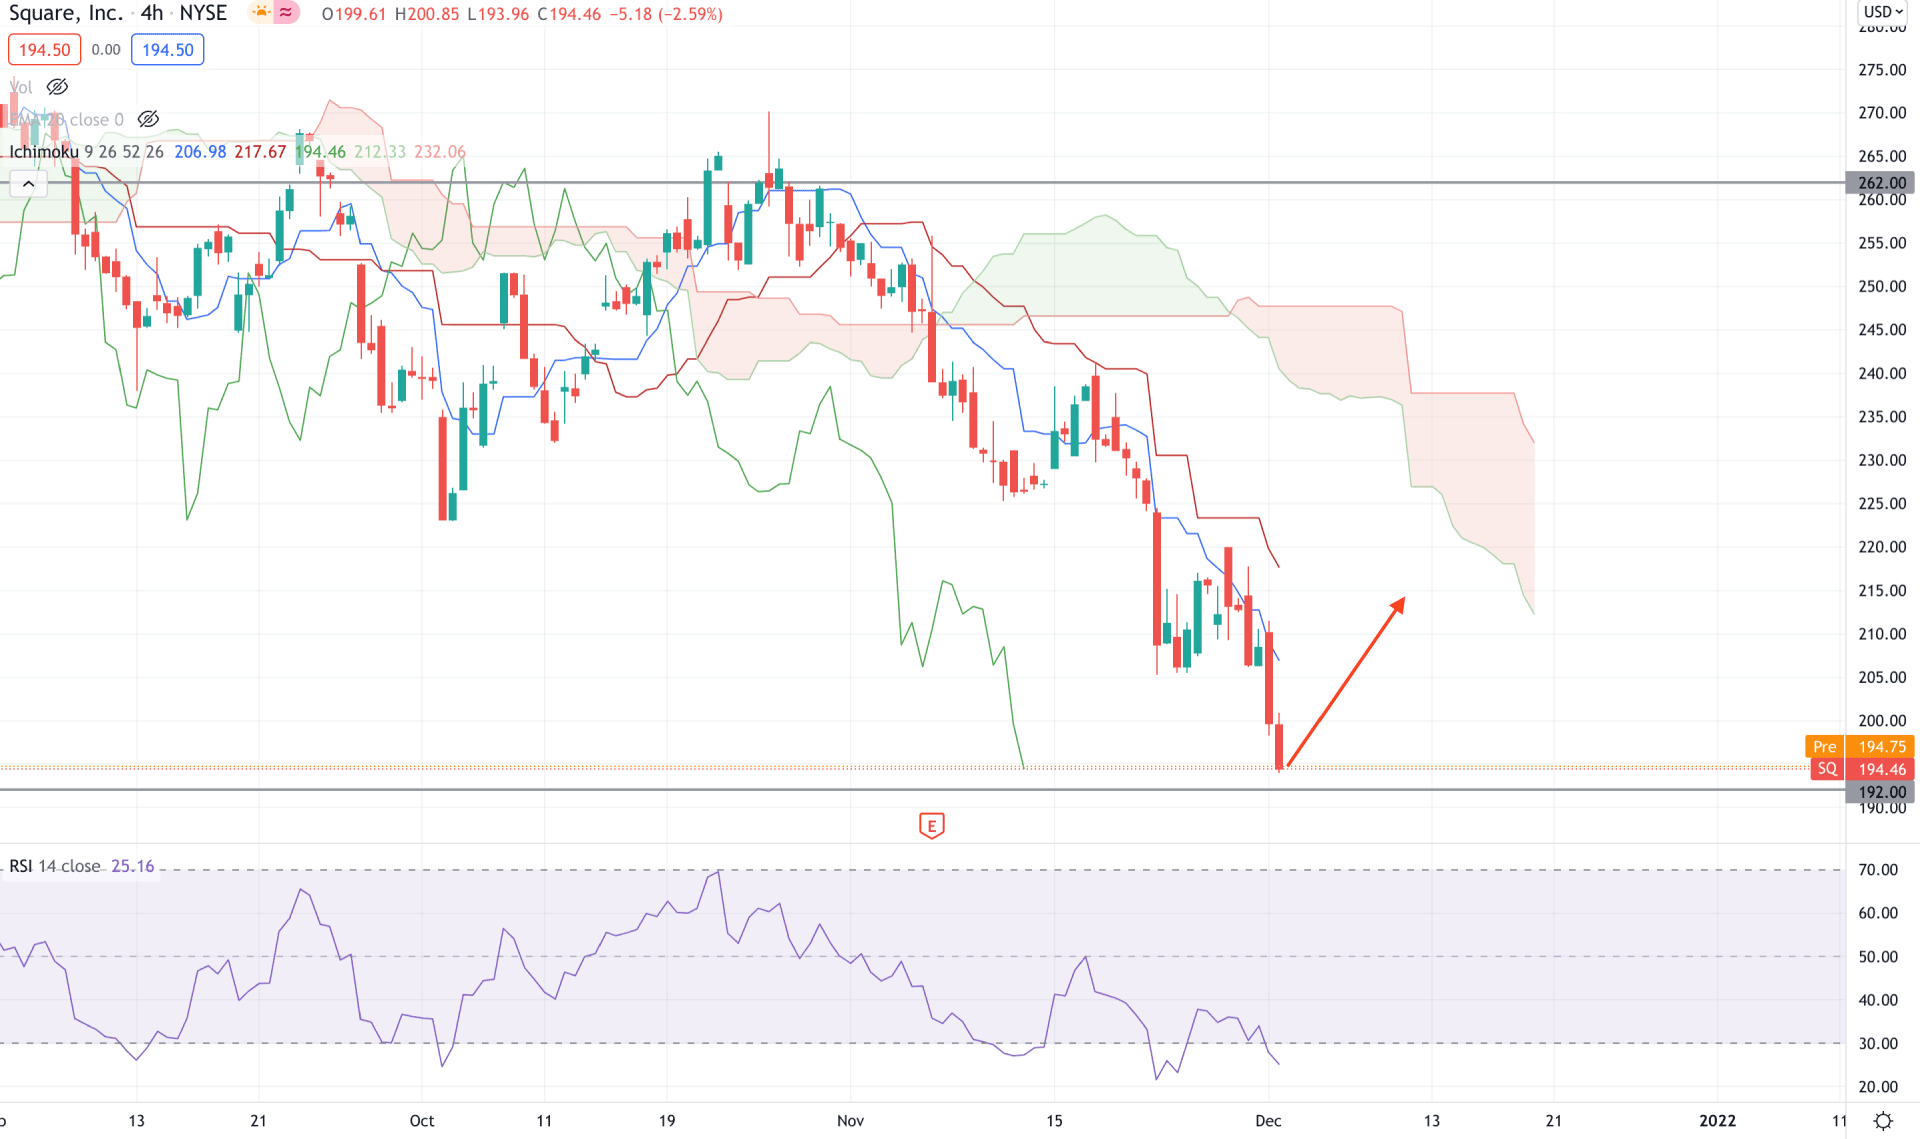
According to the Ichimoku Kinko Hyo, Square Stock is trending lower where the current price is trading below the Kumo Cloud with extensive selling pressure. In the future cloud, Tenkan Sen is below the Kijun Sen and aiming lower while the Chikou Span is below the price. However, the gap between the price and Kumo Cloud is extended, which indicates a possibility of a bullish correction.
The above image shows how the RSI is trading at the oversold level with a regular divergence with the price. Meanwhile, dynamic Tenkan Sen and Kijun Sen are working as resistance while a mean reversion is pending in the price. Therefore, based on the H4 context, a bullish correction is pending where any bearish pressure from the dynamic Kijun Sen may resume the current bearish pressure towards the 180.00 area.
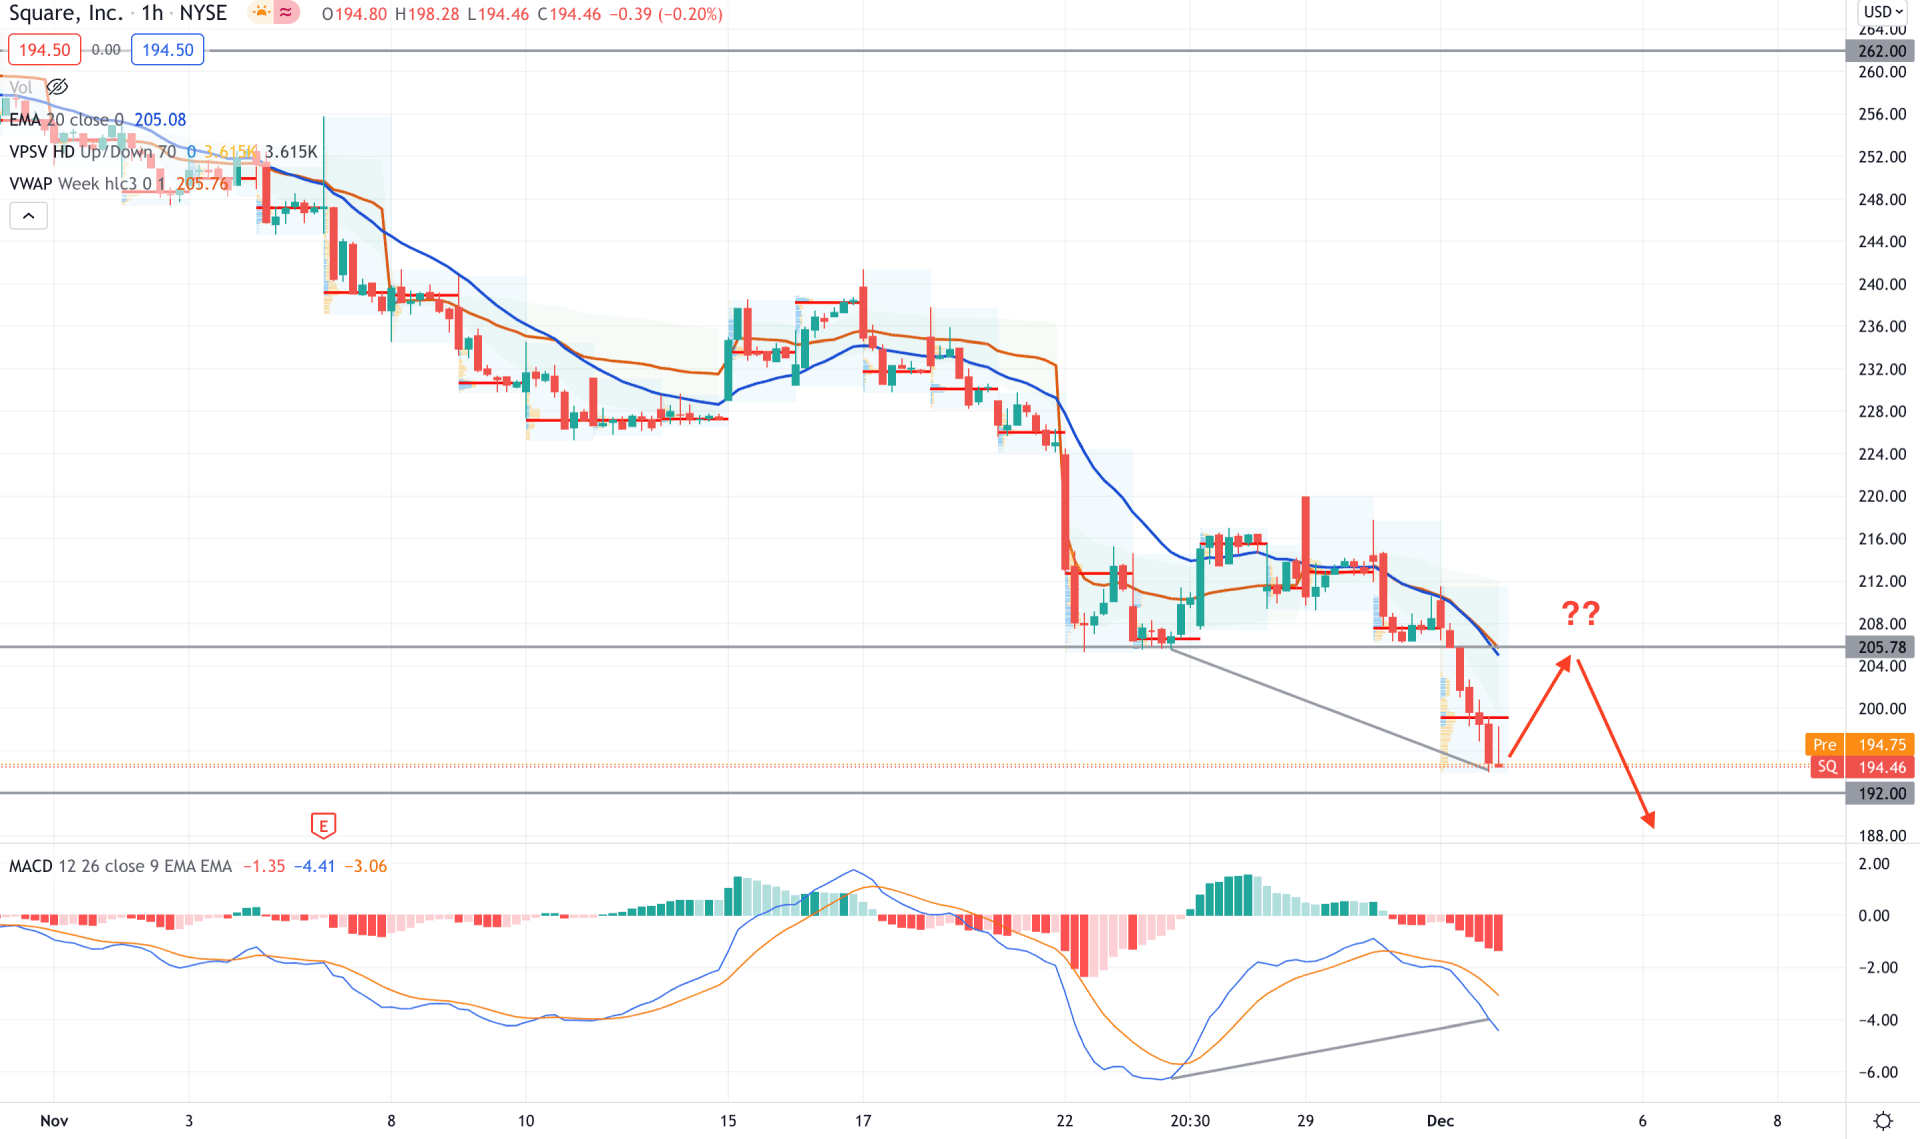
In the intraday chart, Square stock is moving down with an impulsive selling pressure where the current price is trading below the dynamic 20 EMA and weekly VWAP. Moreover, intraday trading volumes are aiming lower, which is a sign of possible selling pressure in the price.
The above image showed how the regular divergence formed with MACD lines where the price is just above the 192.00 key support level. Therefore, based on the H1 context, any buying pressure with the bullish H1 close above the 205.78 intraday event-level would be a potential buying opportunity in this pair with the target of 262.00 level.
As per the current market condition, Square Stock [SQ] has a higher possibility of moving up if the price shows a bullish rejection from the 192.00 level. In that case, the bullish pressure may extend towards the 262.00 area. On the other hand, a break below the 192.00 level with a bearish daily close may alter the current market structure and initiate a broader correction.


