Published: July 8th, 2025
According to Santiment's latest data, SPX6900 is at the top of whale activity statistics. Transactions reached an all-time high on June 9, driven by heightened market speculation. However, the market performance of SPX6900 has undergone significant changes, primarily due to price fluctuations triggered by whale activity. These fluctuations, which mirror previous patterns observed in cryptocurrencies, prompt market researchers to propose potential short-term adjustments.
Despite an excellent weekend performance, SPX6900 (SPX) lost momentum to start the week. Some investors are expecting a swift recovery, but several signs indicate a deeper retreat for the SPX, which could even drop below the crucial $ 1.000 threshold.
The Coins' Holding Time statistic, which gauges the length of time a digital currency has been kept before being traded or sold, has decreased for SPX from an on-chain perspective. It indicates that holders have held off on selling when it rises. If this trend continues, there may be reduced selling pressure, which could lead to a price increase.
A bullish mood would have prevailed if it had risen. But the drop in those transactions also suggests that purchasing power is waning. If maintained, the price of SPX6900 may prove challenging for it to recover rapidly soon.
Let's see the complete price outlook from the SPX/USDT technical outlook:
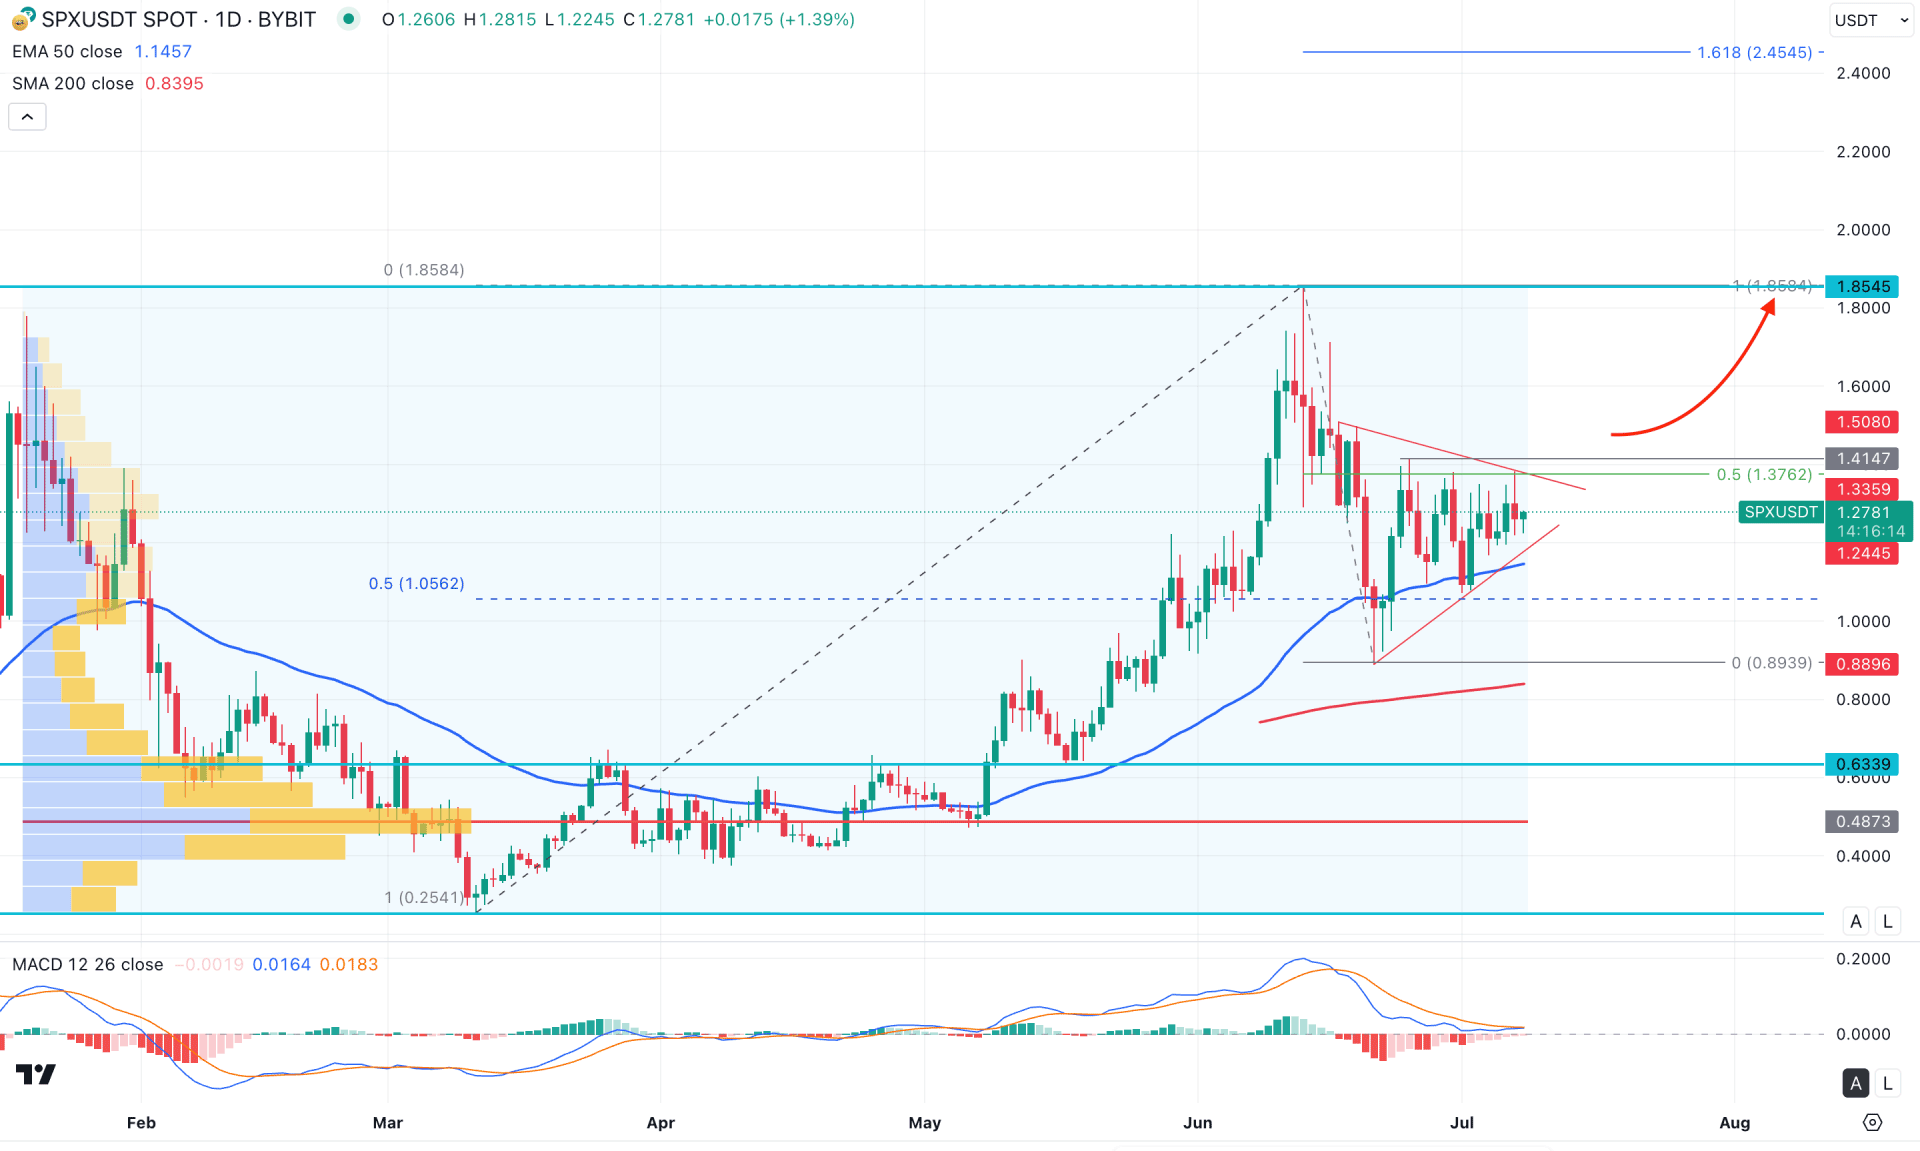
In the SPX/USDT daily chart, the recent price action shows a strong bullish recovery with continuous momentum. As the existing market trend is bullish, any sign of a near-term bullish breakout could signal the continuation of the long-term market trend.
Looking at the higher time frame, the buying pressure remains valid, with three consecutive monthly bullish candles visible since April 2025. The weekly chart tells a similar story, where the most recent candle closed as a bullish inside bar formation. In that case, a breakout above the 1.4171 weekly high could validate a long-term bullish continuation signal.
In terms of volume, the bullish pressure is also supported. The largest high-volume level since January 2025 is at the 0.4873 mark, which is 63% below the current price. Although the high-volume line remains below the current price zone, the volume gap suggests a possible downside correction.
On the main price chart, the 200-day Simple Moving Average is holding the buying pressure, supported by the rising the 50-day Exponential Moving Average. A strong bullish continuation is evident as the price formed a solid reversal from the 50-day EMA level.
In terms of price behavior, the market initiated a downside correction after forming a top at the 1.8545 level and reached the 50% Fibonacci retracement level. After finding sufficient buy-side liquidity, the price moved higher. However, instead of forming a new swing high, it began trading sideways. As a result, a symmetrical triangle formation is observed, from which a breakout could serve as a trigger point.
In the secondary indicator window, sideways market momentum is present, as the MACD histogram flipped from bearish to bullish. Moreover, the signal line has flattened, staying above the neutral level.
Based on the current structure, a stable bullish continuation above the 1.4147 level could present a high-probability buying opportunity. The main aim would be to test the 1.855 level before potentially moving toward the 2.0000 psychological resistance.
On the bearish side, some downside correction is still possible, as the price is trading near the resistance of the symmetrical triangle. The near-term support is found at the 50-day EMA. However, a strong wave of selling pressure with a new low below the 1.0000 level could trigger a revisit to the 200-day SMA, which is currently at the 0.8790 level.
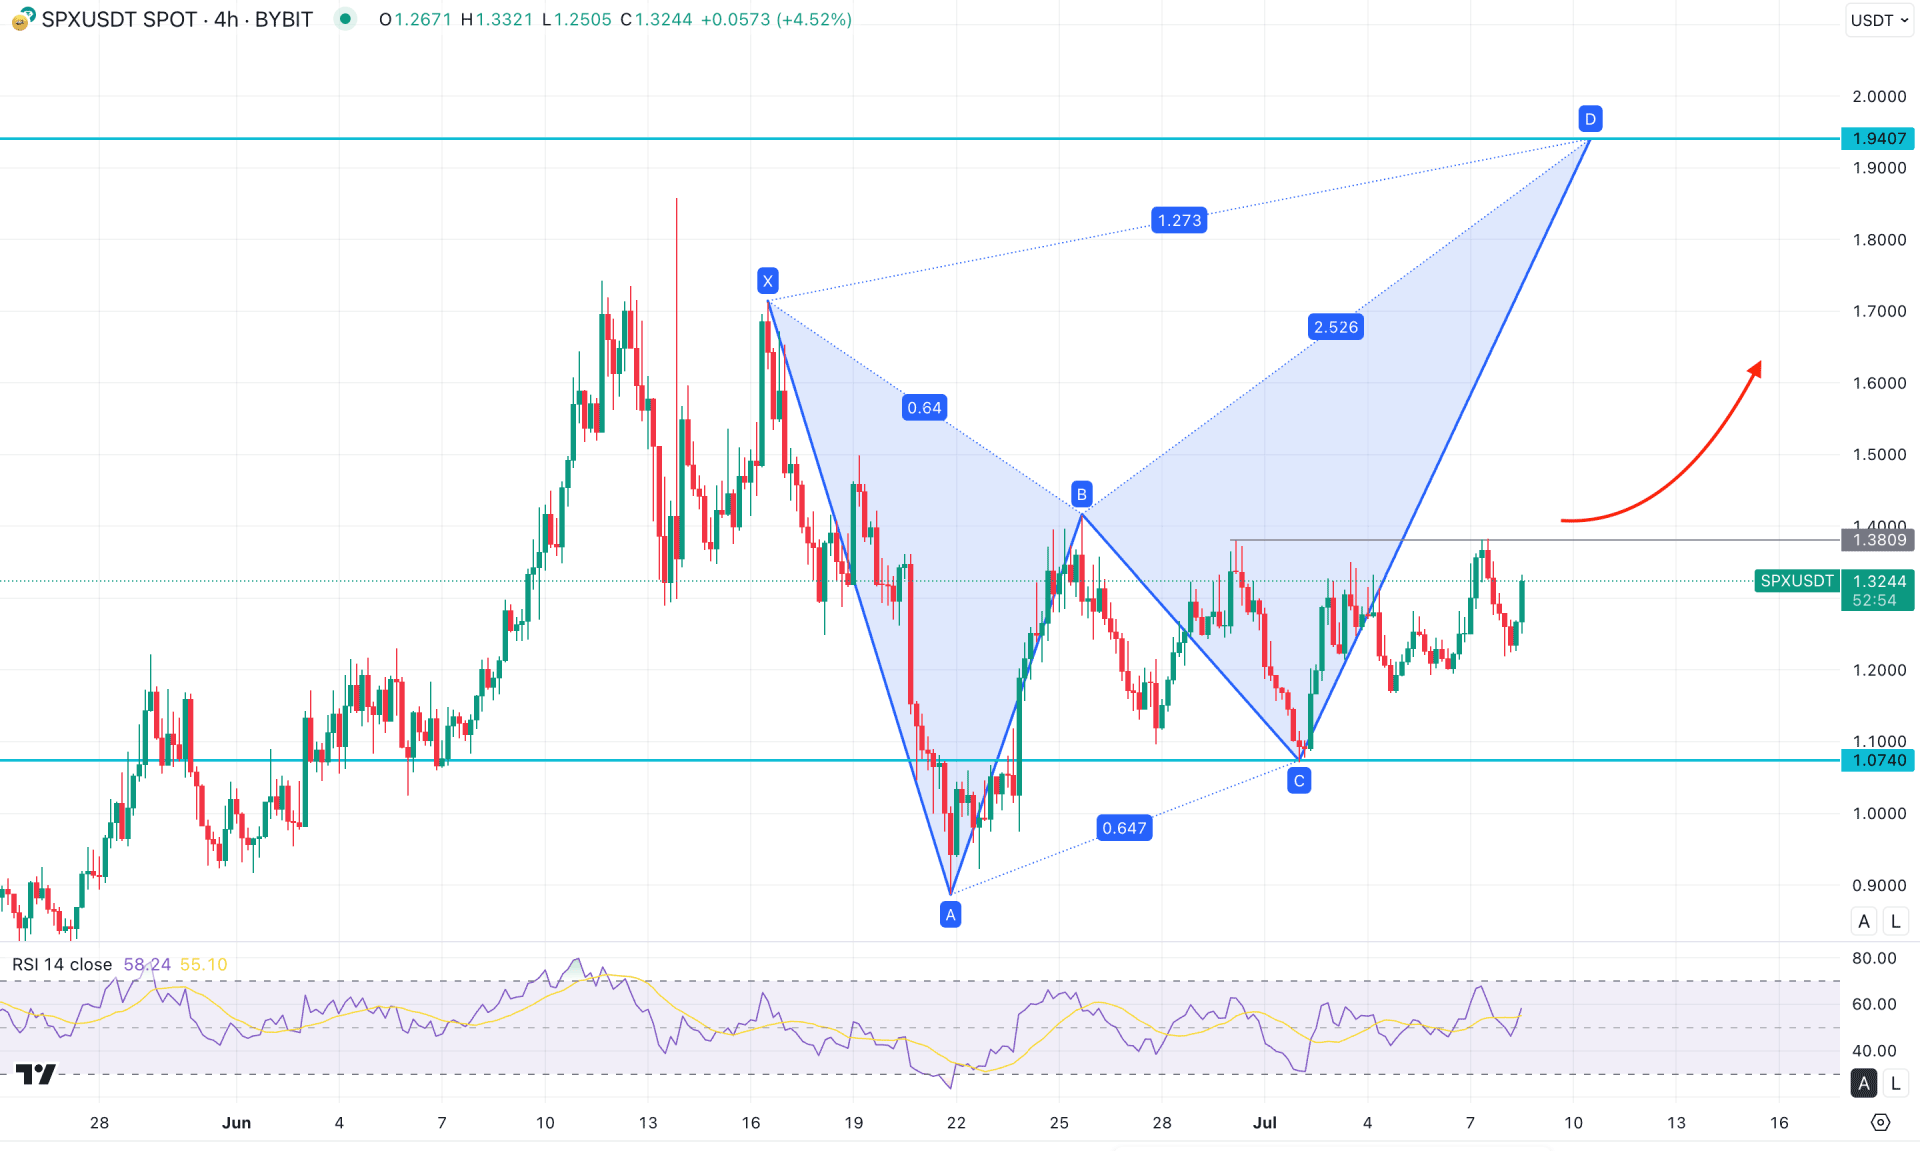
On the H4 timeframe, SPX/USDT is forming a strong bullish opportunity following a bearish harmonic pattern. In this setup, the recent structure indicates a possible upside swing extension as a continuation of the bullish trend.
Looking at the pattern, the bearish butterfly setup typically provides bullish signals when the price reaches the B point, as shown in the above market structure. The price formed a local high at the 1.7147 level, which marks the starting point of the pattern. Points A, B, and C are identified as follows: the price is currently trading sideways after forming a bottom at point C, located at the 1.0740 level. Point B is marked at the 61.8% Fibonacci retracement level of the XA leg. Similarly, point C is marked at the 61.8% Fibonacci extension level of the AB leg. Based on this pattern, the price may extend higher to reach point D, which aligns with the 1.273 Fibonacci extension level.
Following the near-term price action, market momentum is sideways, but a higher bullish reversal is anticipated above the 1.3809 level. A strong bullish engulfing candle above the 1.4000 level could validate a long opportunity, with a potential target at the 1.9000 area.
On the other hand, the Relative Strength Index (RSI) has flipped and rebounded above the 50.00 neutral zone, supporting the bullish scenario.
On the bearish side, ongoing trendline liquidity may attract some selling interest. In that case, a temporary price drop below the 1.1941 level, followed by an immediate bullish rebound, could strengthen the butterfly pattern extension. However, if extended bearish pressure pushes the price below the 1.1000 level, a deeper correction toward the 0.9000 area may occur.
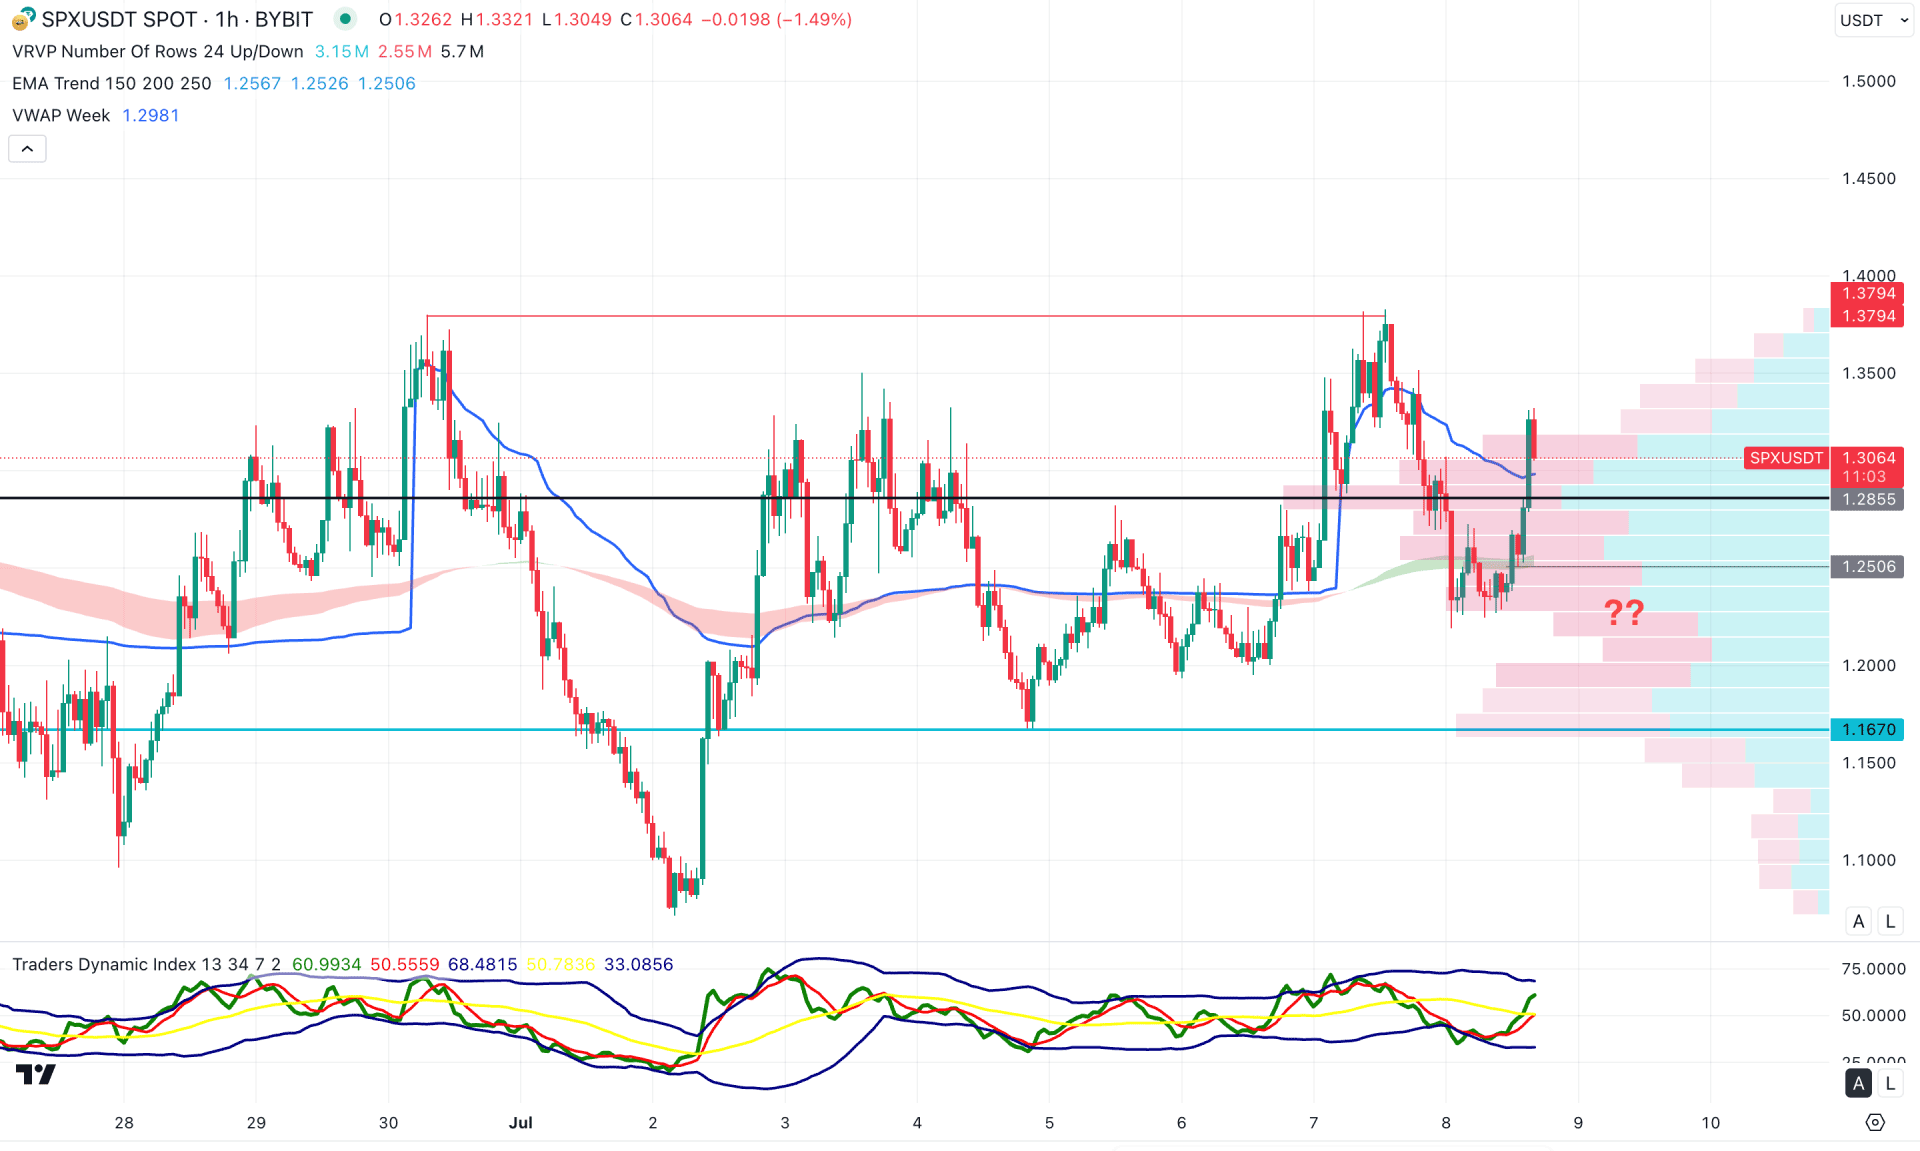
In the hourly timeframe, the most recent price is trading above the Exponential Moving Average , which is seen as a major bullish trend formation. The intraday high line is also below the current price, and a strong hourly candle close above it could act as confirmation of buying pressure. As the latest hourly candle has closed above the weekly VWAP level, investors should closely monitor how well the price holds above this level before considering a long position.
In the secondary indicator window, a bullish rebound is visible on the Traders Dynamic Index (TDI), with the current TDI line hovering above the 50.00 neutral point.
Based on the hourly market structure, the price is currently trading under a potential double top formation near the 1.3797 level. If the price breaks down with an hourly close below the 1.2506 low, it could extend losses and find support around the 1.1670 area.
However, if the price fails to stay below that level and instead breaks above the 1.2855 resistance line, it could initiate bullish momentum, where a long opportunity may emerge if the price stabilizes above the 1.3797 level.
Based on the overall market structure, SPX/USDT is more likely to offer a decent long opportunity after confirming a bullish range breakout. Investors should monitor the intraday market as a valid dip could provide an early long opportunity.


