Published: June 25th, 2020
The S&P500 Index certainly was very volatile during the peak of the 2020 crisis which was between February - March. The rapid fall stared on February 20, when the price topped out at 3398. In just 22 trading days S&P500 dropped by 35.87% and tested low at 2179.
The uptrend continuation started on March 23 and on the June 8 price already reached 3233 high. This was 54 days of the uptrend, where S&P500 managed to recover 48.36%. Perhaps this is not the end of the uptrend and in this analysis, we will try to understand the long term price perspective.
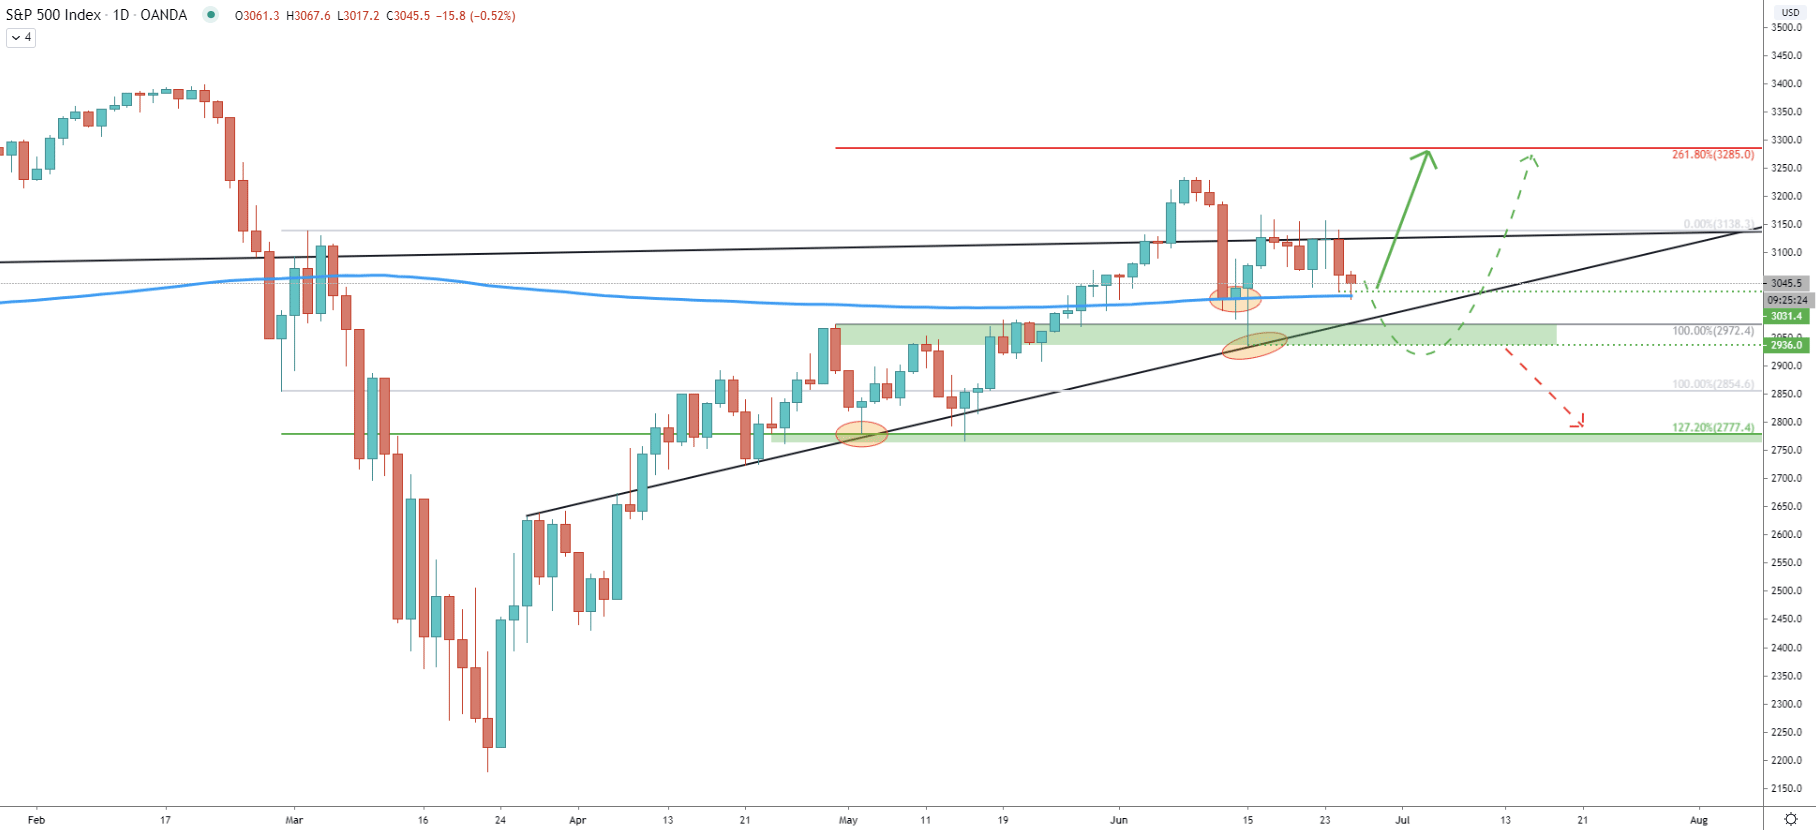
On the daily chart, the price is rising quite steadily. The support uptrend trendline has been rejected cleanly on June 15 and at the same time price rejected to 200 Exponential Moving Average. There were few attempts to break below the EMA and price produced spikes lower. But S&P500 failed to close the day below than the EMA, suggesting the validity of an uptrend.
We have applied the Fibonacci retracement level to the corrective wave up after price broke below the 200 EMA. It is clearly visible, that 127.2% Fibonacci retracement level at 2777 was rejected back on May 4. In order to find the potential upside target, we have applied yet another Fibs through the point where 127.2% retracement level was rejected. It shows, that at 3285 there is 261.8% Fibs which could be the nearest key resistance level for S&P500.
Currently, price is near the 200 EMA for the second time and it is possible that prior to moving up, it will produce yet another wave down. The key support is seen at 2936, where price spiked below the 200 EMA. If there will be a further correction to the downside, 3000 area is likely to be tested. In regards to the downside potential, only after the daily close below the 2936 level, the uptrend should be invalidated and price can be expected to correct further down, towards the 2777 support.
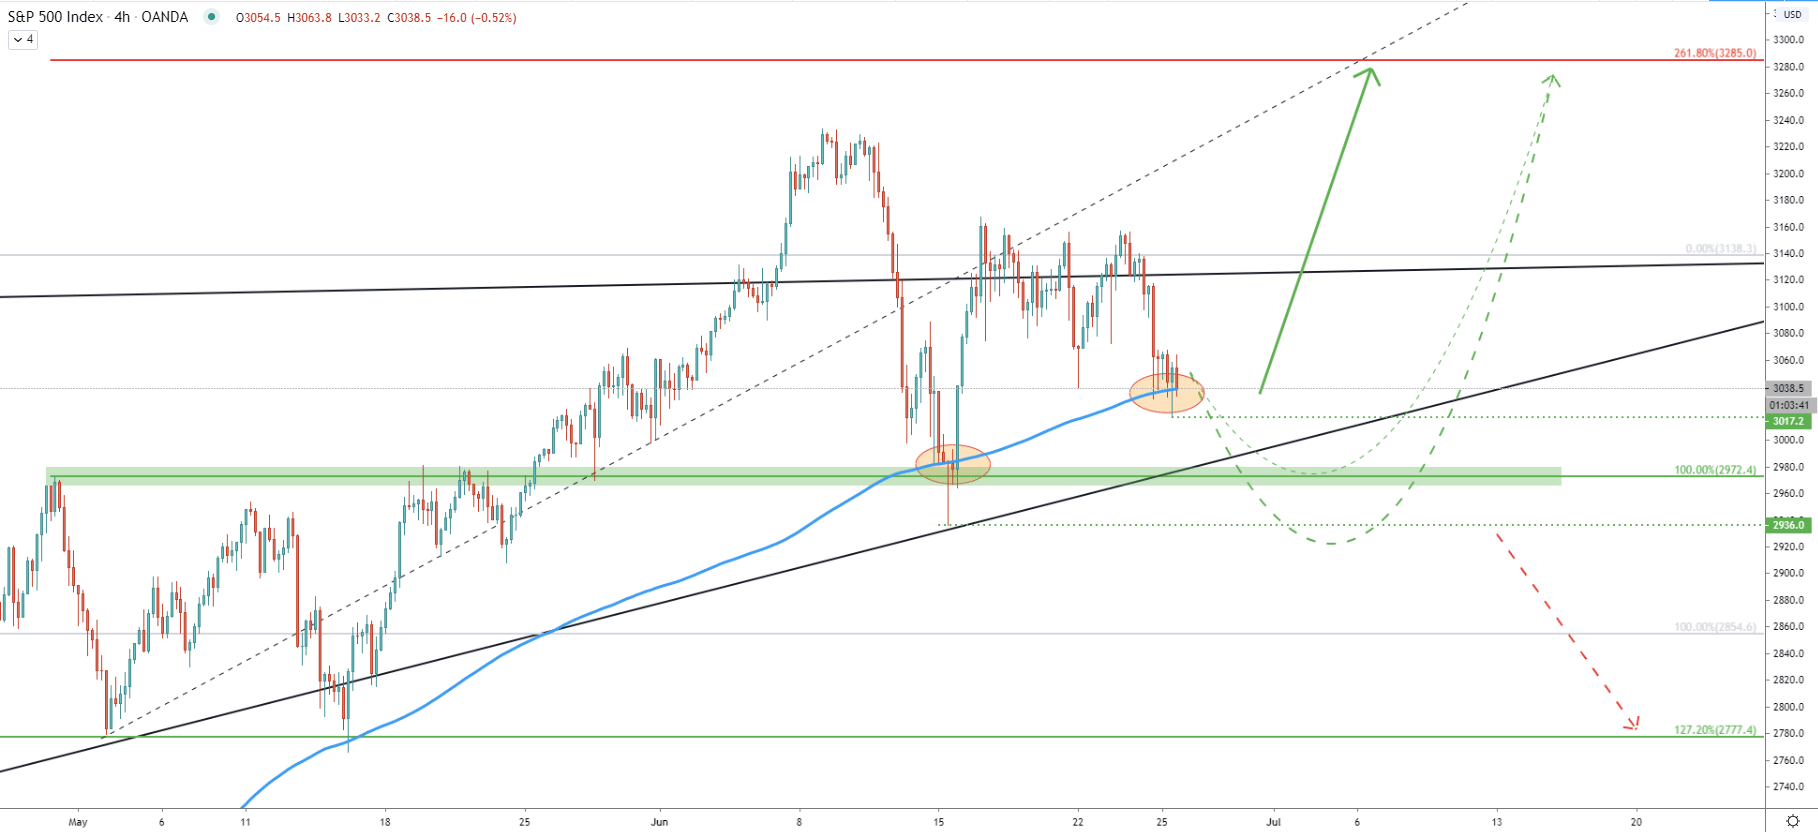
Similar to the Daily chart, on the 4-hour chart price also remains above the 200 Exponential Moving Average. The most recent bounce occurred just today, where price produced a low at 3017. If there will be 4h close below 3017, S&P500 might move down to the price area where EMA was rejected last time. This support area is located between 2972 and 2936 and could play a very important decision making role if/when reached.
There is also a potential for the spike below 2936 and it could be the perfect timing for bulls. Although they might need to make sure that 4h and/or daily closing price will remain above that level.
On this chart, we have also applied an average price uptrend trendline, which corresponds to the upside target at 3285. Based on the time when the trendline is crossing the resistance, we could say that there is a chance of reaching the target within just one week.
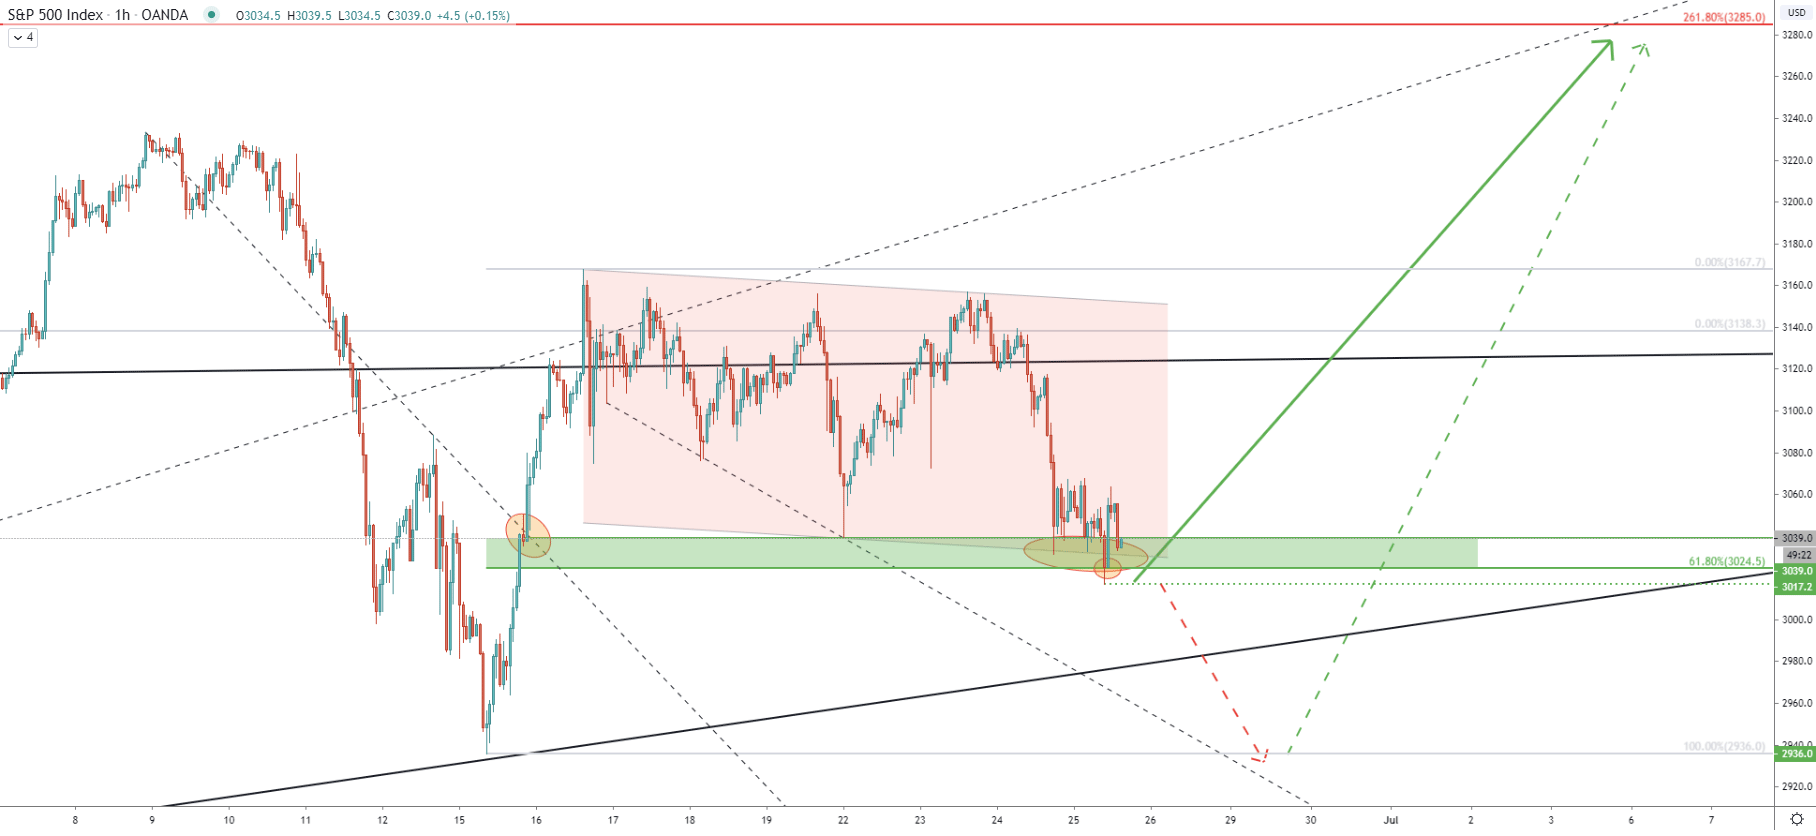
On the 1-hour chart, SP500/USD has reached the bottom of the descending channel. Moreover, it has reached and rejected the 61.8% Fibonacci retracement level at 3024. Price produced a spike slightly below the Fib support hitting 3017 low. Perhaps in the short term, this price should be watched, because if SP&500 remains above and then the price will be producing higher highs and higher lows, the bulls might start jumping on the S&P500 “northern” train.
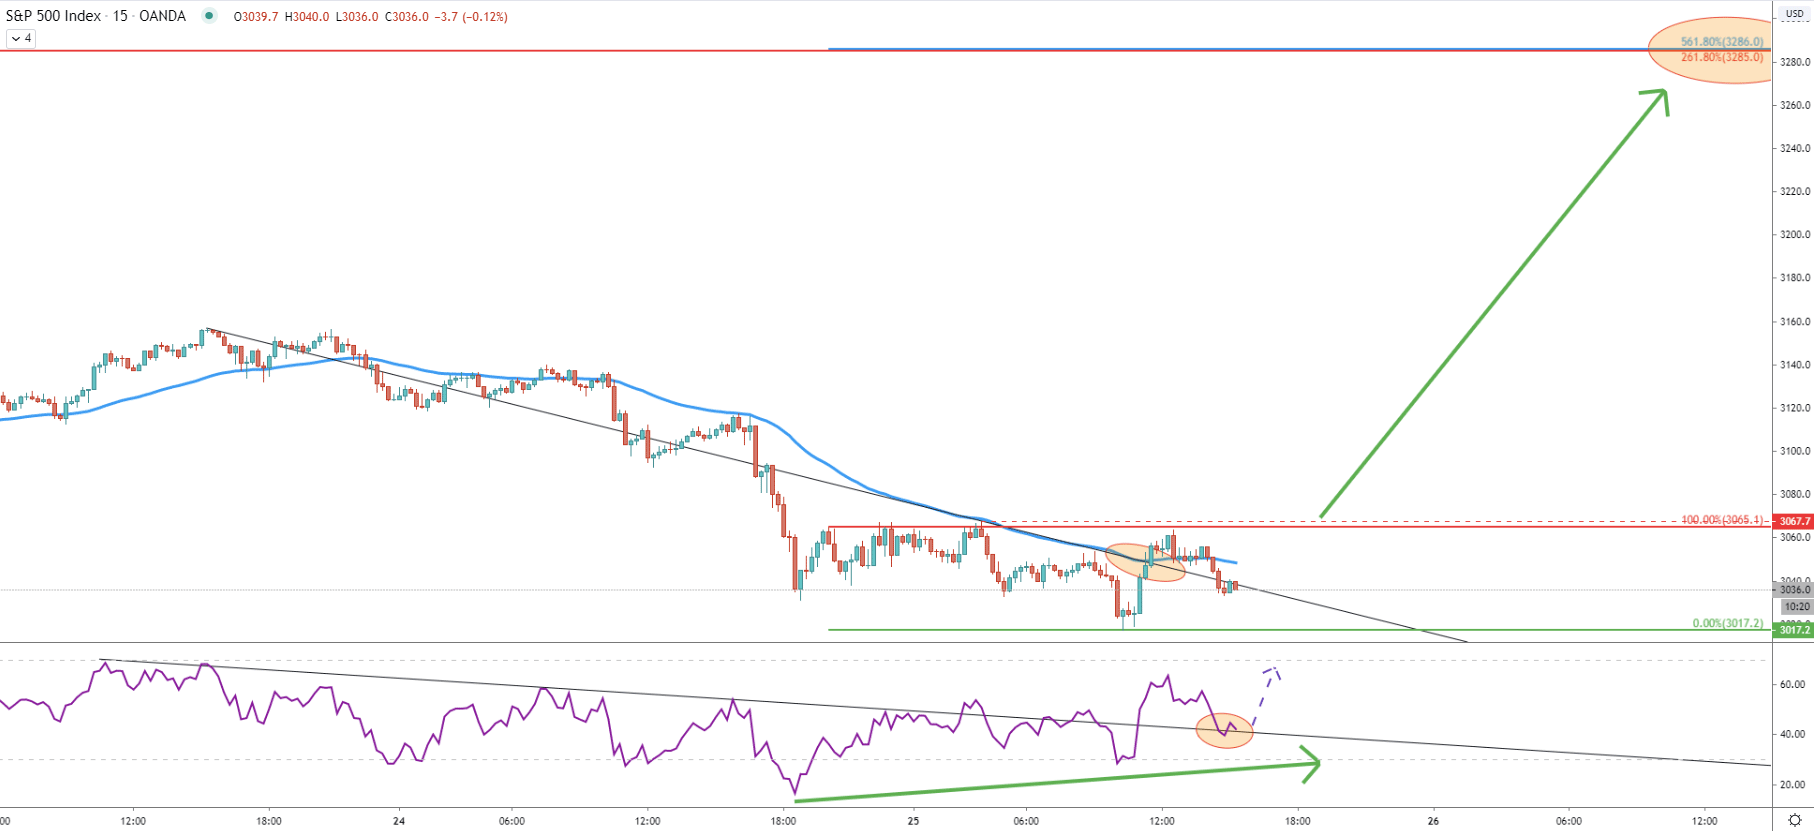
On the 15-minute chart, the key resistance seems to be located at 3065, where the price produced triple top and rejected the EMA. For the uptrend to begin, there must be a break above this level. We already see that S&P500 broke above the downtrend trendline and the EMA. At the same time, the RSI oscillator formed a bullish divergence, which could mean that the local bottom has been reached. RSI also broke above the downtrend trendline, which is currently acting as the support. Could it be the perfect buying opportunity? Soon we will find out.
The S&P500 long term trend remains bullish. The current correction down shows that 200 EMA was rejected on a Daily as well as 4h timeframe. This might be the confirmation that bulls are still in complete control and price could be heading up to produce yet another higher high.
The upside target is seen at 3285, which is 261.8% Fibonacci retracement as per the Daily chart. This level is also confirmed by 561.8% Fibs, applied to the most recent wave down and it will remain valid as long as 3017 is respected.
As per the hourly chart, the key support is seen at 3017, and if there will be hourly close below this price, S&P500 can drop further, to test the 2936 support area. But only daily break and close below that support will completely invalidate bullish outlook and S&P500 long term downside correction is likely to continue.
Support: 3017, 2936,
Resistance: 3065, 3285


