

Published: October 20th, 2026
SpaceX is set to report its third-quarter earnings this week, and analysts expect earnings per share (EPS) to reach $0.13. It could signal a recovery from the $0.09-per-share loss recorded in Q2. Revenue is forecast to climb to $13 billion, compared with $7.8 billion in the previous quarter.
SpaceX's AI ventures and its computing-power rental business are driving the anticipated growth. While these operations offer significant revenue potential, their substantial operating costs could weigh on profitability. Investors will be looking for signs of how these investments are shaping the company's overall financial performance.
Segment-wise revenue will be another major focus as SpaceX works to broaden its business portfolio. Connectivity, the largest contributor in Q2, generated $4.29 billion. Also, Q3 revenue is projected to reach $4.92 billion. AI revenue could surge from $2.56 billion to $6.47 billion, while the space segment is forecast to grow from $962 million to $1.46 billion.
SpaceX reported a $47.5 billion order backlog at the end of Q2. New agreements secured across commercial and government sectors may further strengthen its backlog.
Let's look at the further aspects of this stock from the SPCX technical analysis:
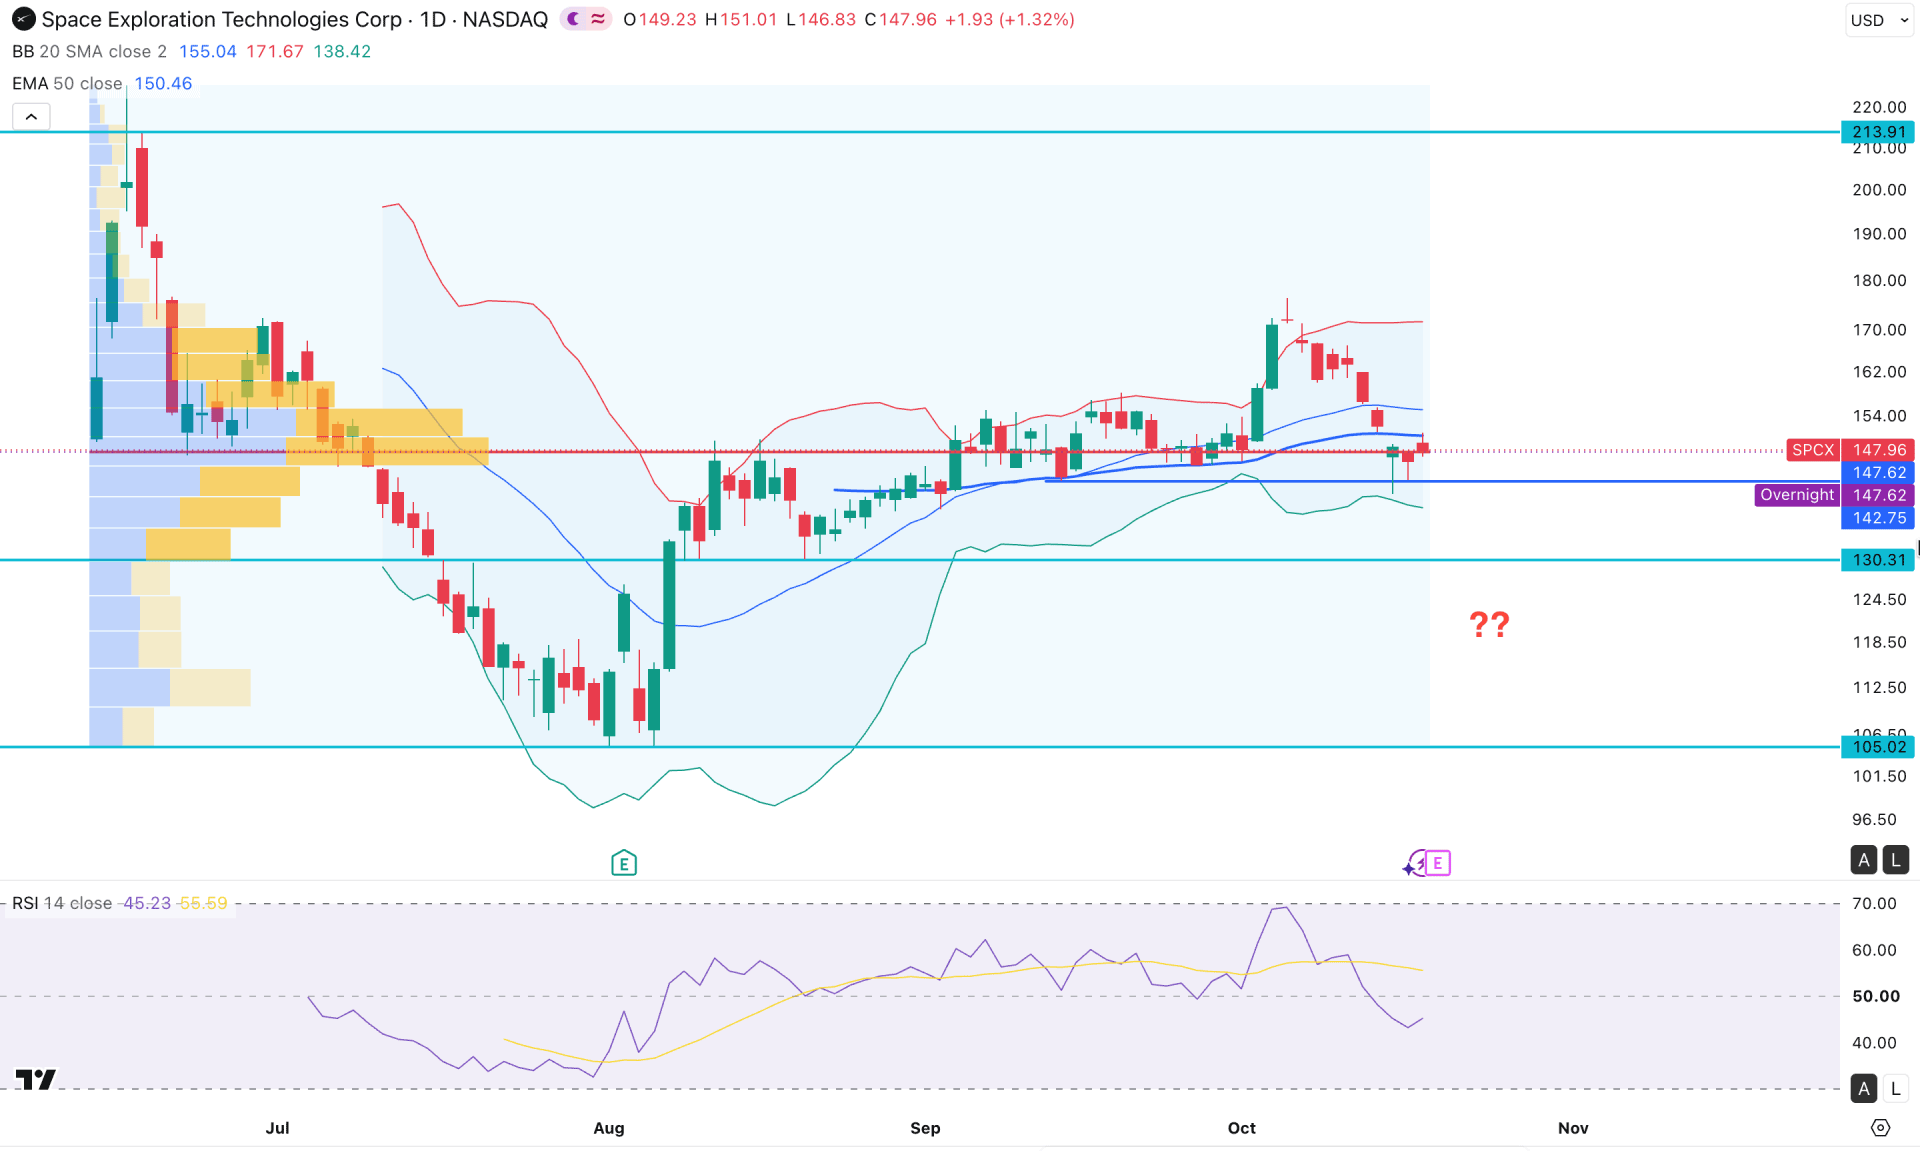
On the daily chart, SpaceX stock shows a bullish recovery from the 105.02 bottom since inception. The price formed a sideways momentum with a valid bullish breakout before retesting the static support at the 147.62 level.
The higher timeframe price structure is solid, as the monthly candle suggests a bullish side market, and the most recent candle is trading as an outside bar. The weekly timeframe represents a barrier to buying pressure, as recent selling pressure and a buy-side liquidity sweep at the 172.40 swing high signal active momentum.
On volume, price is trading in a congestion area, with the most active level since the start of trading at 147.62, just below the current price. Moreover, multiple violations in the high area show strong momentum signals and an order-building phase.
On the daily candlestick chart, price tested the 142.75 key support and rejected it with a minor sell-side liquidity sweep. Still, the price is trading below the Mid-Bollinger Band line, while the 50-day exponential moving average is acting as immediate resistance.
In the indicator window, the Relative Strength Index is in sellers territory. The current line is moving between 50.00 and 30.00, signaling moderate selling pressure. As the 30.00 line has not been reached yet, any recovery above the 50.00 level could signal a bullish confirmation in the main price chart.
Based on the overall market structure, a recovery above the Mid-Bollinger line could be a bullish signal for this stock and could take price beyond the 172.40 resistance level.
On the other hand, the price is still under selling pressure even if the 142.75 support level holds. In that case, a failure to overcome the 50-day exponential moving average could create pressure on buyers. In that case, a breakdown below the 142.75 level could increase the possibility of testing the 130.31 level before moving below the 114.83 flip zone.
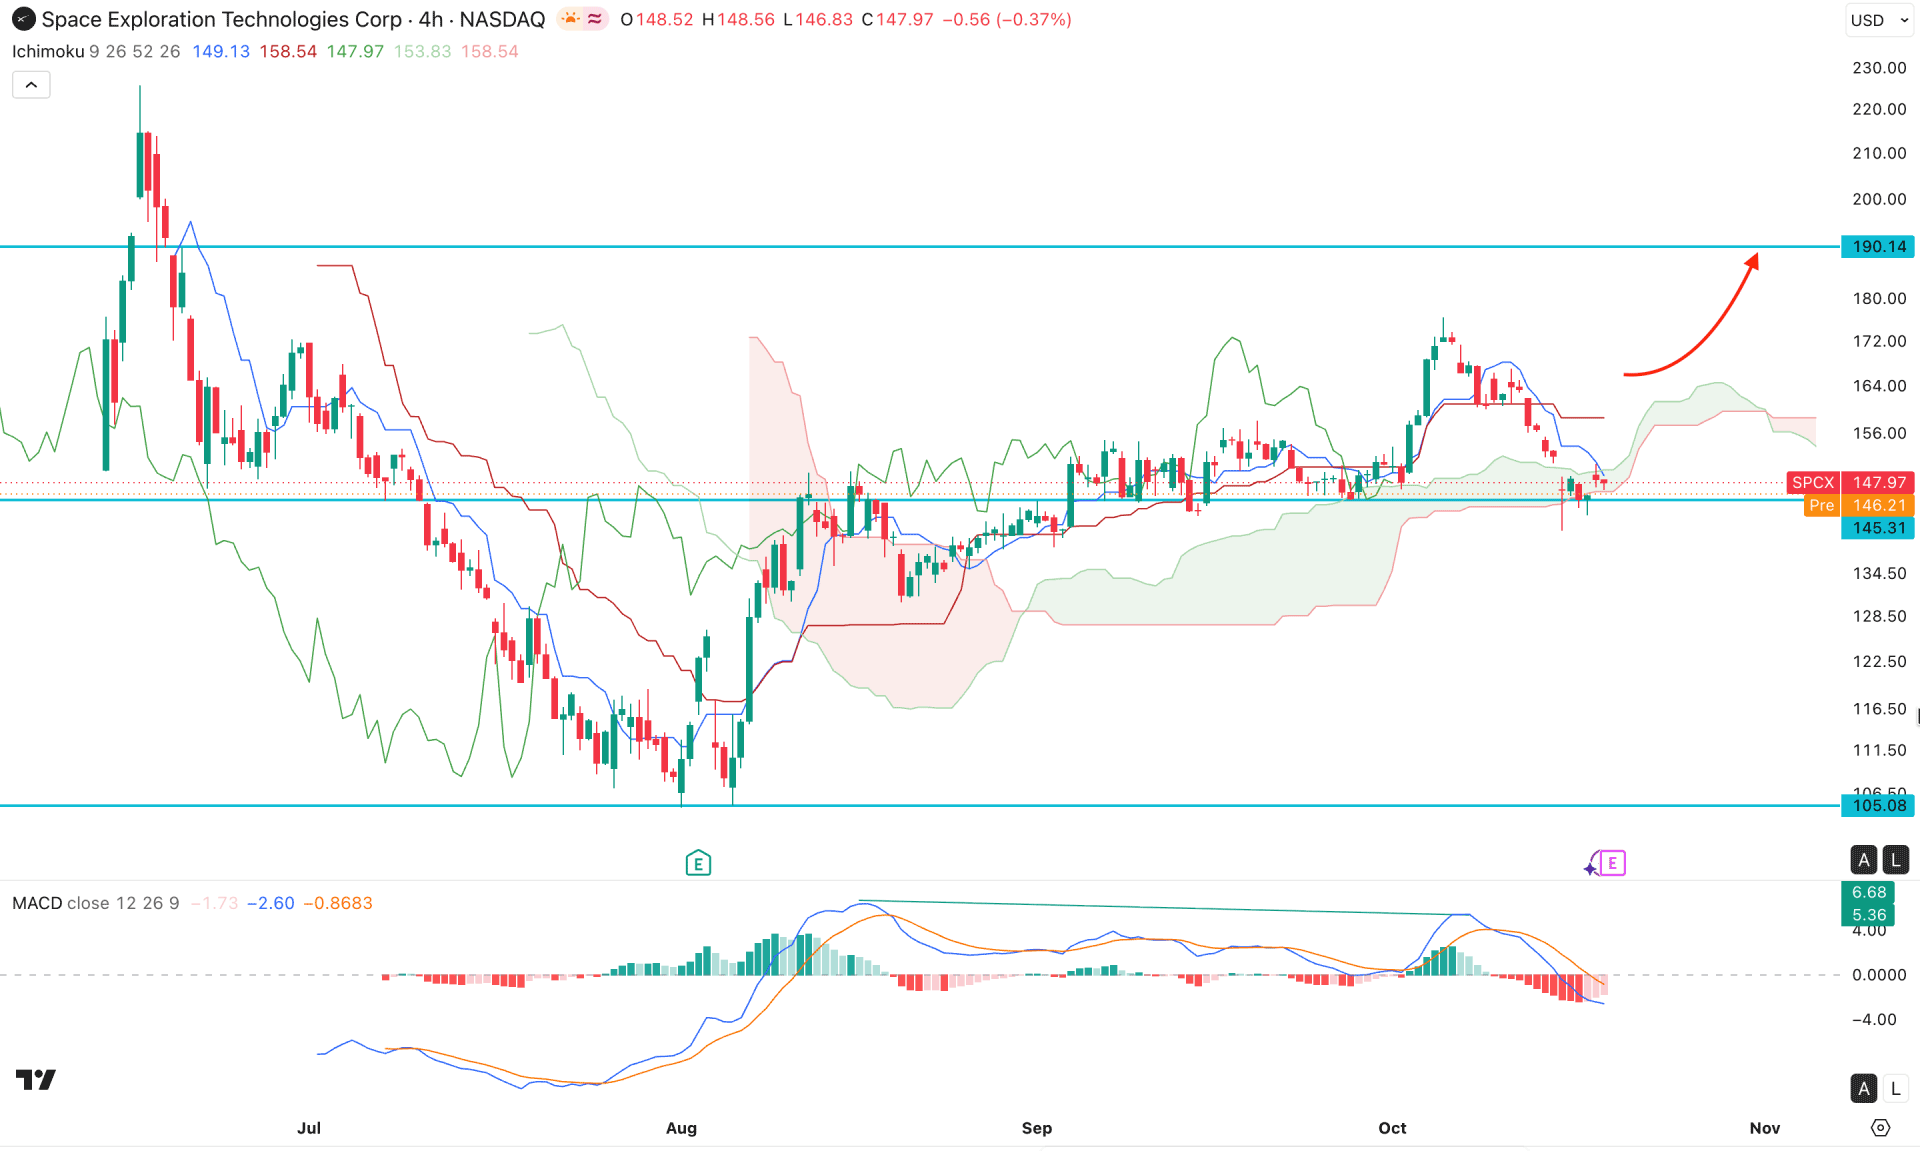
On the four-hour timeframe, SpaceX stock is trading with sideways bullish momentum, while the most recent price faces crucial support in the cloud area. However, the future cloud has flipped position, with the Senkou Span A heading below Span B, signaling a possible bearish continuation.
The dynamic lines are above the current price with a bearish crossover, where the price is still trading within a crucial support level at the 145.31 line.
In the indicator window, the MACD signal line shows a divergence where a new price swing created a new swing high that the signal line failed to follow. A bearish crossover is visible in the signal line, where the histogram remains below the neutral level for a considerable time.
Based on the four-hour market structure, investors should closely monitor how price reacts as it tests critical support at 145.31. Primarily, consolidation in this area with a new swing low could increase the chance of extending downside pressure toward 105.08.
The alternative trading approach is to wait for a bullish recovery above the dynamic Tenkan and Kijun levels with a valid bullish H4 close. In that case, a sell-side liquidity sweep at the 145.31 level would be validated, with the possibility of moving beyond the 190.14 key resistance level.
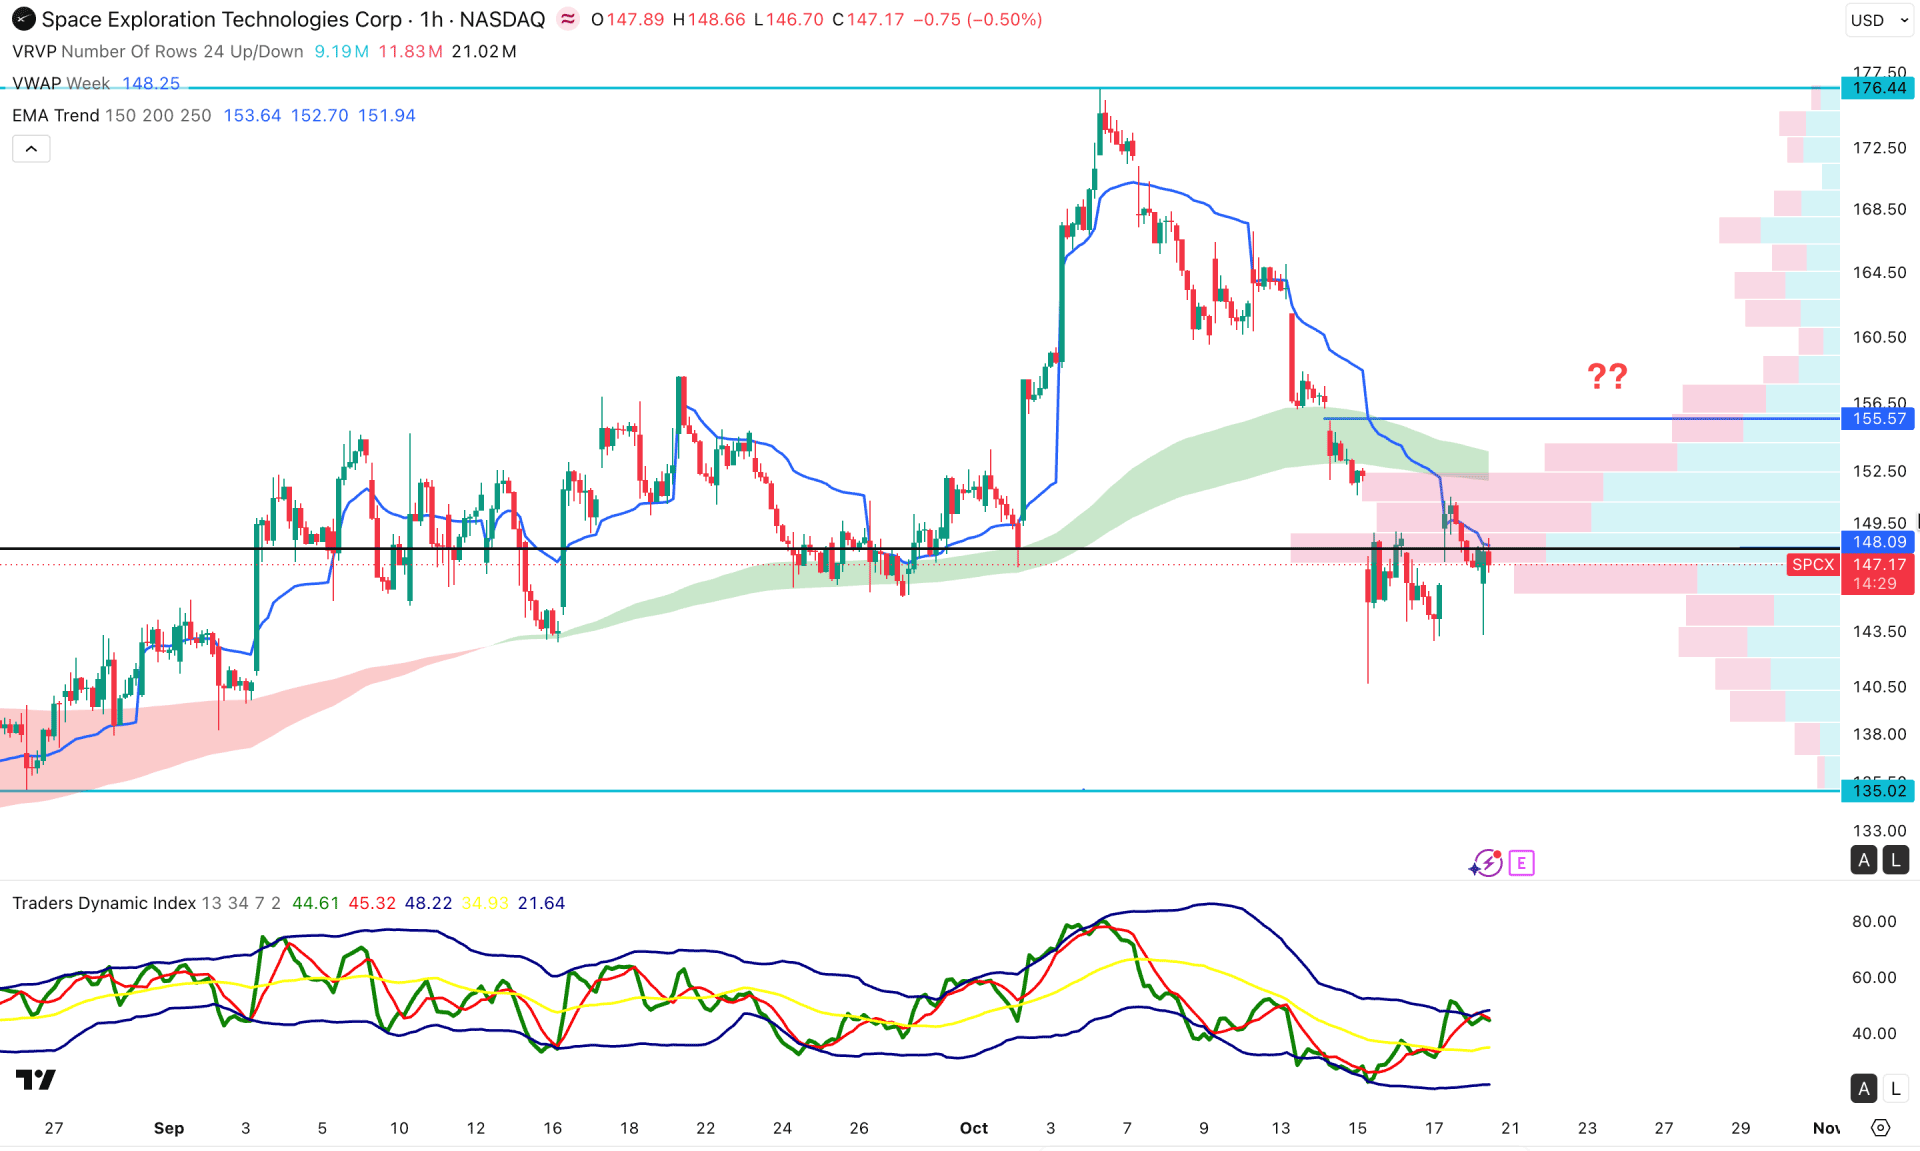
In the hourly timeframe, the ongoing market momentum is volatile at the intraday low, suggesting indecision. Moreover, market momentum is bearish, with a valid buy-side liquidity sweep. Primarily, the price is trading below crucial dynamic lines and is likely to extend the bearish pressure at any time.
In the secondary indicator window, the Traders Dynamic Index has rebounded its position and reached the bullish peak area. However, the rise has shortened as the current line is near the 50.00 neutral level.
Based on the overall market structure, a bearish continuation is possible as long as the price remains below the EMA wave resistance area. On the bearish side, the immediate support level to watch is 135.02.
On the other hand, a bullish rebound with stable price action above 155.57 could signal a reversal, creating a chance to test the 176.44 resistance level.
Based on the overall market structure, earnings projections are the key driver for this stock, and a better-than-expected result could attract bullish investor attention. Price action is sideways, with momentum supported by a bullish continuation structure. In that case, a valid bullish range breakout with a recovery above the daily dynamic line could be a potential long opportunity.


