
Published: March 12th, 2026
As oil prices rose again, US stock futures plunged, raising worries about a potential return to inflation.
The possibility of a protracted confrontation with Iran eclipsed an organized release of oil stockpiles by major nations, and WTI crude rose back above $90 per barrel.
Regardless of the IEA's commitment to its biggest-ever shipment of 400 million barrels of petroleum, markets still saw the urgent oil release as insufficient.
As the Iranian conflict rages on, Wall Street may be focused on the spike in crude oil prices, but other commodities have surged even more.
The S&P 500's SPX top stock for March is CF Industries Holdings (CF), whose shares have increased by 20.7% this month. A well-known analyst claims that the Middle East sells between 35 and 40 percent of all urea fertilizer, exceeding the region's share of global oil exports.
Can the S&P 500 hold the gain at the record high price? Let's see the complete outlook from the SPX price analysis:
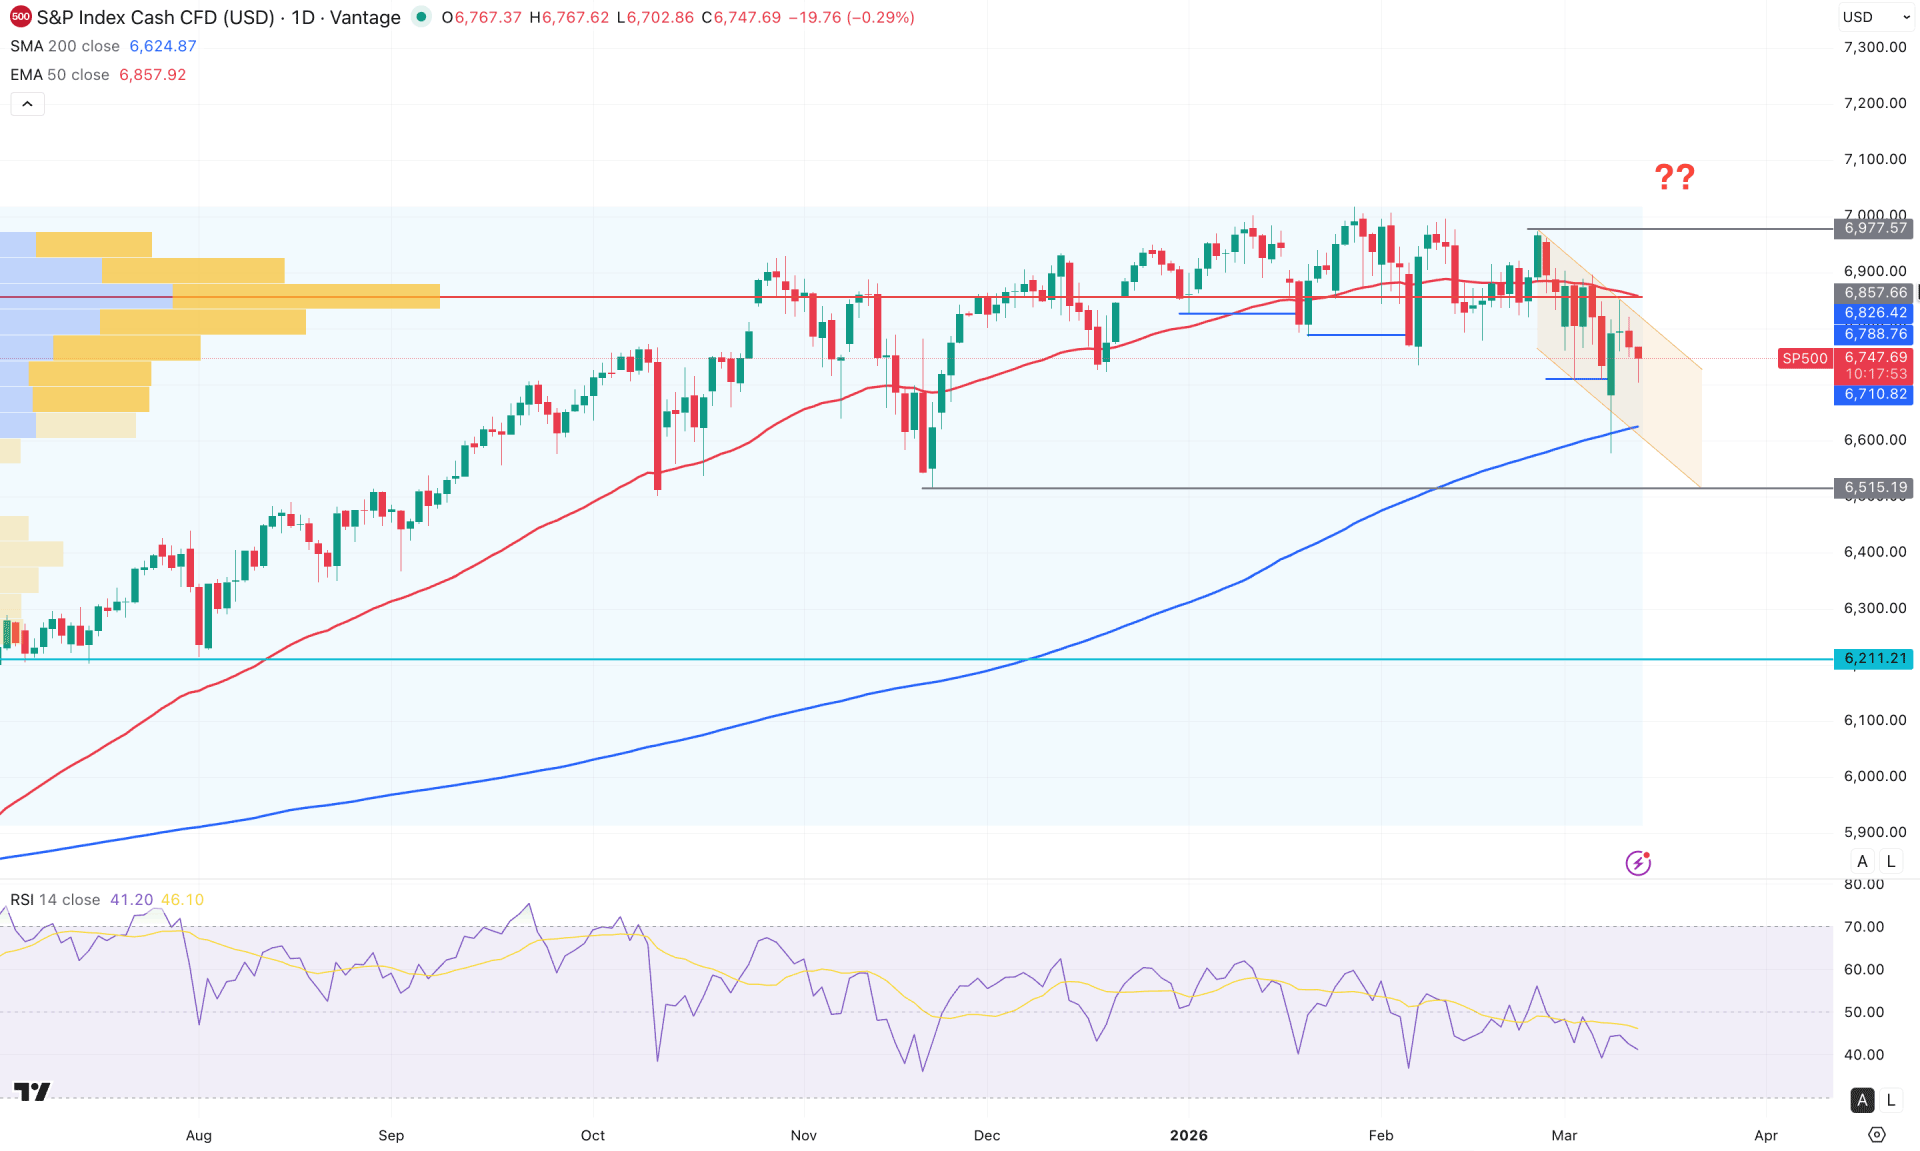
In the daily chart of the S&P 500 (SPX), extended volatility is evident as the price trades near a record high. Since the beginning of 2026, no significant buying pressure has been observed, and the market has mostly moved sideways. The formation of three consecutive swing lows could signal a bearish trend.
Looking at the higher timeframe, the price is trading sideways, with multiple doji candlesticks forming, including a bearish reversal candlestick. As the momentum slows, a minor downward correction is possible, but it is still too early to confirm a bearish trend reversal. The weekly price action shows an early sign of opportunity, as the price is trading within a discounted zone after a range breakout.
In terms of volume, selling pressure is notable, as a new high-volume level has formed at the top of the range. Primarily, this could signal an order-building phase, from which significant selling pressure may emerge if the price fails to overcome the recent high.
In the main price chart, the 200-day Simple Moving Average was tested this week, followed by a strong bullish reversal candlestick that failed to sustain buying pressure. As a result, the price found resistance at the 6857.66 high William line and continues to move within a descending channel.
Since the 50-day Exponential Moving Average is currently above the price and acting as resistance, the market may present a downside opportunity, supported by the RSI remaining below the 50.00 neutral level.
Based on this market outlook, the long-term momentum of the S&P 500 remains bullish, while a significant downside correction is still pending. As the price struggles to break above the channel resistance, immediate downside pressure could emerge, extending the range channel toward the 6515.19 support level. However, if the price holds above the 200-day SMA, it could remain a positive factor for the bulls.
A bullish channel breakout, confirmed by a strong close above the channel resistance, could resume the existing bullish momentum at any time. In that case, the ultimate target for this instrument would be a move toward the 7000.00 psychological resistance level.
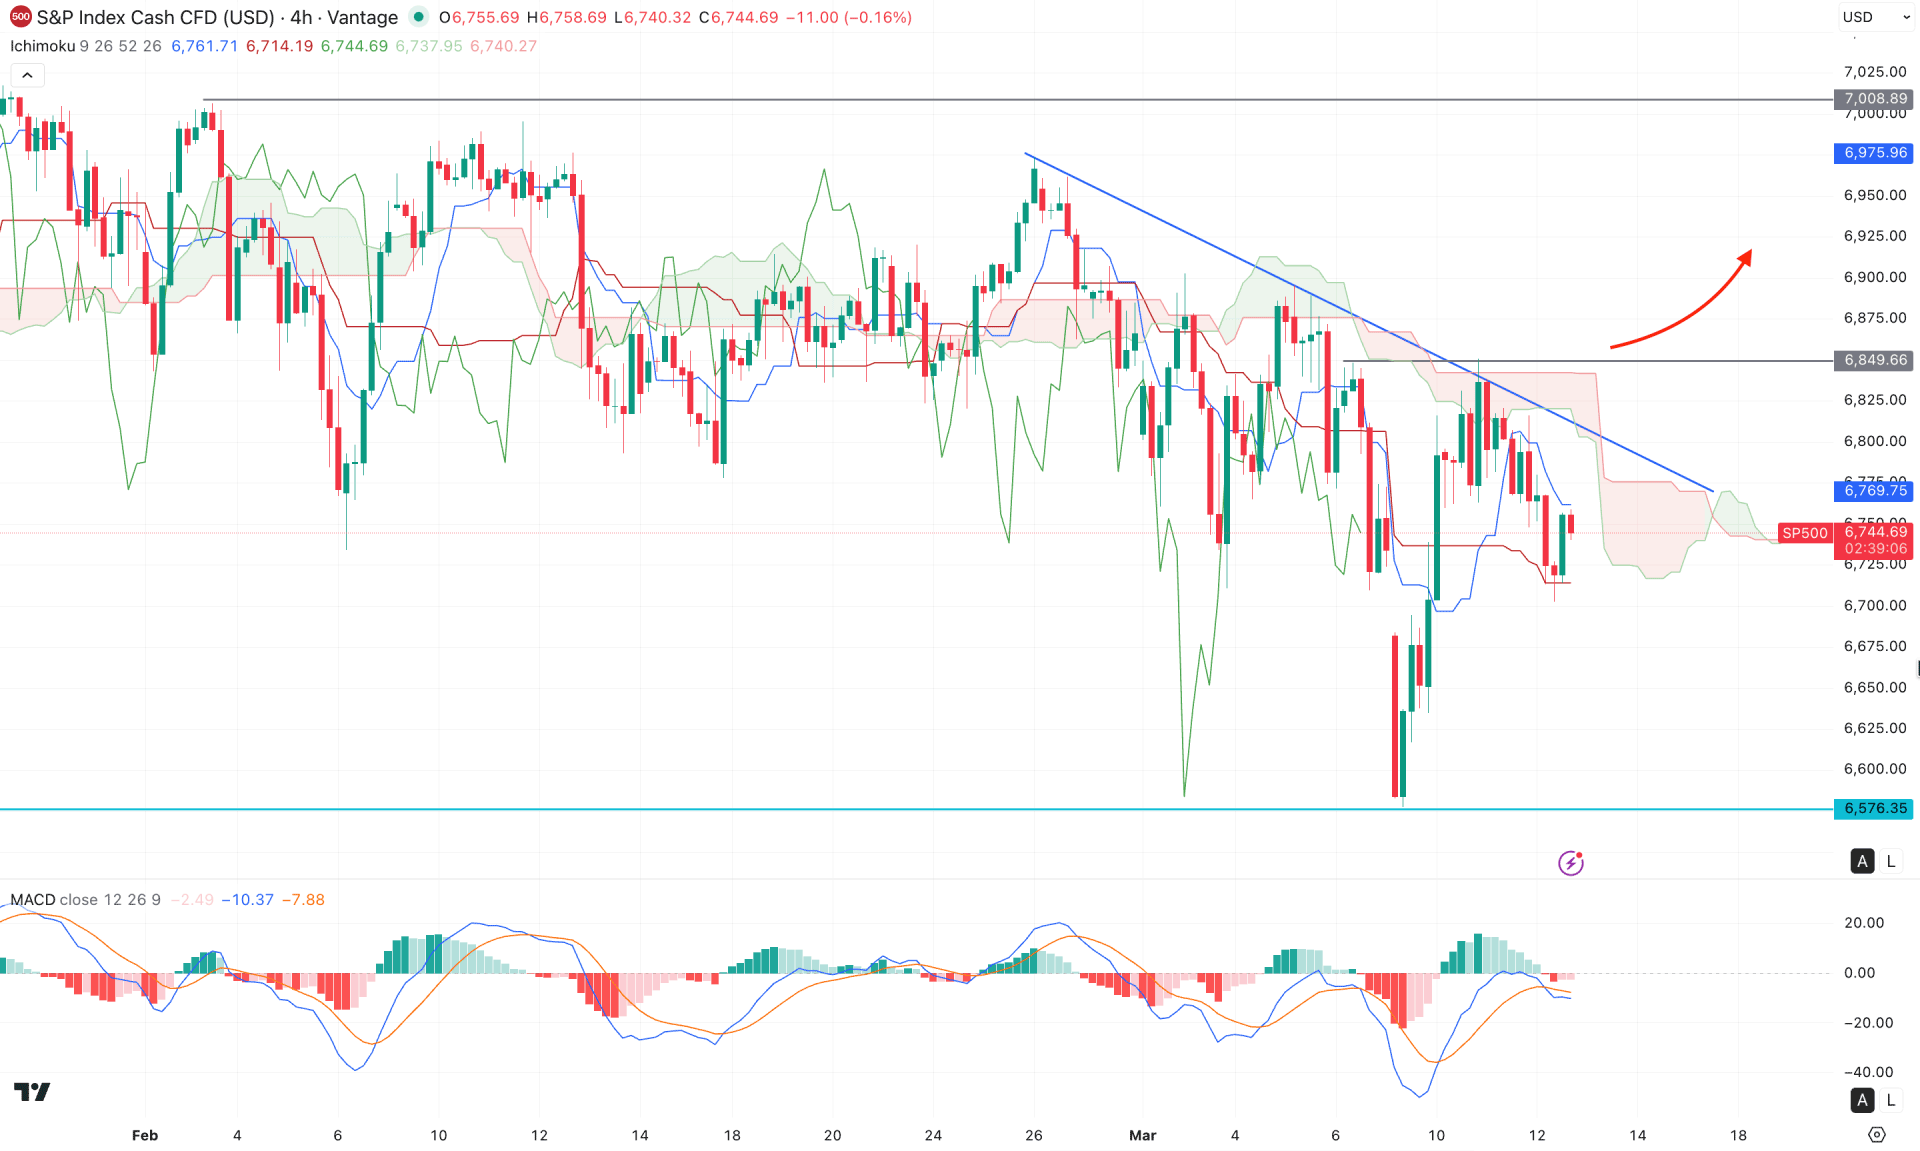
In the H4 timeframe, the price remains extremely volatile, with multiple violations around the Kumo cloud. In the most recent price action, the market moved lower before rebounding toward the cloud area. As a result, the future cloud has turned sideways, signaling no clear market trend.
In the secondary indicator window, the MACD histogram remains within the neutral zone, while the signal line is moving upward following a bullish crossover.
Based on this outlook, a potential trendline breakout, supported by a stable price above the 6849.66 resistance level, could validate a long opportunity. In that case, the price may extend its bullish momentum toward the 7000.00 psychological level.
On the other hand, the price is still trading below the Kumo area. A new bearish candle below the Kijun-sen support level could extend the downside pressure at any time. Moreover, a failure to break the trendline resistance, combined with buy-side liquidity sweeps, could also create a bearish opportunity, targeting the 6576.35 support level.
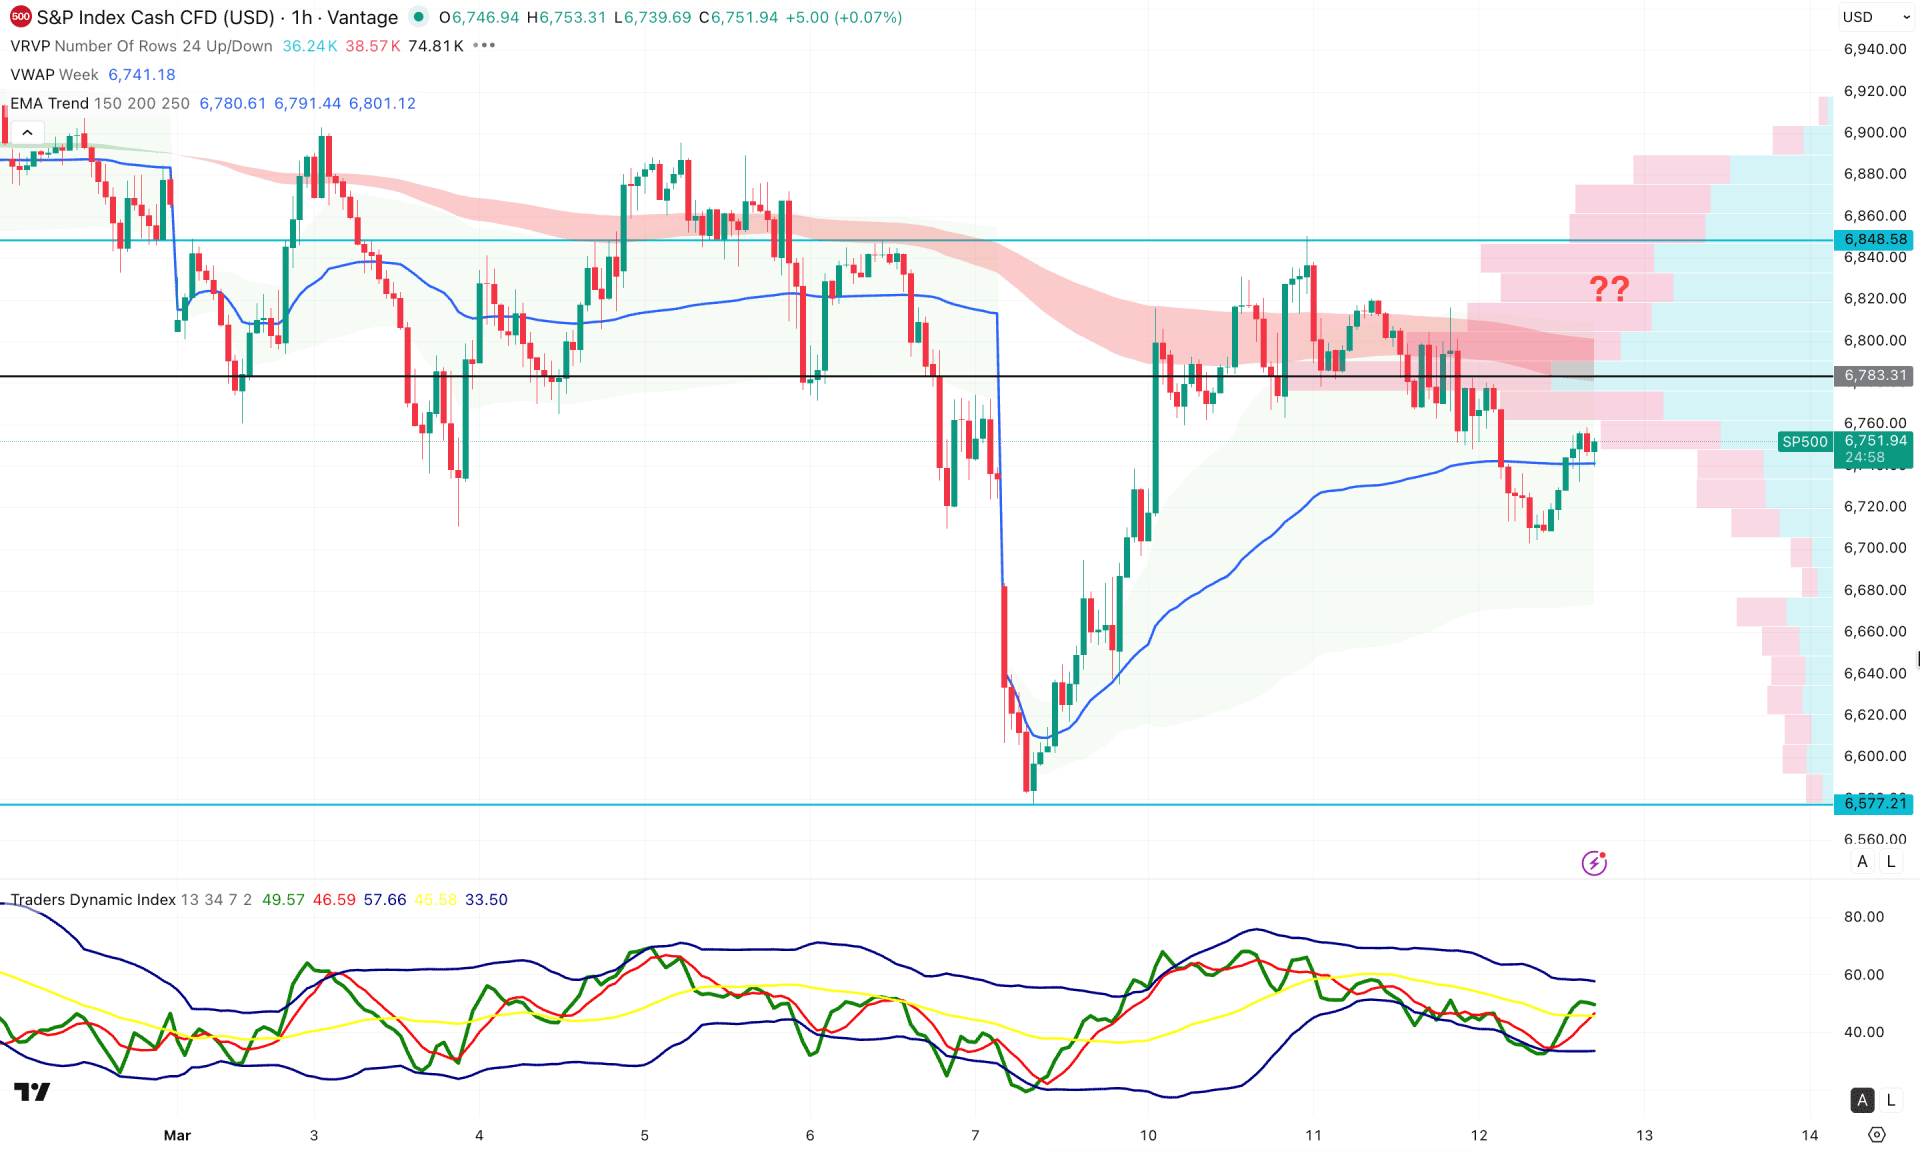
In the hourly timeframe, the price is trading bearish, as no significant buying pressure has been seen after testing the 6577.21 bottom. Instead, the price moved into the premium zone and formed a range breakout, which could signal a potential downside move.
On the other hand, a bullish rebound is evident above the weekly VWAP. However, the Exponential Moving Average (EMA) wave is acting as a strong resistance, aligning with the high-volume daily level.
The Traders Dynamic Index (TDI) is moving sideways, with the current line hovering below the 50.00 neutral level, indicating weak bullish momentum.
Based on the hourly market outlook, a minor corrective move could appear before the market resumes its downside continuation. A failure to break above the EMA wave could remain a challenging factor for the bulls. In that case, a four-hour candle close below the VWAP line could validate a short opportunity.
Alternatively, traders may consider a bullish scenario if the price breaks and consolidates above the 6848.58 resistance level before opening any long positions.
Based on the overall market structure, the S&P 500 remains volatile near its historic high, where a bearish range breakout could signal an extended corrective move. Investors should closely monitor how the price reacts at the descending channel resistance, as a failure to break above this level could confirm a continuation of the bearish move.


