

Published: June 23rd, 2026
On Thursday, US stocks rebounded from a dip, marking a resurgence. This year, the Federal Reserve hinted at a potential rate increase. The prior session's sell-off was triggered by that action.
Chip stocks rose as a result of Intel. It increased by 10.6%. According to President Donald Trump, Intel and Apple will collaborate on chip creation in the United States. The stockpiles of other semiconductors also increased. Nvidia increased by almost 3%.
The Wealth Alliance's CEO observes increased optimism when businesses collaborate. AI infrastructure and its effects on numerous businesses are the cause. Additionally, he believes that the Apple-Intel agreement serves as a stand-in for upcoming developments.
The "dot plot" created by the policymakers revealed a change. Interest rates will rise in 2026, according to nine out of eighteen Fed policymakers. The week that was truncated due to the holiday ended with stocks in positive territory. For the week, the S&P 500 increased by 0.9%. It had won 11 of the previous 12 weeks.
Let's see the full outlook from the SPX multi-timeframe analysis:
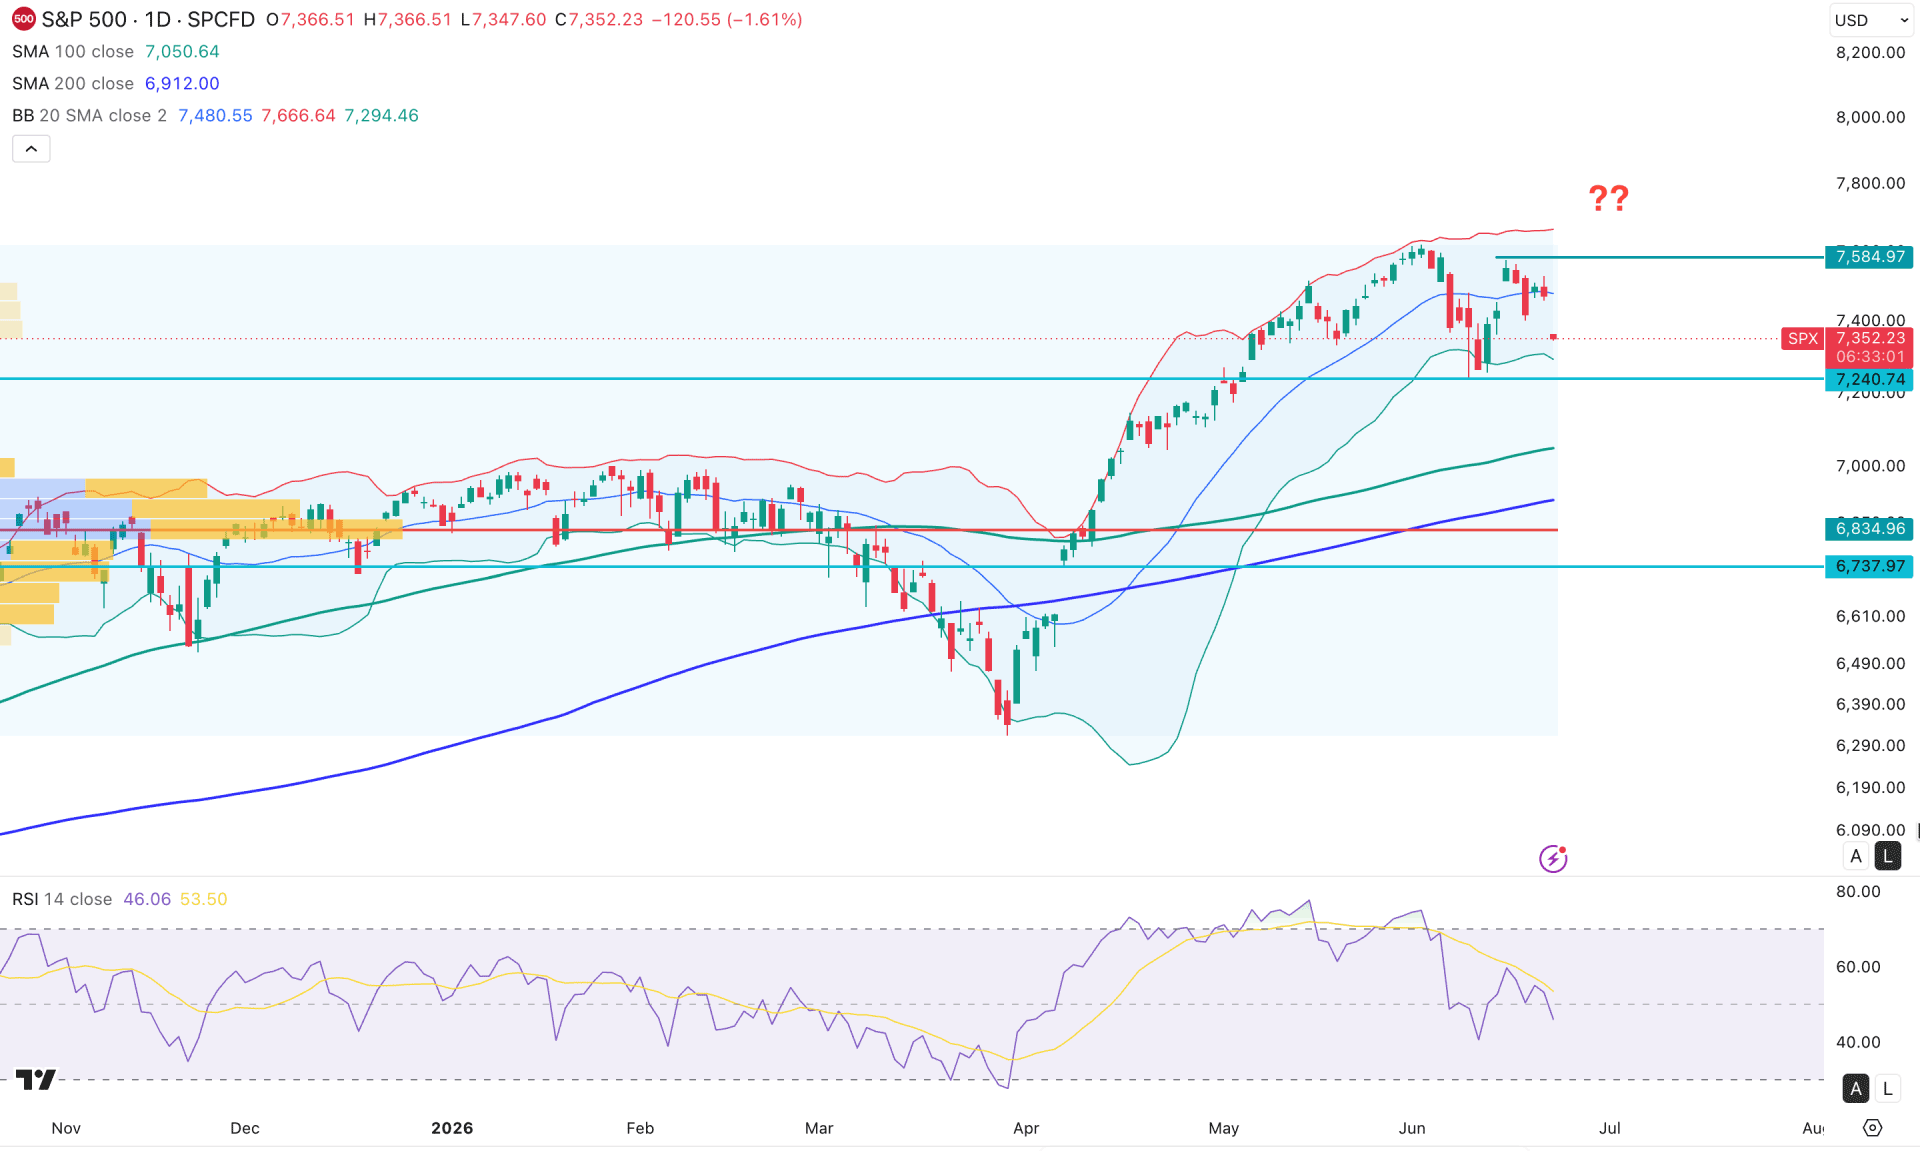
On the daily chart of SPX, intermarket momentum is bullish, with a strong rebound visible from the March 2025 low. Although no significant selling pressure is seen from the current premium zone, the extended volatility is signalling a potential market rebound. As long as the existing swing low is valid, the price is likely to follow the momentum and extend higher as a trend continuation.
Looking at the higher timeframe, the price is still trading within a steady bullish momentum, as the current bearish pressure came after two consecutive strong bullish months. Although a minor downside correction is visible, more confirmations are needed to validate a bearish trend reversal. The weekly timeframe shows a corrective market structure with multiple gravestone doji formations, which signal indecision.
In terms of volume, the price is trading within a bullish structure, but a considerable down correction is pending. The most active level since October 2025 is below the current price, with a strong gap. Primarily, a bullish rebound is highly possible, even if there is room to retrace lower as a correction.
In the main price chart, the price is facing a volatile market, as sideways momentum is visible after creating a new all-time high in May 2026. The price rebounded lower and created a bottom at the 7240.74 level, then aimed higher with no significant higher high formation. In this context, the current bearish pressure below the mid Bollinger Band line signals corrective market momentum, which needs proper validation before following a bullish rebound.
The 200-day SMA and 100-day SMA are below the current price with a bullish slope from the high-volume support level at 6834.96. It is a sign of a strong bullish trend formation, as the gap between the current price and the dynamic lines is considerable.
On the other hand, the Relative Strength Index (RSI) is showing a different story, where a rebound is visible with divergence. Currently, the RSI is below the 50.00 neutral point with a downward slope.
Based on the overall market structure, investors should closely monitor how the price trades in the current price area, as the lower Bollinger Band line is the immediate support. A failure to hold bullish momentum at the 7240.74 support level could increase the possibility of testing the 6834.96 support level. Moreover, a break below this line could open room for moving below the 6600.00 area.
On the other hand, a strong liquidity grab from the 7240.74 level with a recovery above the mid Bollinger Band line could be a strong bullish signal, which could take the price beyond the 8000.00 psychological level.
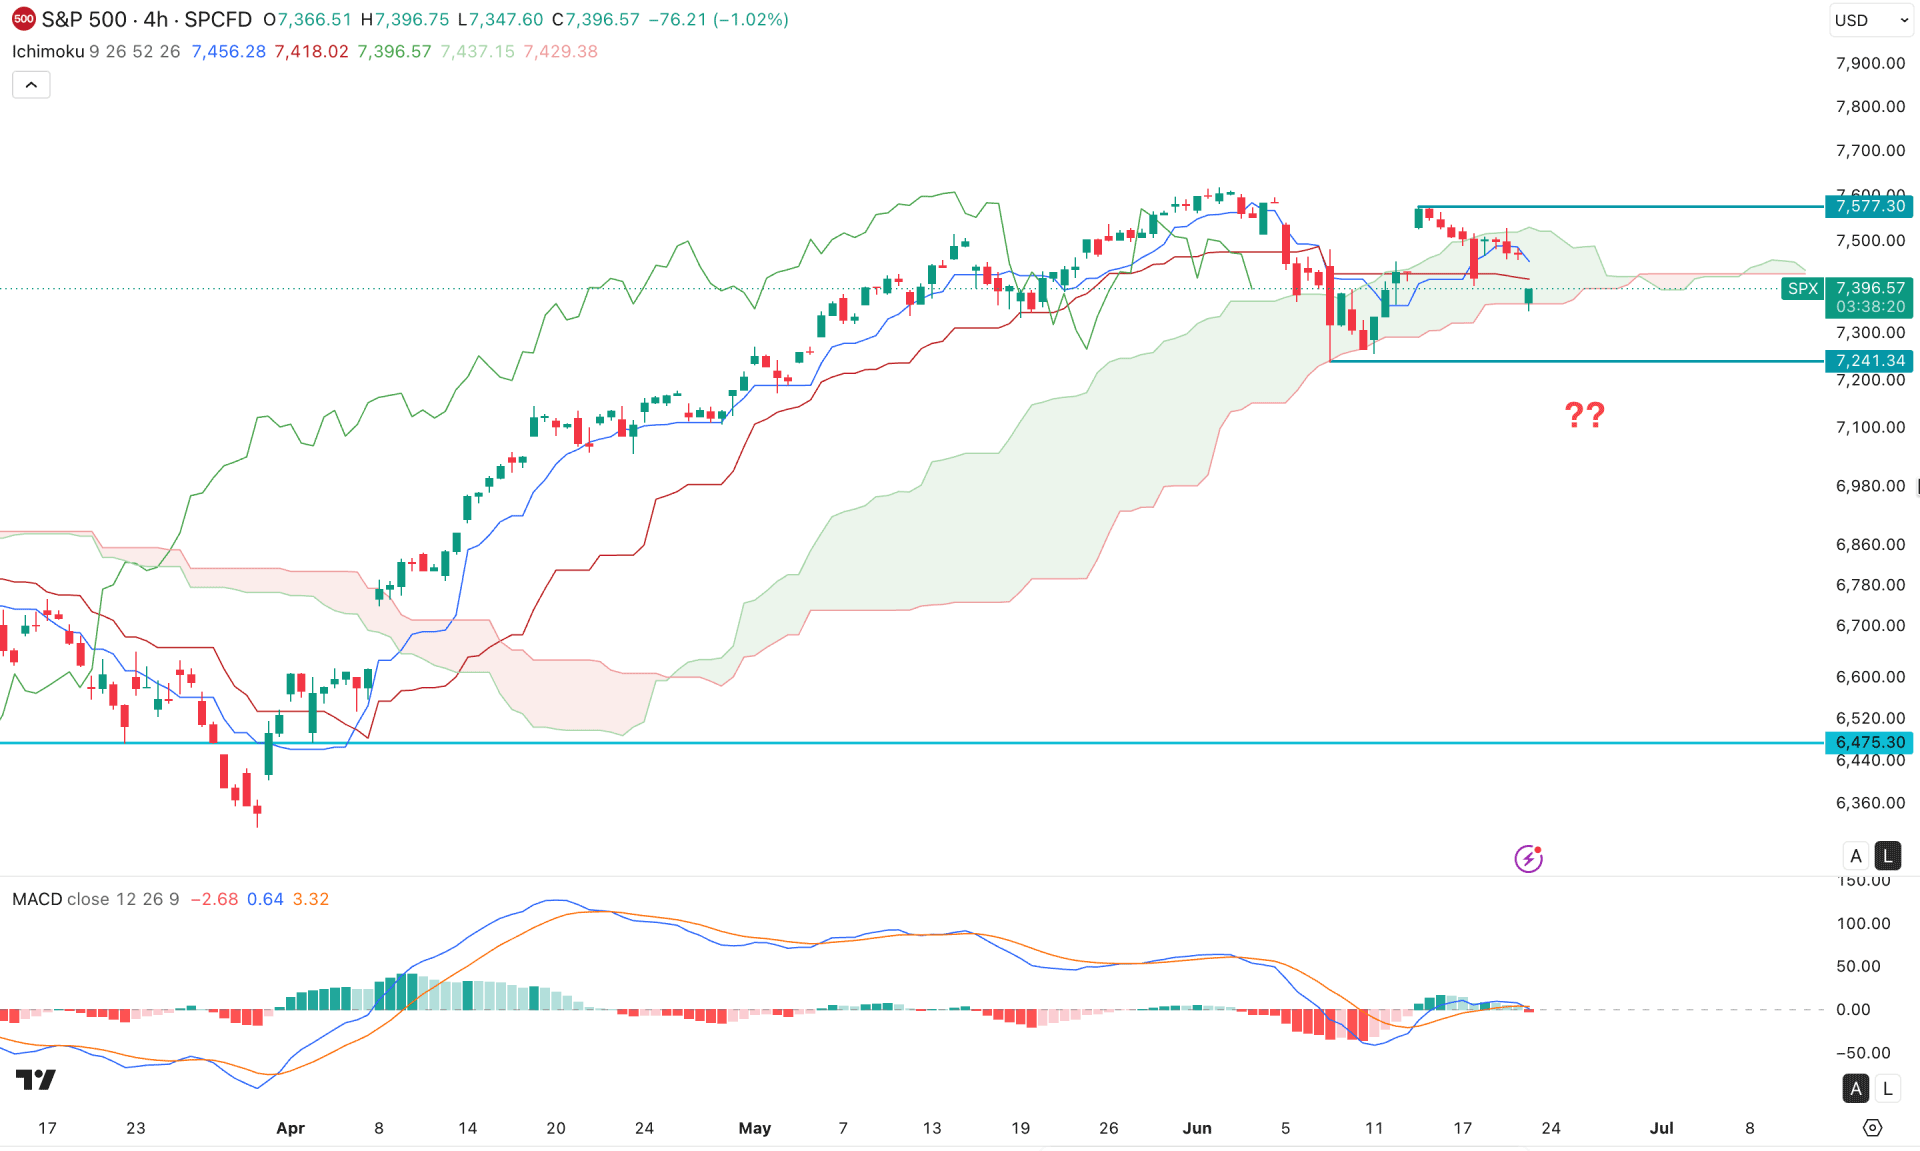
In the four-hour timeframe, the S&P 500 is trading within a bullish trend, while the recent price is showing a decent downside correction. As no significant selling pressure is seen below the cloud support, the major aim would be to look for long trades only.
In the future cloud, both lines are pointing upward, with a flip in position signalling a bullish trend reversal. However, multiple bearish four-hour candles are seen below the dynamic support line, which signals a barrier to buyers.
The indicator also shows the same story, where the signal line and histogram remain together near the neutral level, signalling indecision. Moreover, the histogram made a bearish rebound by creating a new low below the neutral point, which signals a bearish trend rebound.
Based on the current market structure, the immediate support level is a crucial price area to look at. A potential bullish rebound above the 7577.30 level could validate the bullish trend continuation opportunity, targeting the 8000.00 area. Moreover, failure to hold the price above the 7241.34 support level could extend downside pressure and test the 7000.00 psychological level before forming another bullish signal.
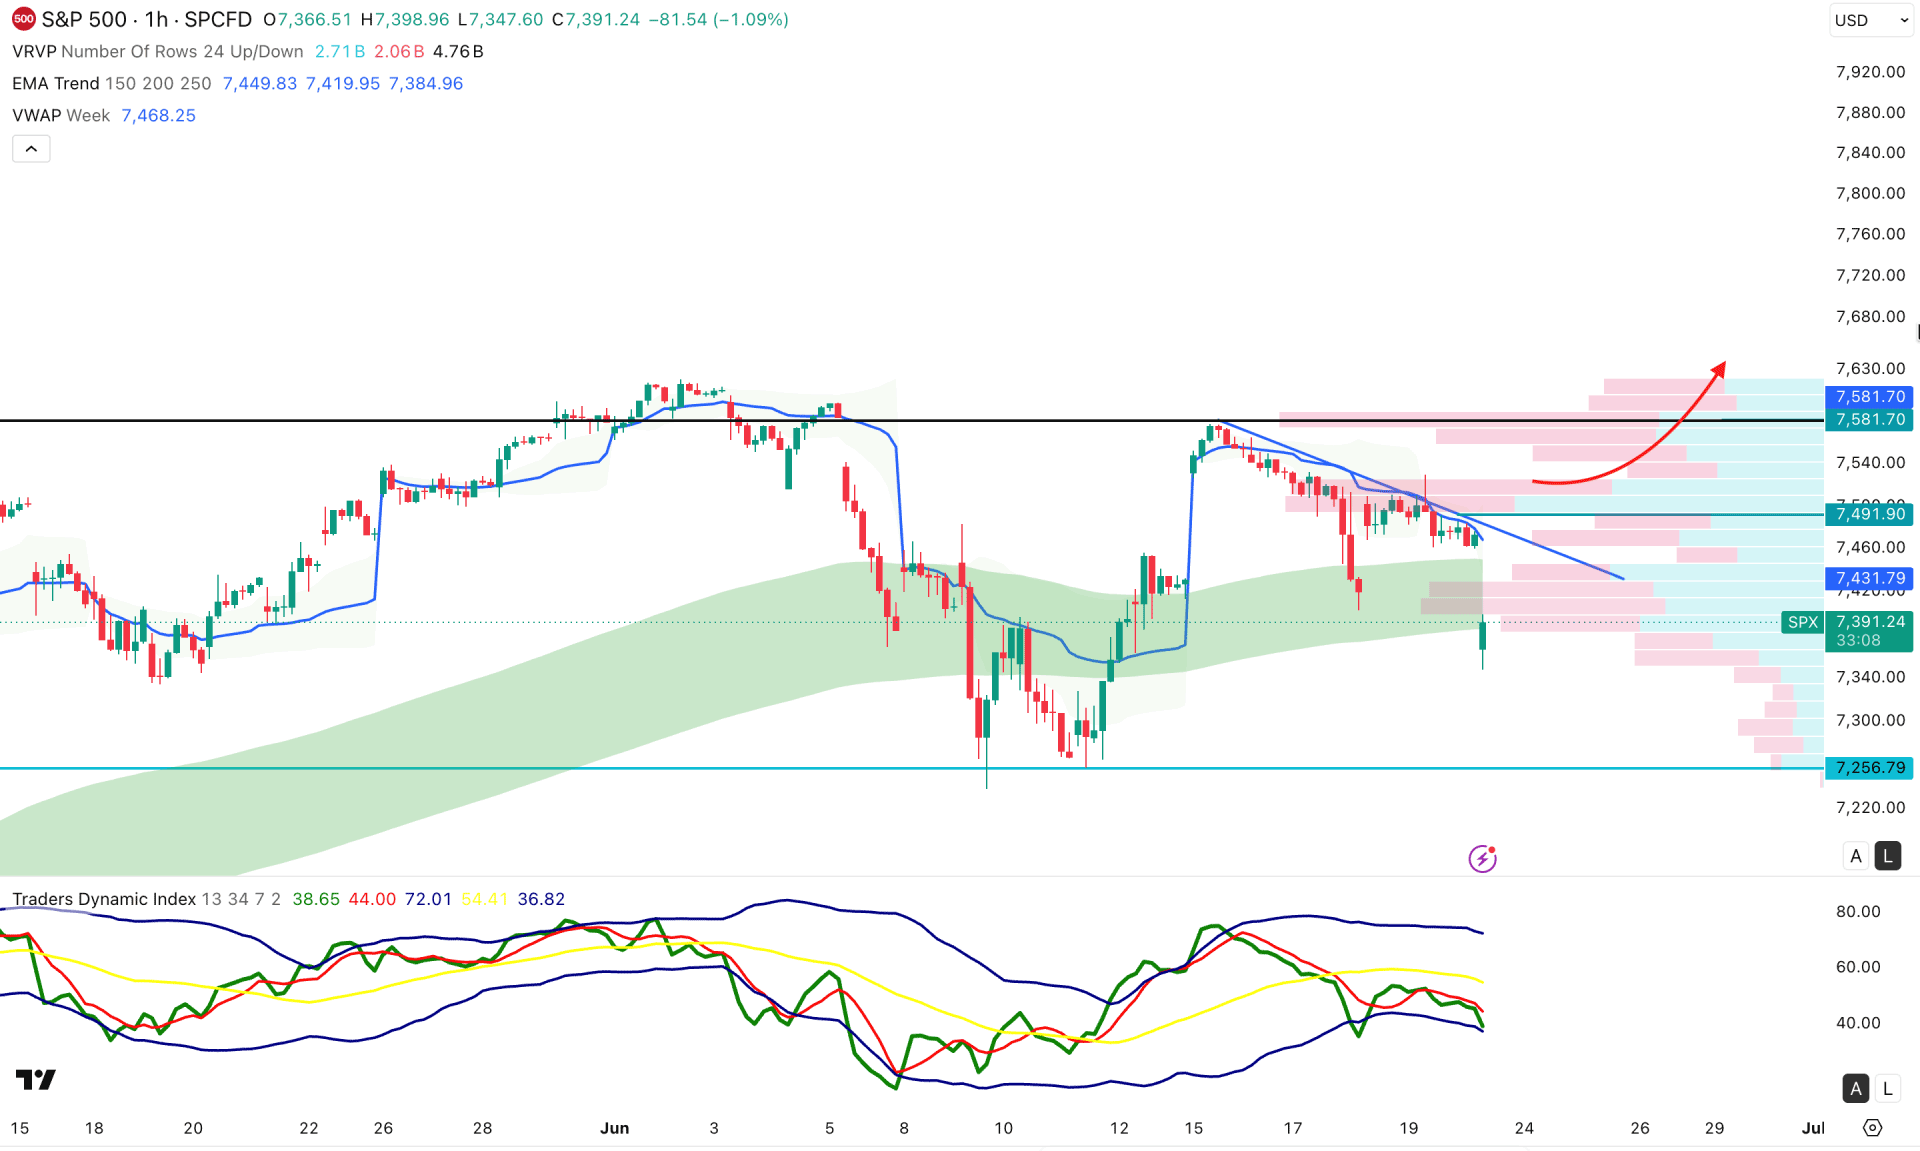
In the hourly timeframe, the S&P 500 is trading in an intraday range where the recent move created a strong gap with the existing price. However, the downside pressure has formed a strong channel resistance, creating selling pressure from the top. The high-volume line is also visible at the high, signalling active pressure in the hourly chart.
Moreover, the Traders Dynamic Index found the lower band, signalling a possible bottom formation in the main price chart. The exponential moving average is closer to the price, with no significant break below this line.
Based on this outlook, a bullish rebound with a trendline breakout could validate a potential long opportunity targeting 7800.00. Investors should monitor how the price reacts at the 7943.90 level, as a valid break above this line could be a long opportunity. On the other hand, the immediate support level to look at is 7256.79, which could be tested before forming another long opportunity.
Based on the overall market structure, the S&P 500 is trading at a crucial high area, where taking more long positions needs a cautious approach. Although no sign of a bearish trend reversal is visible, the main aim would be to look for long trades only until exhaustion appears at the top with a massive buy-side liquidity sweep.


