
Published: July 1st, 2026
After a slight dip the week before, Solana (SOL) is trying to make an impact on its comeback. Increasing on-chain activity and improving derivatives mood support the SOL comeback theory. Traders should exercise caution, though, as ongoing withdrawals from the spot Solana Exchange-Traded Funds (ETFs) indicate that institutional demand has not yet fully recovered, which might limit appreciation.
The attitude toward Solana is improving, according to derivatives data. The CoinGlass financing ratio for SOL became positive on Monday, signalling optimistic sentiment and showing that longs pay more than shorts.
Furthermore, the long-to-short ratio turned positive, improving to 1.06. Bullish sentiment is indicated by a ratio above 1, as traders wager that asset values will rise.
Moreover, Solana outperforms Hyperliquid and Ethereum in terms of app revenue across all blockchains.
With $2.17 million on the day, $19.01 million on the week, and $85.5 million on the month, Solana is the leading network by app revenue, surpassing Hyperliquid (HYPE), Ethereum (ETH), and all other networks, according to the graphic below.
This shows that Solana's ecosystem is still producing robust economic growth and user engagement, demonstrating investor confidence and bolstering the argument for a long-term recovery in SOL.
According to SoSoValue statistics, SOL's spot ETFs had a $3.80 million outlook last week. The price of SOL may experience a price adjustment if this outflow pattern persists and gets stronger this week.
Let's see the further outlook from the SOL/USDT technical analysis:
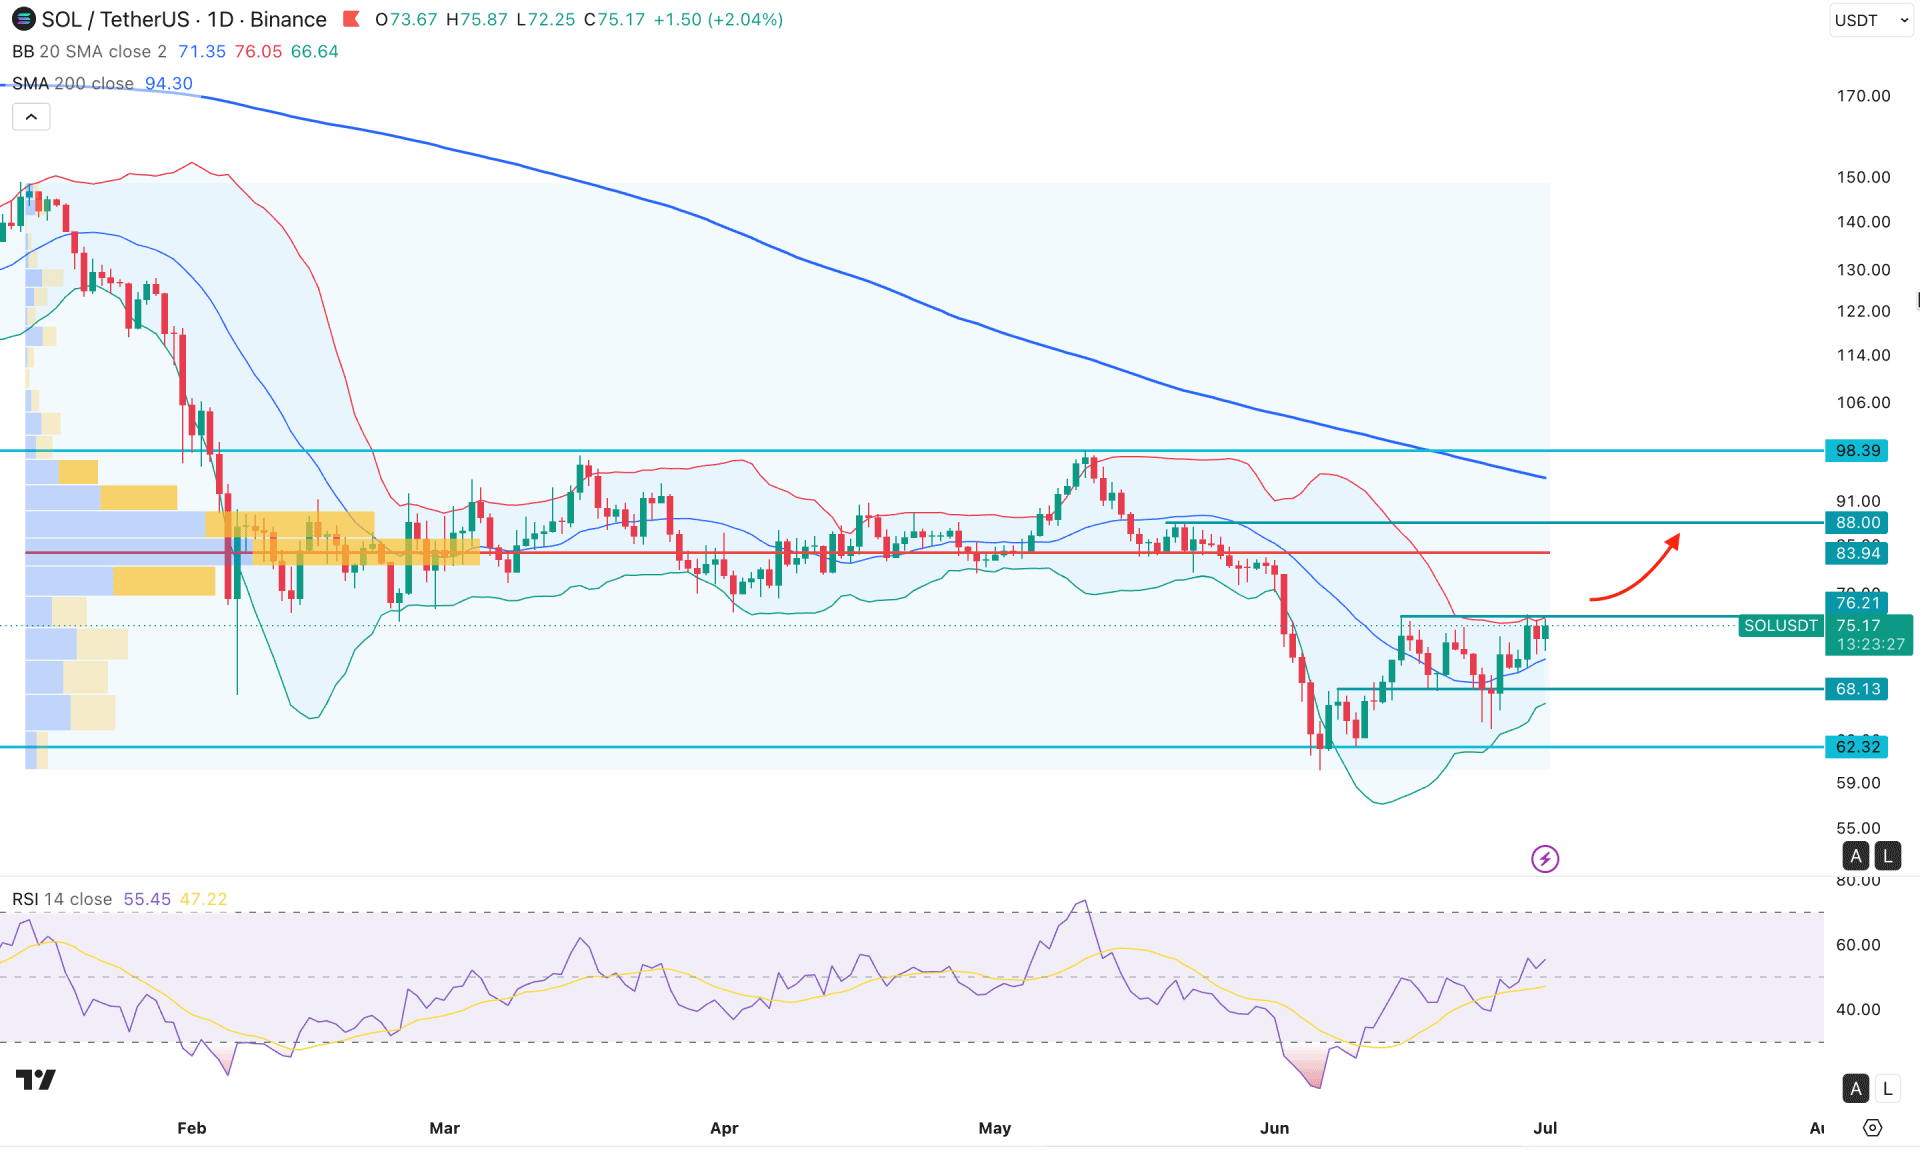
In the daily chart of SOL/USDT, a prolonged bearish trend continuation is clear. As the price keeps moving lower from the September 2025 top, sufficient indications are needed before validating the bottom and forming a bullish rebound.
Looking at the higher timeframe, the price action is bearish as the recent monthly candle is trading with a range breakout from three consecutive gravestone doji candles. However, a strong liquidity sweep is visible from the February 2026 low, from where a valid bullish rebound could confirm the trend change. The weekly timeframe shows a bullish correction within an existing bearish trend.
In terms of volume, sellers are still favorable as the largest activity level since January 2026 is at the 83.94 level, which is above the current price.
In the daily timeframe, the price within a corrective bullish wave faced the 76.21 resistance level, which is a crucial area to look at. The price tested this line multiple times and is currently knocking at this area with sufficient liquidity grab at the 68.13 low.
A stable price is visible above the mid Bollinger Band line as the price keeps holding momentum above it for a certain period. However, the upper Bollinger Band line is squeezed near the current area, which signals a possible bullish pre-breakout structure.
In the indicator window, the Relative Strength Index has started to rise, and the current line is stable above the 50.00 neutral level.
Based on this market structure, the ongoing buying pressure is likely to form a breakout, or a daily close above the 76.21 level could open room for testing the 88.00 level. However, the long-term bullish strength would be validated after overcoming the 83.94 high resistance line.
On the bear side, sufficient liquidity is present above the 76.21 static line. In that case, a bearish pressure with an immediate rebound below the mid Bollinger Band line could be a high-probability short opportunity targeting the 62.30 swing low.
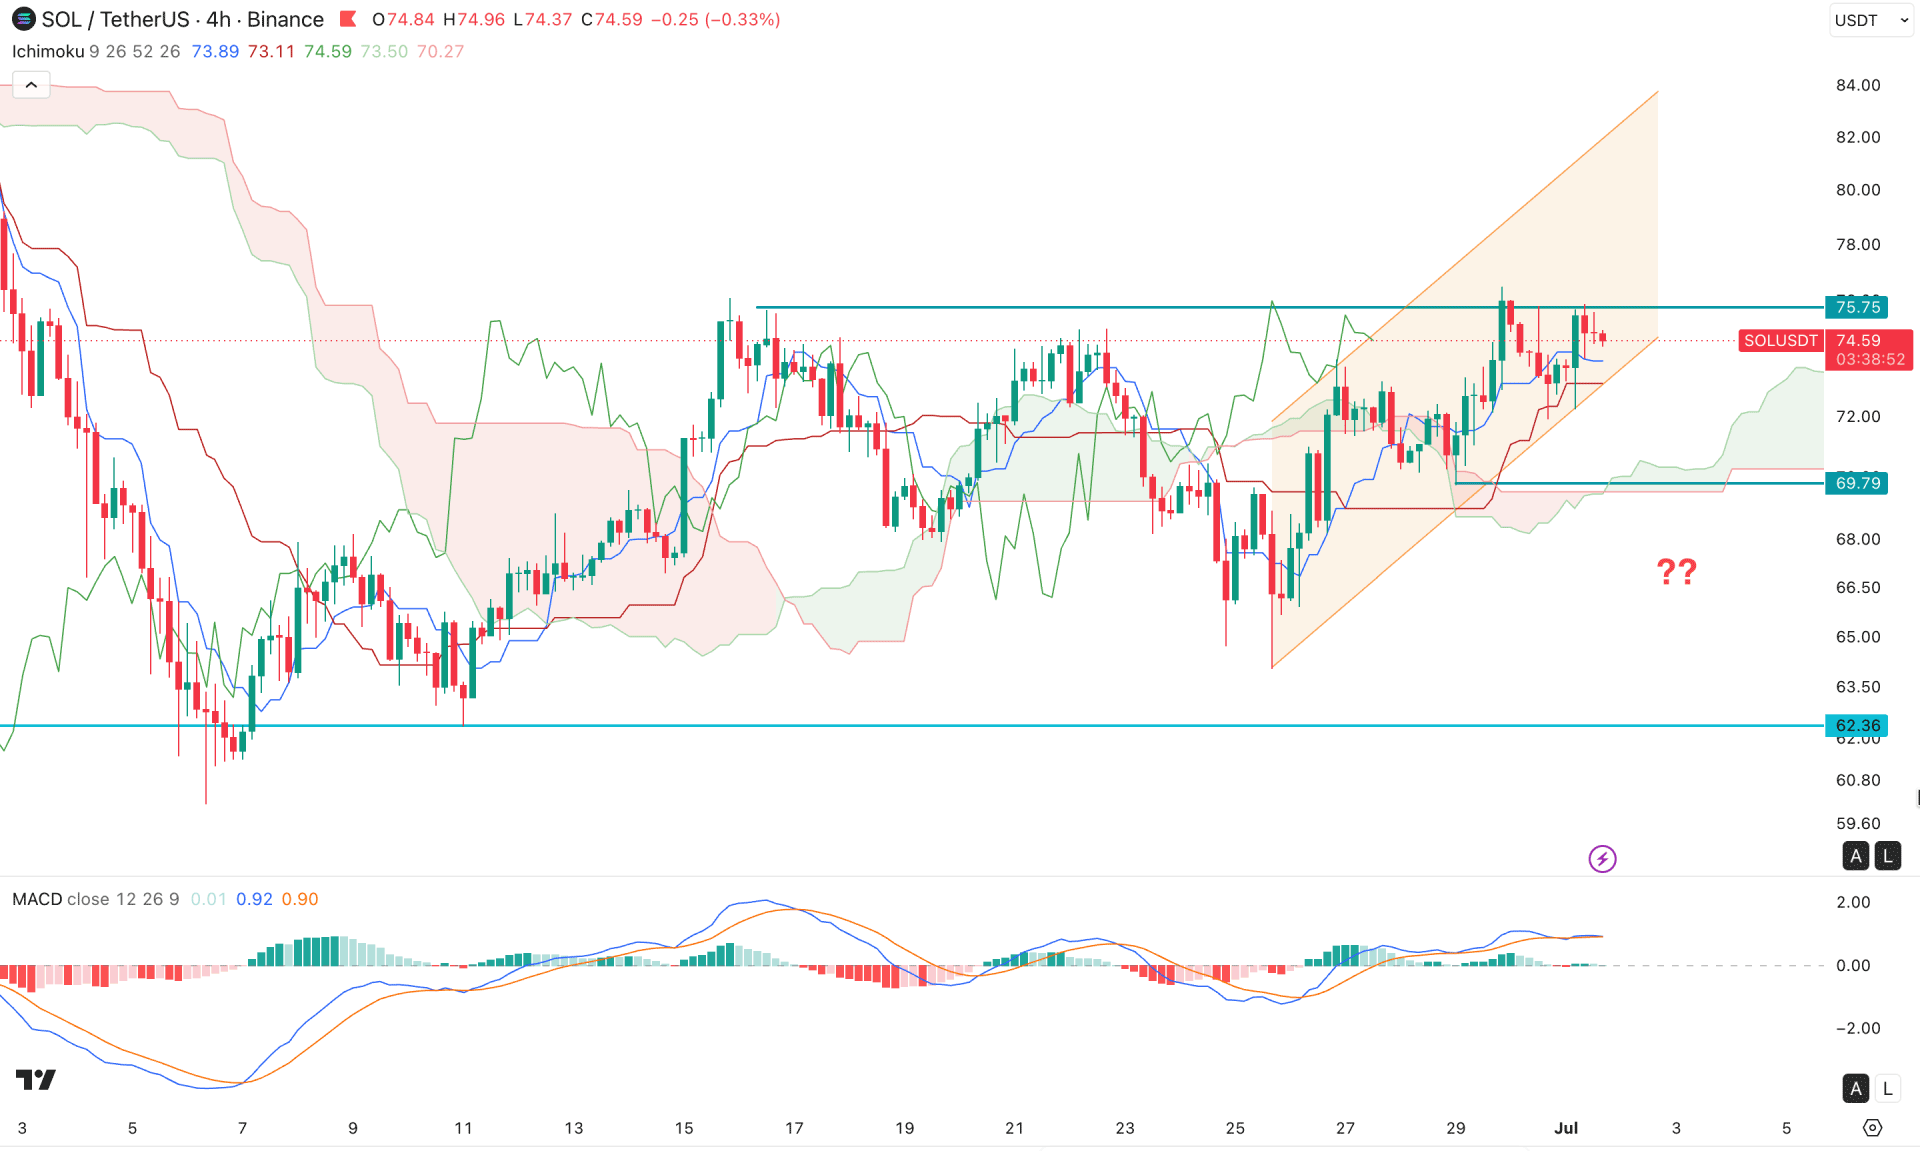
In the four-hour timeframe, the current price is trading within an ascending channel where the most recent price is above the Ichimoku Cloud. Primarily, the ongoing buying pressure is solid above the cloud support, and the future cloud is positive for buyers.
The recent price formed a bullish flag above the dynamic support, creating a breakout possibility at the 75.75 level. Moreover, strong support from the rising trendline with an indecisive MACD histogram signals minor buying pressure in the market.
Based on this outlook, a bullish break above the near-term resistance line could be a potential long opportunity targeting the 86.00 area.
On the other hand, a failure to hold the price above the 69.79 level with an immediate reversal could increase the possibility of testing the 62.36 key support level.
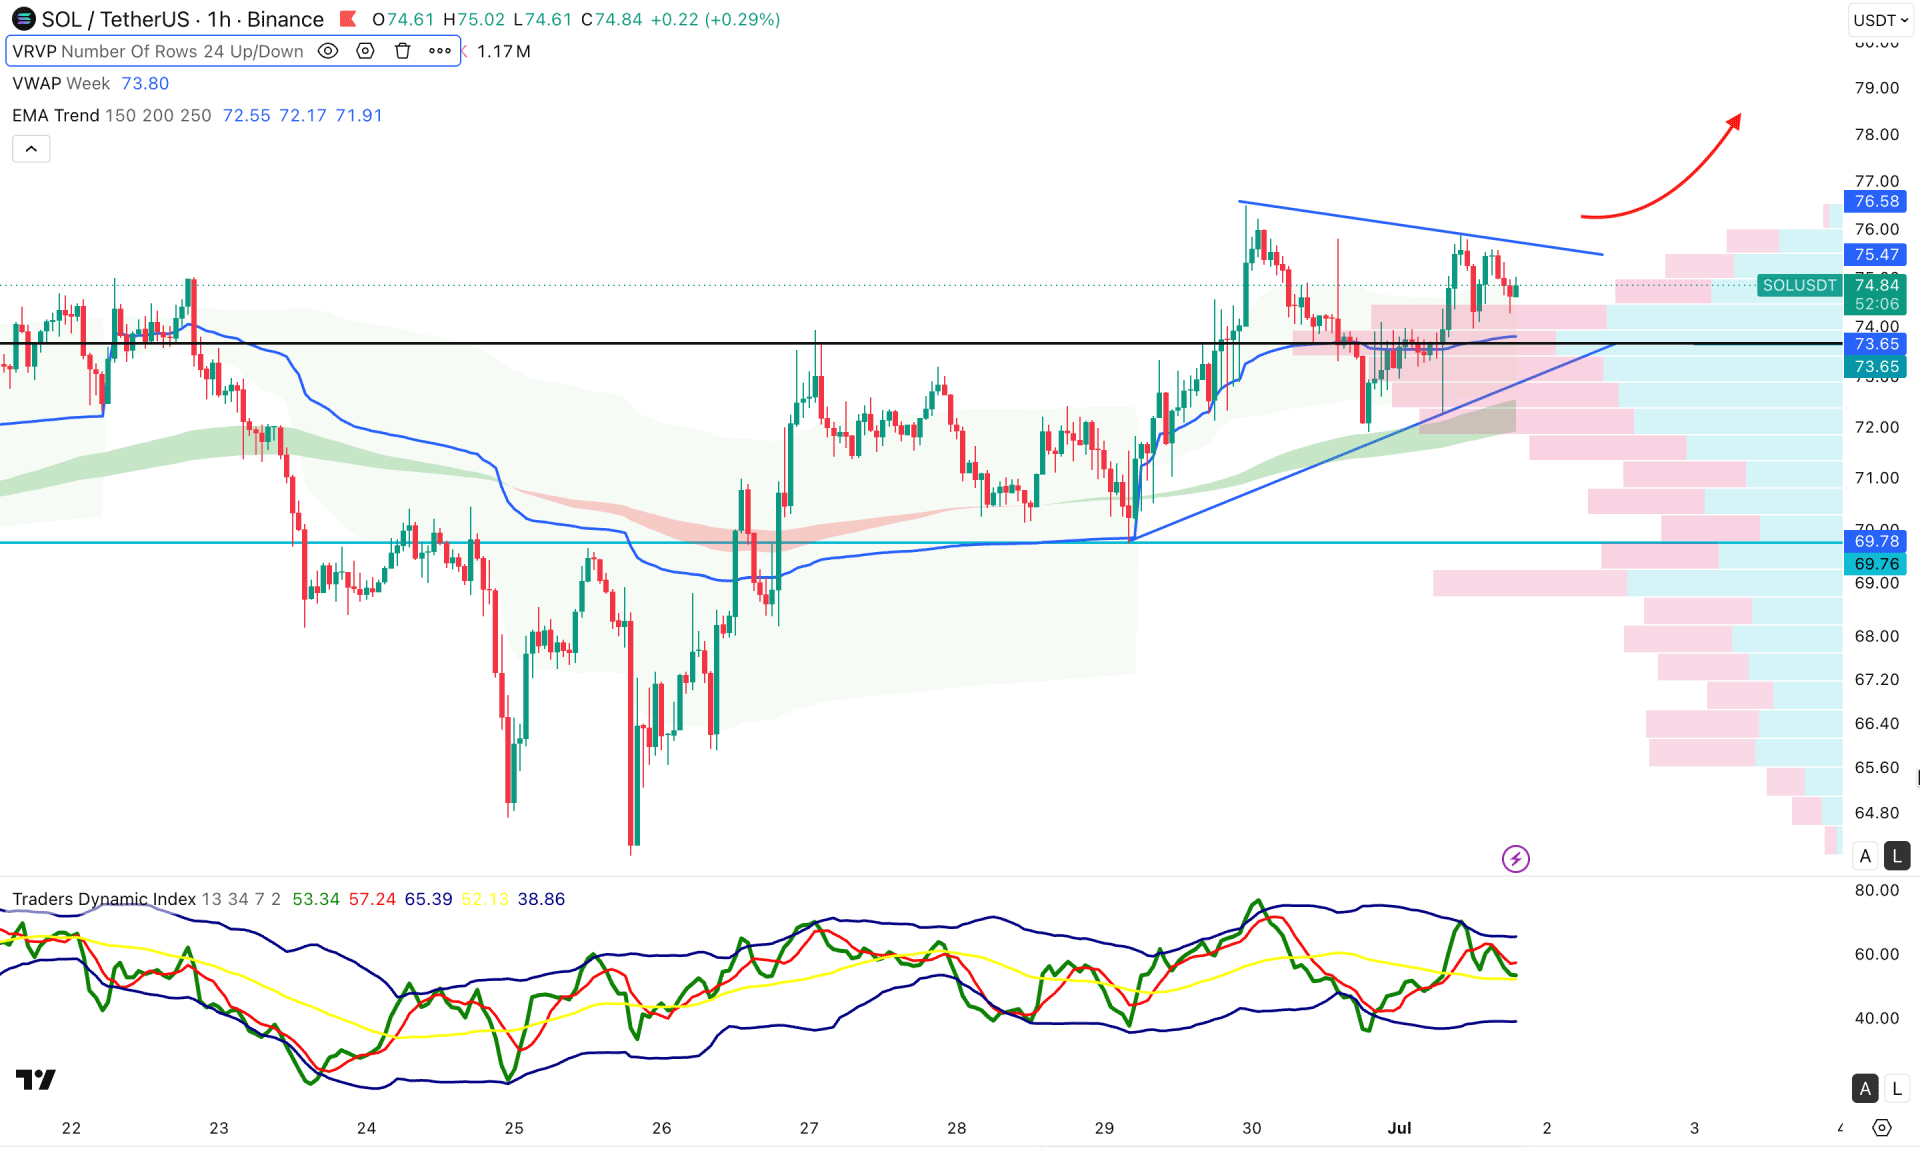
In the hourly timeframe, the price is trading within a bullish wave where a Pennant Pattern is visible, supported by the exponential moving average and the weekly VWAP line. Moreover, the Hull moving average line is below the current price and working as immediate support.
In the secondary indicator window, the Traders Dynamic Index is hovering around the 50.00 neutral line, suggesting minor pressure.
Based on this market outlook, a pennant pattern breakout with a retest could offer a potential long opportunity targeting the 82.00 area.
On the other hand, a bullish break at the pennant resistance with an immediate rebound below the weekly VWAP line could increase the possibility of testing the 69.78 support level.
Based on the overall market structure, SOL/USDT is trading within a crucial event level where a potential breakout could offer an intraday long opportunity. The price is at an extremely discounted area from where the current activity is supporting buyers. However, proper validation with price action above the event level is mandatory before opening a conservative long position.


