
Published: April 13th, 2023
In March 2020, Solana Labs introduced Solana, a rapid proof-of-stake (PoS) blockchain network that enables developers to build decentralized finance (DeFi) applications and non-fungible token (NFT) projects.
Moreover, the recent release of Saga, an Android smartphone powered by the Solana blockchain, generates enthusiasm because it will allow users to mint their own NFTs and access the broader Solana ecosystem. The Saga smartphone was announced in June 2022 by Solana's team and is anticipated to cost $1,000.
However, the trading volume of NFTs on the Solana blockchain showed a massive change, which might work as a strong downside factor. NFT trading volumes have decreased from 2 million SOL weekly in January 2023 (worth approximately $30 million at the time) to 1 million SOL over a 30-day period.
According to DeFiLlama, the total value locked (TVL) in DeFi applications has increased from $208 million to $294 million year-to-date. Bitcoin's recent psychological breakthrough above $30,000 has benefited the market as a whole.
Should you invest in Solana (SOL)? Let’s see the upcoming price direction from the SOL/USDT technical analysis:
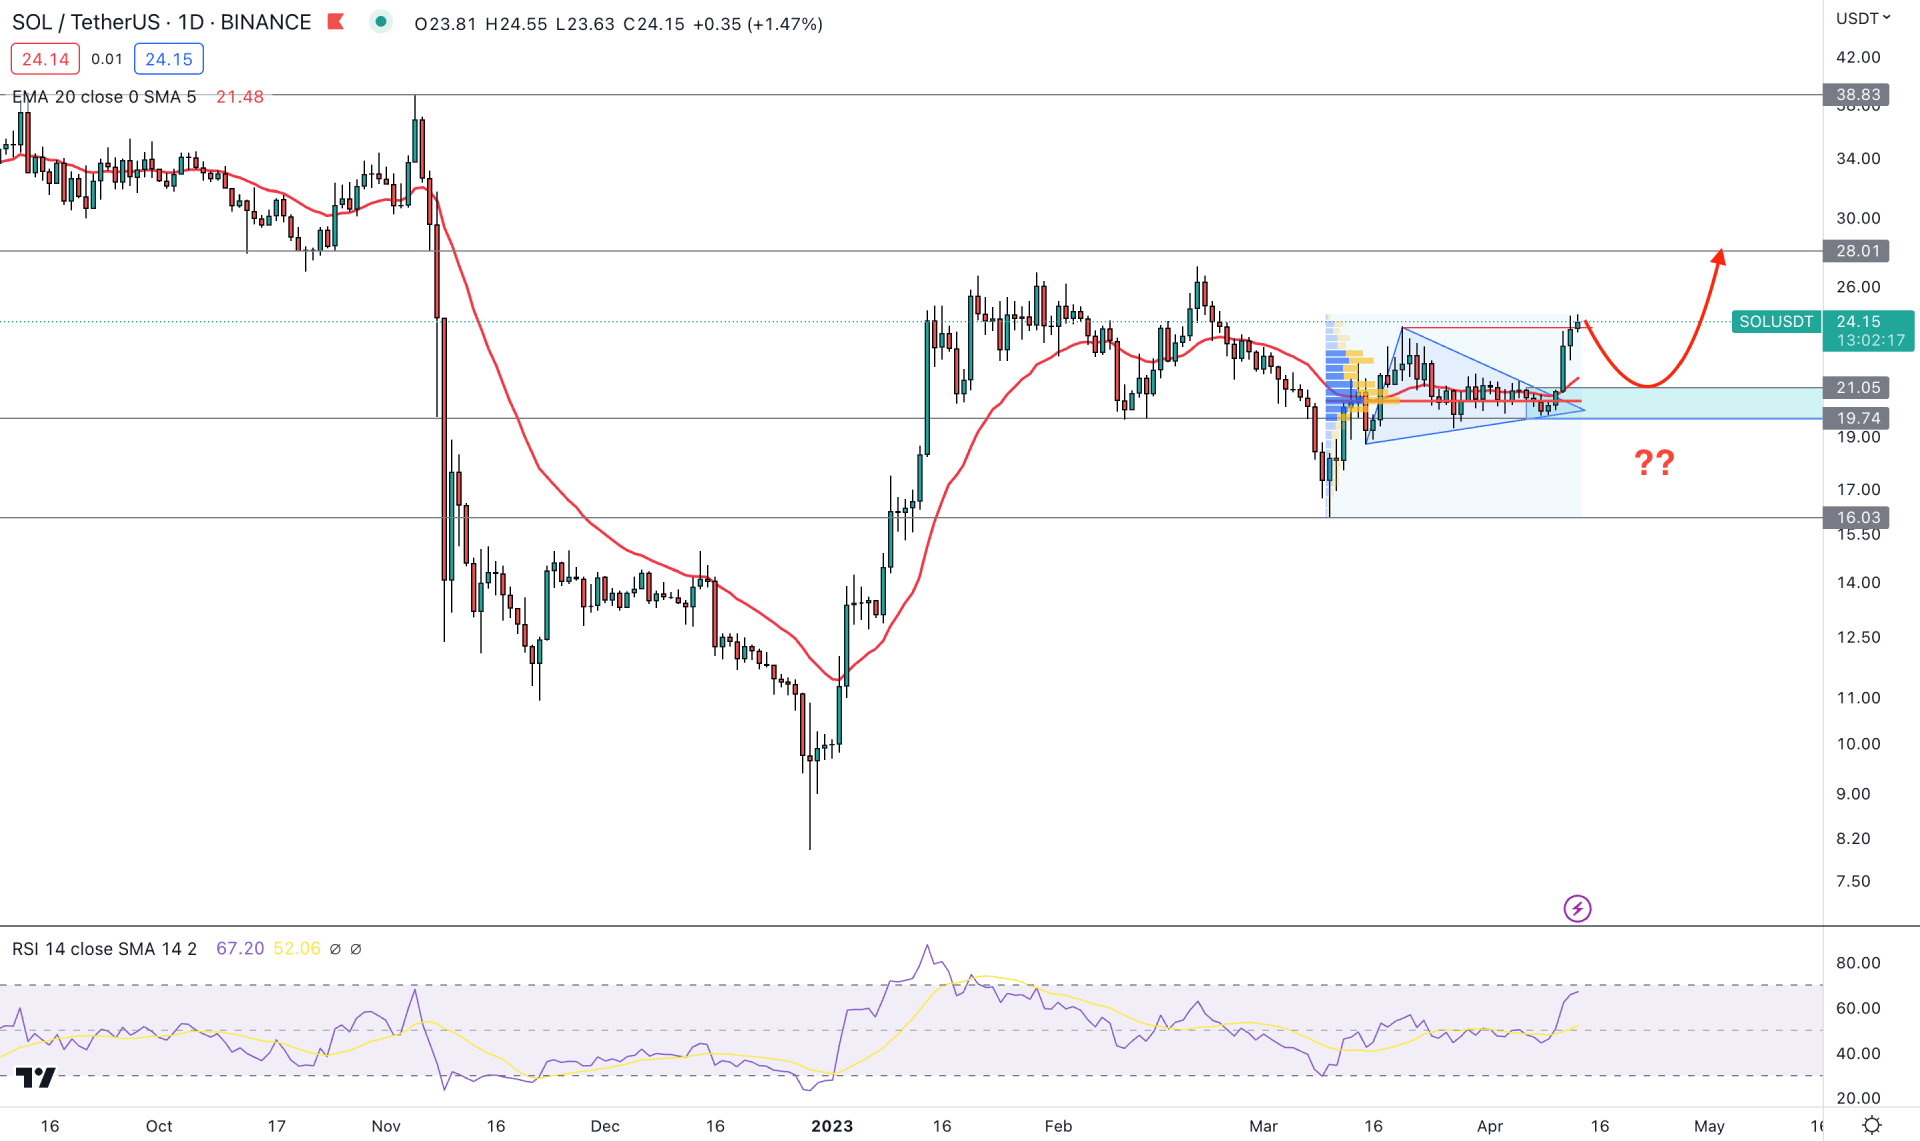
In the daily price, a strong bullish trend continuation pattern is visible, which was initiated from January 2023 low. In the initial wave, the price topped at 27.17 level, from where a deeper downside correction appeared. However, a strong V-shape bullish recovery with a daily candle close above the 20.22 level indicated a bullish trend continuation opportunity.
Another bullish trend continuation pattern is seen with a symmetrical triangle breakout followed by the V-shape recovery. Moreover, the bullish break of structure above the 23.88 near-term swing high validated the 21.05 to 19.74 area as a valid point of interest zone. As a result, a downside pressure and a bullish rejection from the POI area could offer a long opportunity in the lower timeframe.
The fixed range volume profile indicator shows the highest trading volume level since the 10 March 2023 low at 20.24 level, which is below the current price. It is a sign that institutional traders' interest is bullish in this pair, which can increase the price in the coming days.
The price is trading 12.84% higher from the dynamic 20-day Exponential Moving Average level, while the current Relative Strength index (RSI) is bullish above the 50.00 neutral line.
Based on the current daily outlook, the first buying opportunity is available from the 21.05 to 19.74 Point of Interest area, which needs validation from the lower timeframe. However, a liquidity sweep from the 19.74 level could offer an immediate buying opportunity, and for both cases, the target price would be the 38.83 level.
The alternative approach is to look for short opportunities if a daily candle closes below the 16.00 level, which could lower the price towards the 10.00 area.
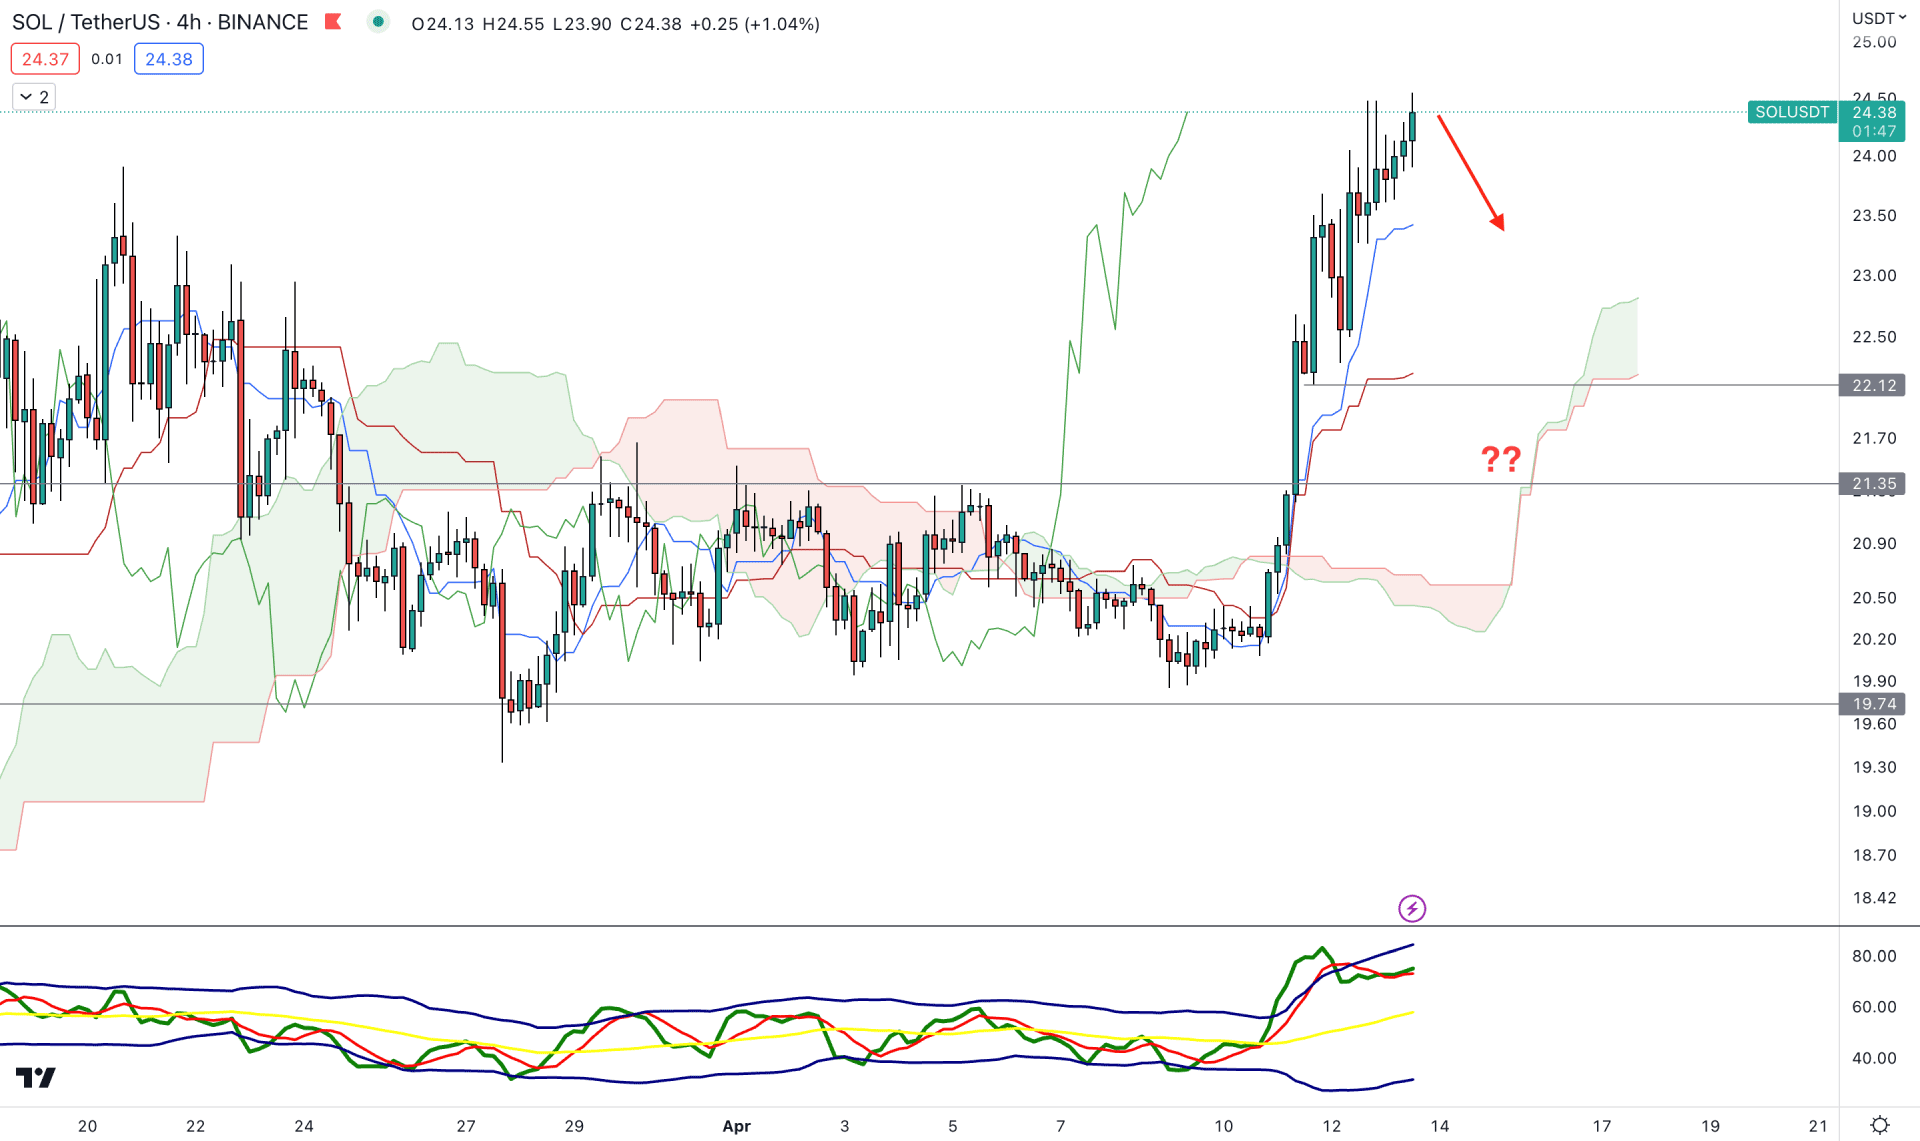
In the H4 chart, the broader outlook is bullish for SOLDUSDT as impulsive bullish pressure is seen above the dynamic Cloud support.
In the latest bullish wave, a sufficient downside correction was seen, where the 22.12 level would be crucial. As per the primary outlook, the bullish trend continuation opportunity is present as long as the price trades above this support level. In the future cloud, the thickness is strong for bulls, which is a sign of a buying opportunity from near-term swings. Based on this outlook, a minor downside correction is possible, but the broader structure is bullish. In that case, the ultimate target for the upside momentum is to test the 30.00 level. However, breaking below the 21.35 level could alter the current market momentum by lowering the price towards the 19.74 support level.
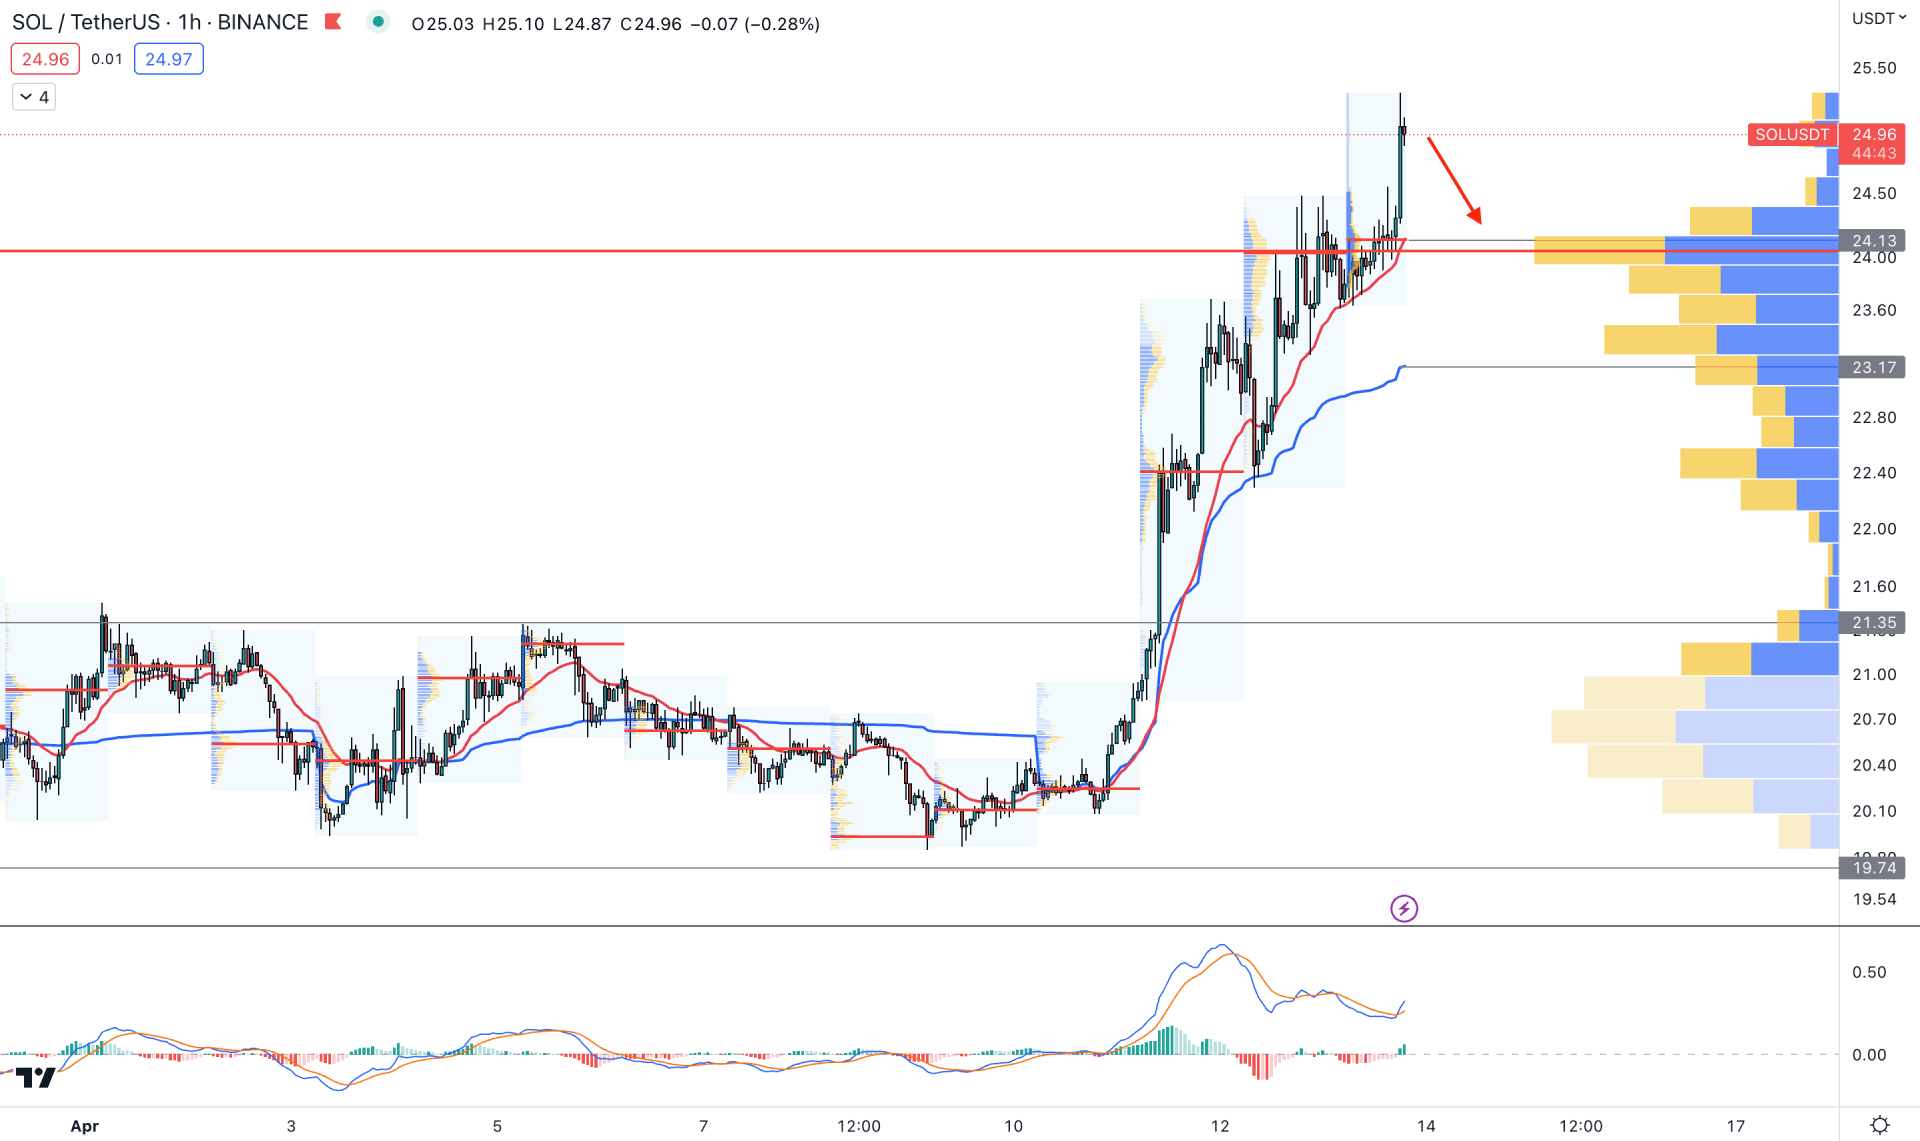
In the hourly chart, the bullish pressure is extreme, and a stable momentum above the visible range high volume level shows a buyer's presence in the market.
However, significant buying pressure from the 20.07 level has provided a 26% gain to bulls, making a strong gap with the dynamic 20 EMA support. As a result, a minor downside pressure may come due to profit-taking, where the maximum downside pressure may come towards the VWAP support.
Based on this outlook, investors might expect a downside correction before joining the bullish rally. In that case, a bullish rejection from 20 EMA or weekly VWAP could provide a bullish trend trading opportunity.
Based on the current price outlook, SOL/USDT will likely extend its buying pressure in the coming days. Investors should focus on how the price trades on the intraday chart, where any valid liquidity sweep, or bullish rejection from a reliable support could offer a buying opportunity.


