
Published: February 4th, 2026
After dropping more than 15% over the past week, Solana (SOL) continued its slide, closing below the $100 level. Derivatives data, which show increasing short positions and negative financing rates, further support the negative price action. Technically, a daily close below $100 is already active, suggesting more selling pressure.
A pessimistic view is supported by Solana's derivatives data. According to Coinglass's OI-Weighted Funding Rate statistics, more traders are betting that the price of SOL will continue to decline than are betting that it will rise.
The indicator, currently at -0.0080% on Tuesday after flipping to negative on Saturday, suggests shorts are making money off longs, and that sentiment against SOL is pessimistic.
Additionally, Coinglass's long-to-short balance for SOL is at 0.97. Since more traders are betting on the SOL price declining, a ratio below one indicates a pessimistic market mood.
Additionally, last week saw a decline in institutional demand for Solana. Spot Exchange-Traded Funds (ETFs) recorded a $2.45 million withdrawal last week, the first quarterly withdrawal since their inception.
Let's see the further outlook of this coin from the SOL/USDT technical analysis:
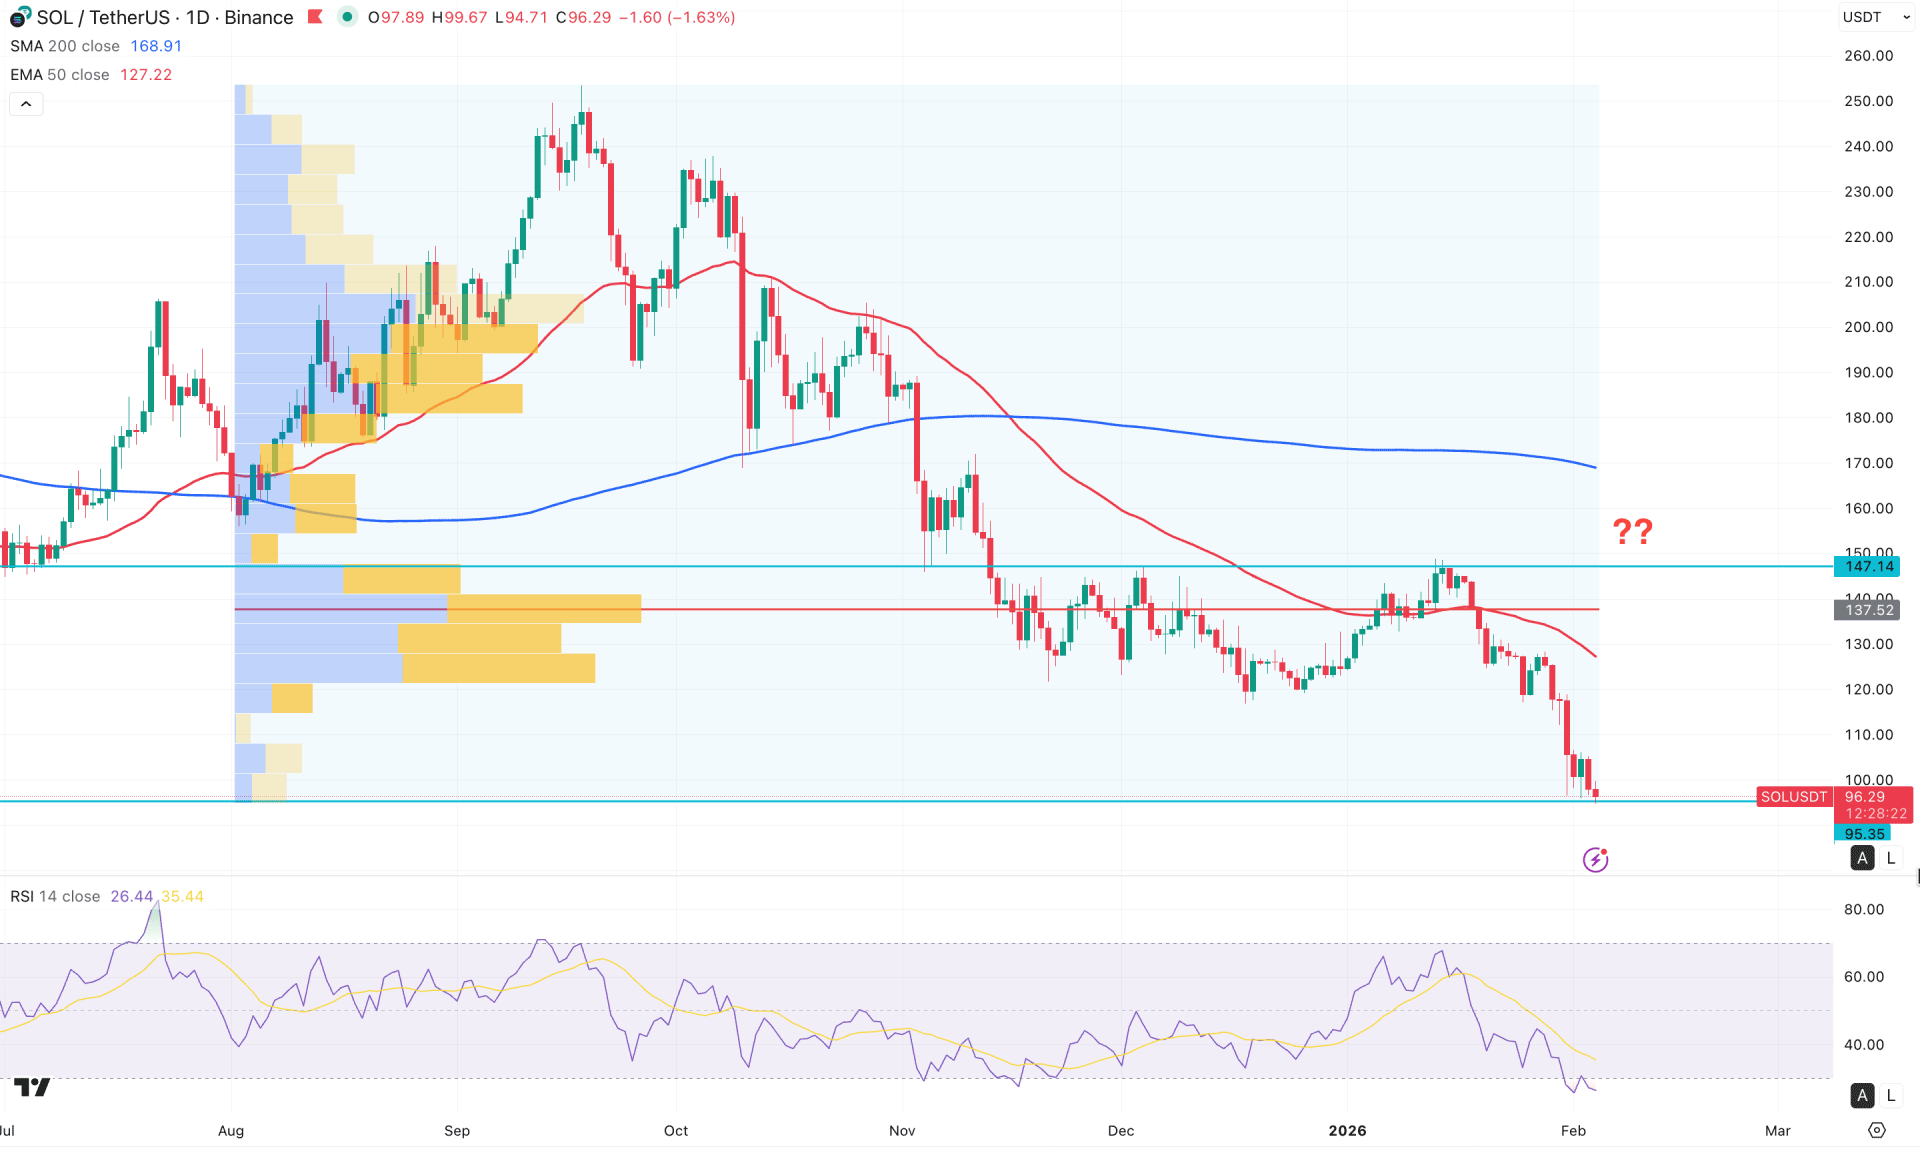
On the daily chart of SOL/USDT, strong selling pressure appears likely, as the most recent price has reached a crucial area. Investors should closely monitor how the price reacts at this level, as a failure to sustain bullish momentum could trigger a strong bearish trend.
Looking at the higher timeframe, strong bearish momentum is visible on the monthly chart, with a potential head-and-shoulders formation. Based on the current structure, the neckline of this pattern is at the 95.35 level, just below the current price. Additionally, the weekly chart shows strong bearish conditions, with a potential bearish continuation / drop-base-drop formation.
From a volume structure perspective, the price is trading within a selling trend, with the highest activity level since August 2025 at 137.52. Since no significant high-volume area exists below this level, bearish trend continuation remains likely, even if a short-term bullish correction occurs.
On the main price chart, the 200-day SMA is positioned above the current price and is sloping downward. This confirms a strong bearish market structure that could push prices even lower. Moreover, the 50-day EMA has formed a bearish crossover just below the high-volume area, reinforcing downside risk.
In the secondary indicator window, the Relative Strength Index (RSI) has reached oversold territory, indicating extreme bearish conditions. Additionally, no bullish divergence is visible, suggesting the absence of a bottom formation or an early bullish reversal signal.
Based on the daily market outlook, SOL/USDT is more likely to complete a short-term bullish correction before resuming selling pressure. A recovery toward the 50-day EMA could present a short-selling opportunity, with the ultimate target at the 90.00 psychological level.
On the other hand, the price is struggling to sustain buying pressure above the 100.00 psychological level, where the monthly head-and-shoulders structure remains active, and the critical 95.35 support is located. A failure to hold above 95.35, confirmed by a bearish daily close below this level, could trigger an immediate short opportunity targeting the 90.00 area.
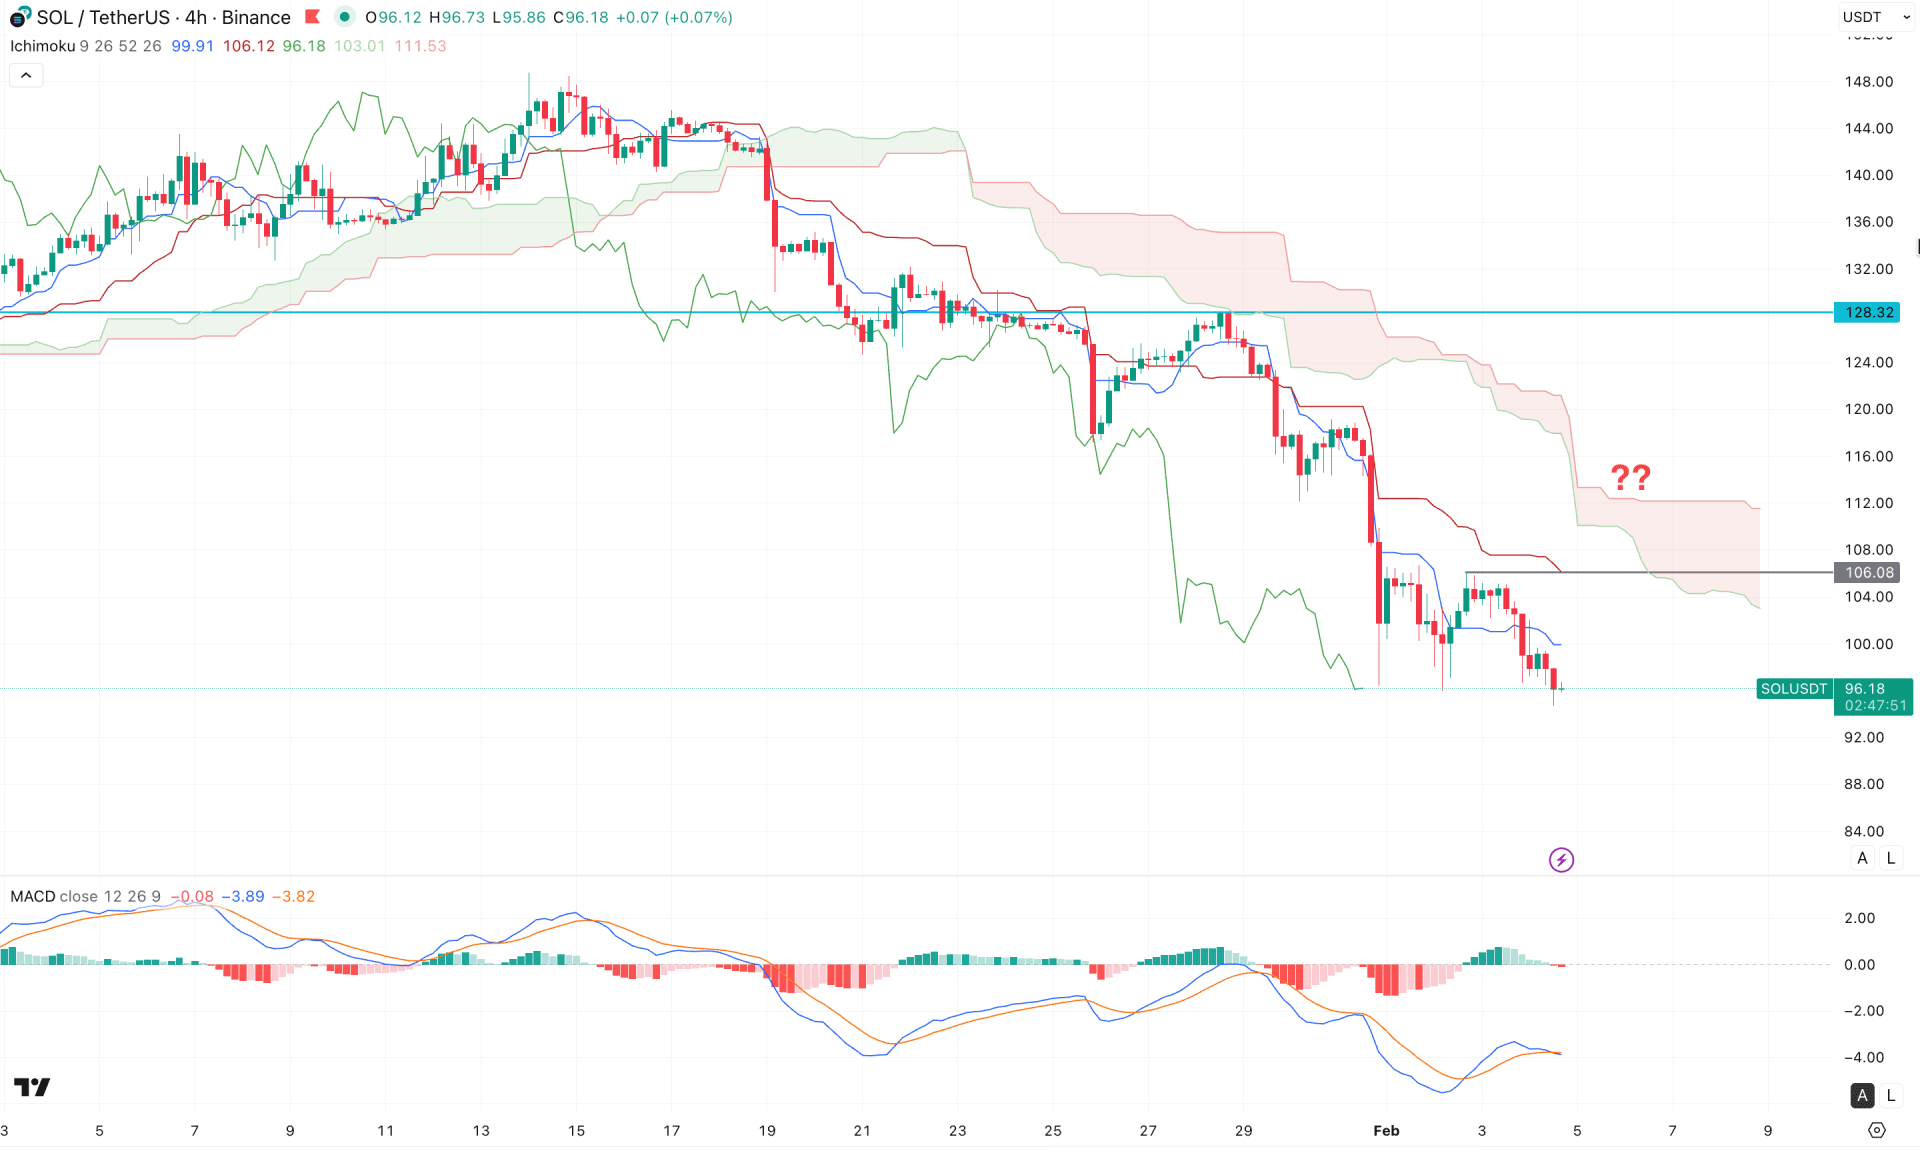
In the H4 timeframe, a strong bearish trend is visible, where the current price is hovering below the dynamic Ichimoku Kumo Cloud area. Moreover, the Future cloud shows selling pressure, as the dynamic Senkou Span A remains below the Senkou Span B and has a bearish slope.
On the other hand, the MACD Histogram remains near the neutral line, suggesting corrective price action. Moreover, the MACD Signal line remains below the current price with a possible bullish crossover.
Based on the overall market structure, the ongoing market momentum is bearish, where the potential trend extension is possible as long as the price remains below the dynamic Kijun Sen level. In that case, the primary aim would be to test the 90.00 psychological line.
On the other hand, a bullish recovery with a stable price above the Cloud zone could be the first sign of a bullish reversal. A stable price above the 100.00 psychological level, with consolidation, could initiate bullish pressure towards the 128.32 resistance level.
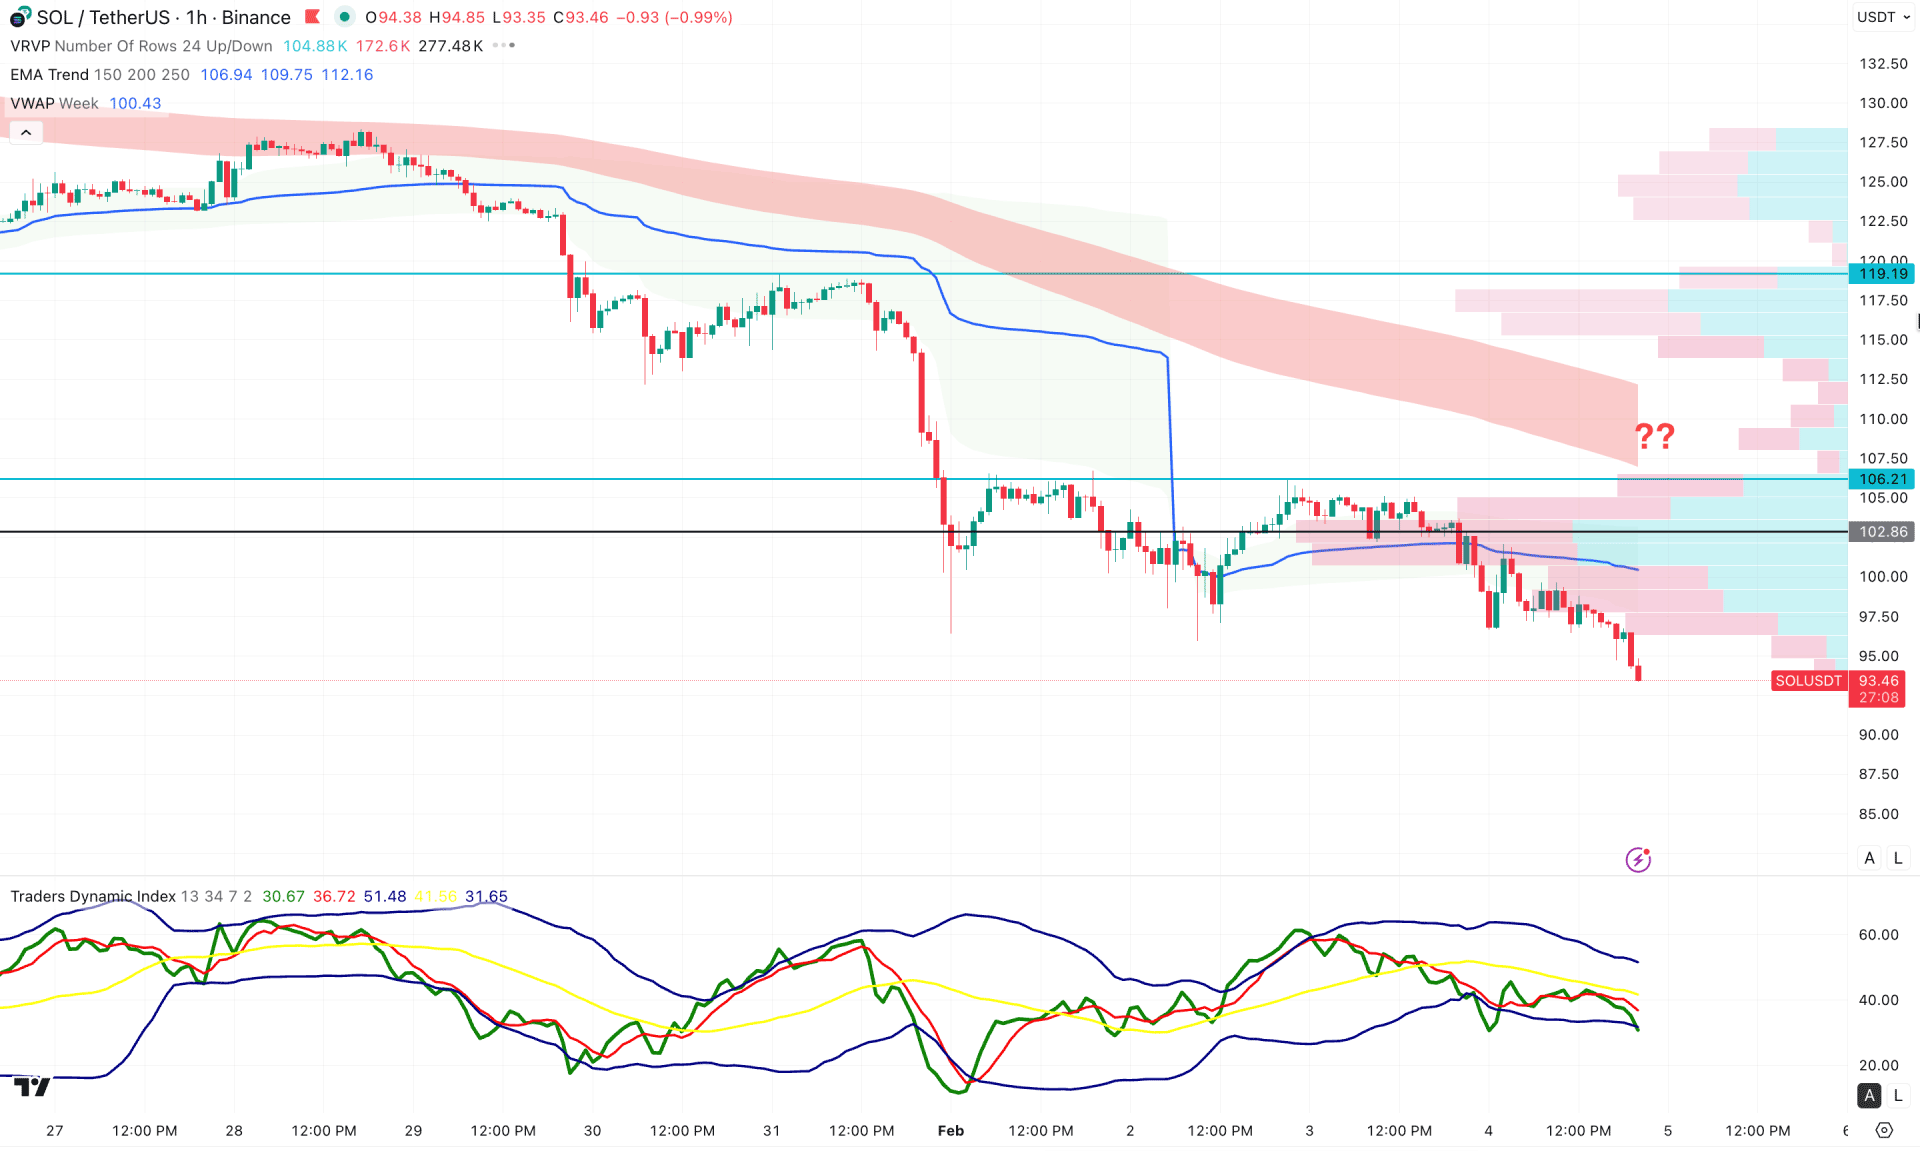
On the daily chart of SOL/USDT, the major market trend remains bearish, as the current price is hovering below the dynamic intraday high-volume line. Moreover, the weekly VWAP line is positioned above the current price, acting as immediate resistance.
In the indicator window, the Traders Dynamic Index (TDI) signals ongoing selling pressure, with the TDI line remaining below the 50.00 neutral level.
Based on this structure, the price is trading near the intraday low, with no clear signs of a bullish recovery at this stage. A potential downside continuation is likely as long as the price remains below the weekly VWAP line. On the bearish side, the immediate support level is located at 90.00, followed by a deeper move toward the 84.00 level.
On the other hand, a sell-side liquidity sweep from the 94.00 area, followed by a recovery above the 100.00 psychological level, could open a potential bullish scenario targeting the 119.19 level.
Based on the overall market structure, SOL/USDT is more likely to extend downside pressure in the coming days. The price has reached a historic low, from where failure to hold the buying pressure could initiate a long-term bearish trend.


