
Published: July 2nd, 2024
Solana (SOL), the prominent cryptocurrency by market size, experienced a 1.76% increase in its liquid staking ratio from quarter to quarter.
According to DefiLlama, liquid staking platforms are staking over $54 billion in crypto assets. In contrast to conventional staking, liquid staking enables users to maintain liquidity while earning an additional yield by utilizing a derivative token in DeFi.
The liquid staking boom in Solana is substantially influenced by platforms like Jito Labs and Sanctum. Tom Wan, a researcher and analyst, has observed that Sanctum has reduced the entry barrier and is assisting projects in developing and expanding their liquid staking tokens (LSTs).
The prevalence of liquid staking presents an opportunity for Solana to capitalize on increased user engagement and improved network security. Two significant filings for a Solana ETF have been made in the United States to date. Through the continued expansion of liquid staking, Solana may gain a competitive advantage and entice investment firms.
Let's see the further aspect of this crypto from the SOL/USDT technical analysis:
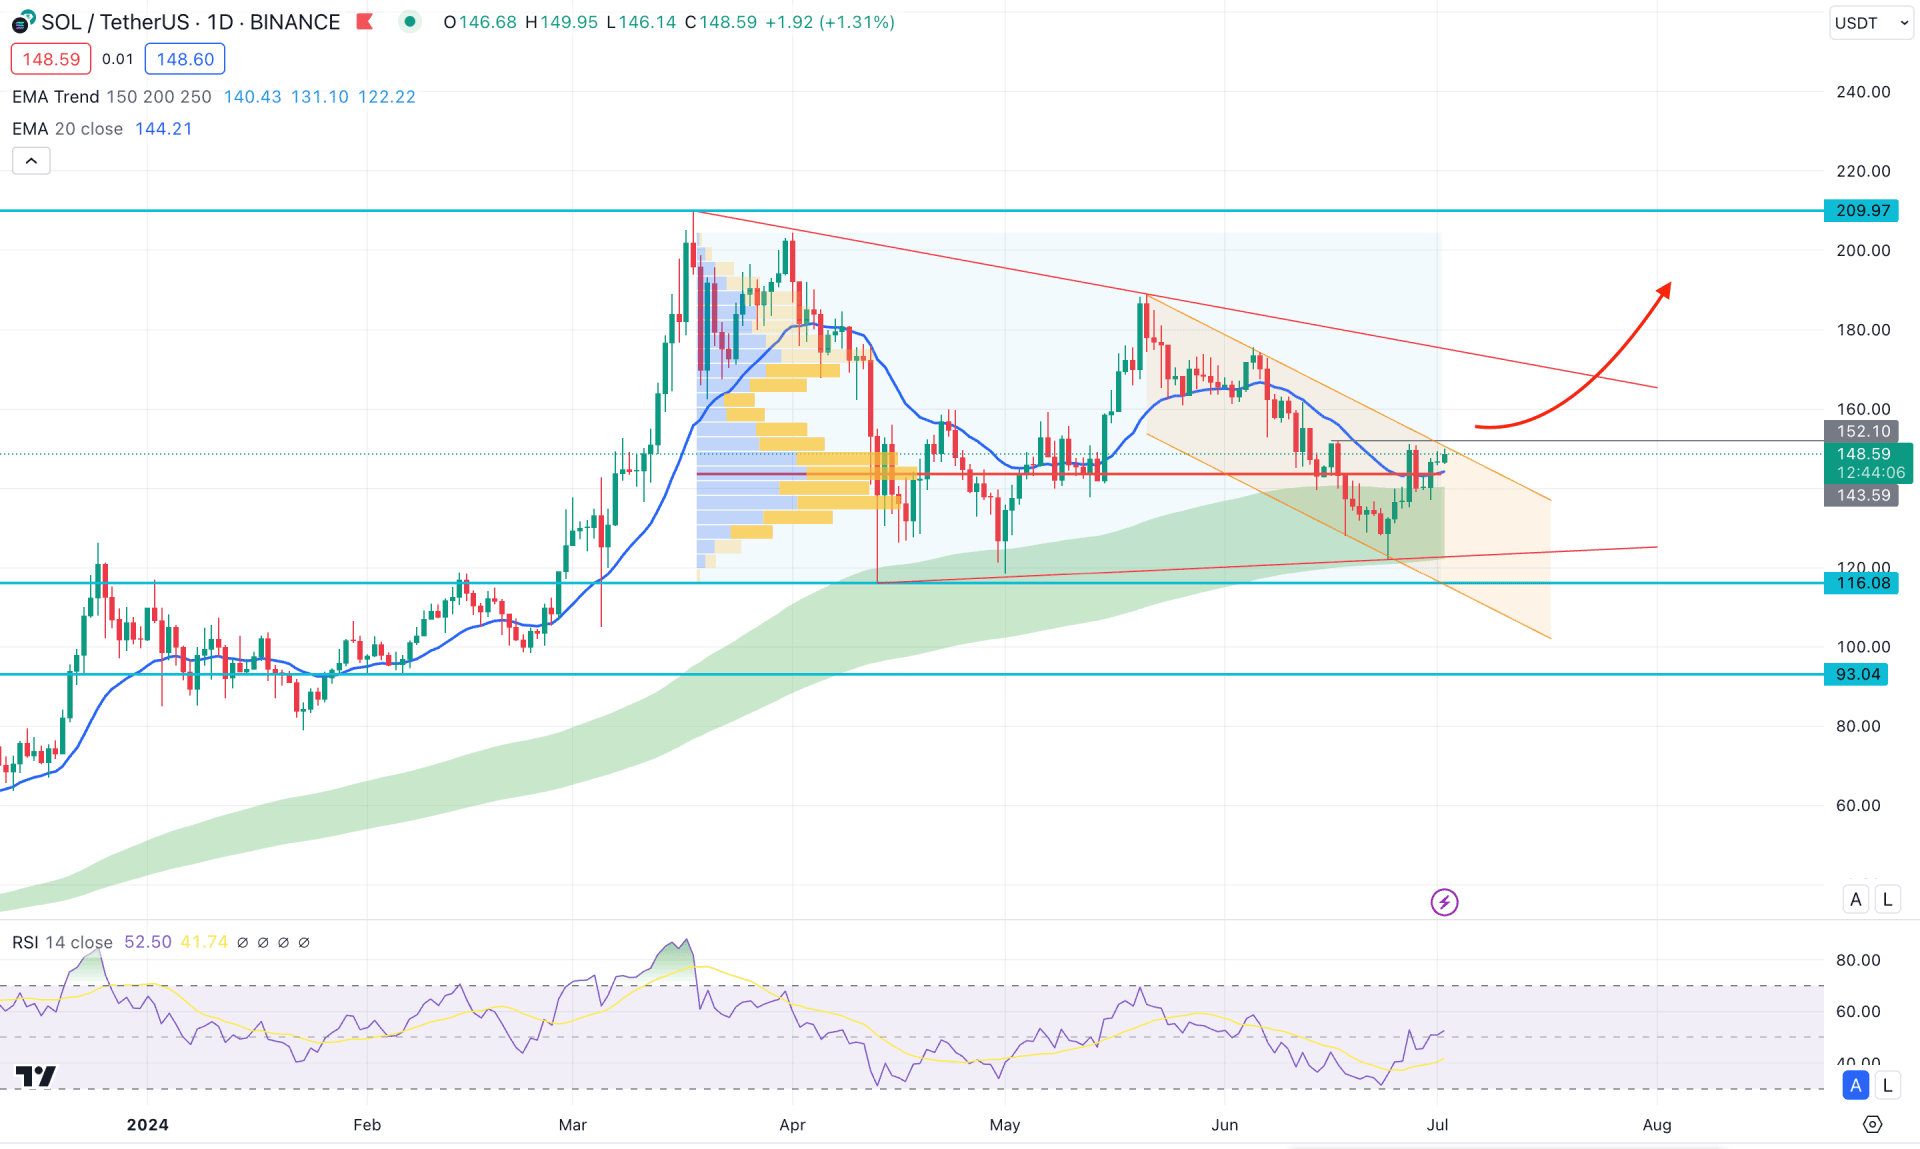
In the daily chart of SOL/USDT, the current price shows a potential bullish opportunity from the ongoing channel breakout.
In the broader context, the Moving Average wave consists of MA 150 to 250 and remains upward at the current swing low, which might work as a strong bullish factor. As the most recent price shows a bullish V-shape recovery from the MA zone, we may expect any bullish opportunity to work well in the coming days.
In the volume structure, the buying pressure is still valid where the current high volume level since March 2024 is at 143.50 level. A bullish two bar reversal is visible above the high volume line, where the 151.43 weekly resistance is a crucial barrier for sellers. A successful buying pressure with a daily candle above this line could activate the long-term upward possibility.
Looking at the recent price action, the price is trading within a bullish pennant pattern since the March 2024 high, from where the long-term HODLing approach might come from the valid pennant breakout. Moreover, the ongoing descending channel is working as an immediate barrier as the current price hovers at the channel resistance. A successful bullish break from this trend line with a stable market could activate the buying possibility.
In technical indicators, the dynamic 20 day Exponential Moving Average is the immediate support, while the 14 day RSI remains bullish above the 50.00 level.
Based on the daily market outlook of SOL/USDT, the 150.00 psychological line could be the primary barrier for sellers. A successful bullish pressure above this line could create a high probable long signal, targeting the 200.00 psychological line. Moreover, a stable market above the pennant resistance could stabilize the buying pressure.
On the other hand, a failure to break above the descending channel breakout with a daily candle below the 136.00 level could lower the price towards the 120.00 level.
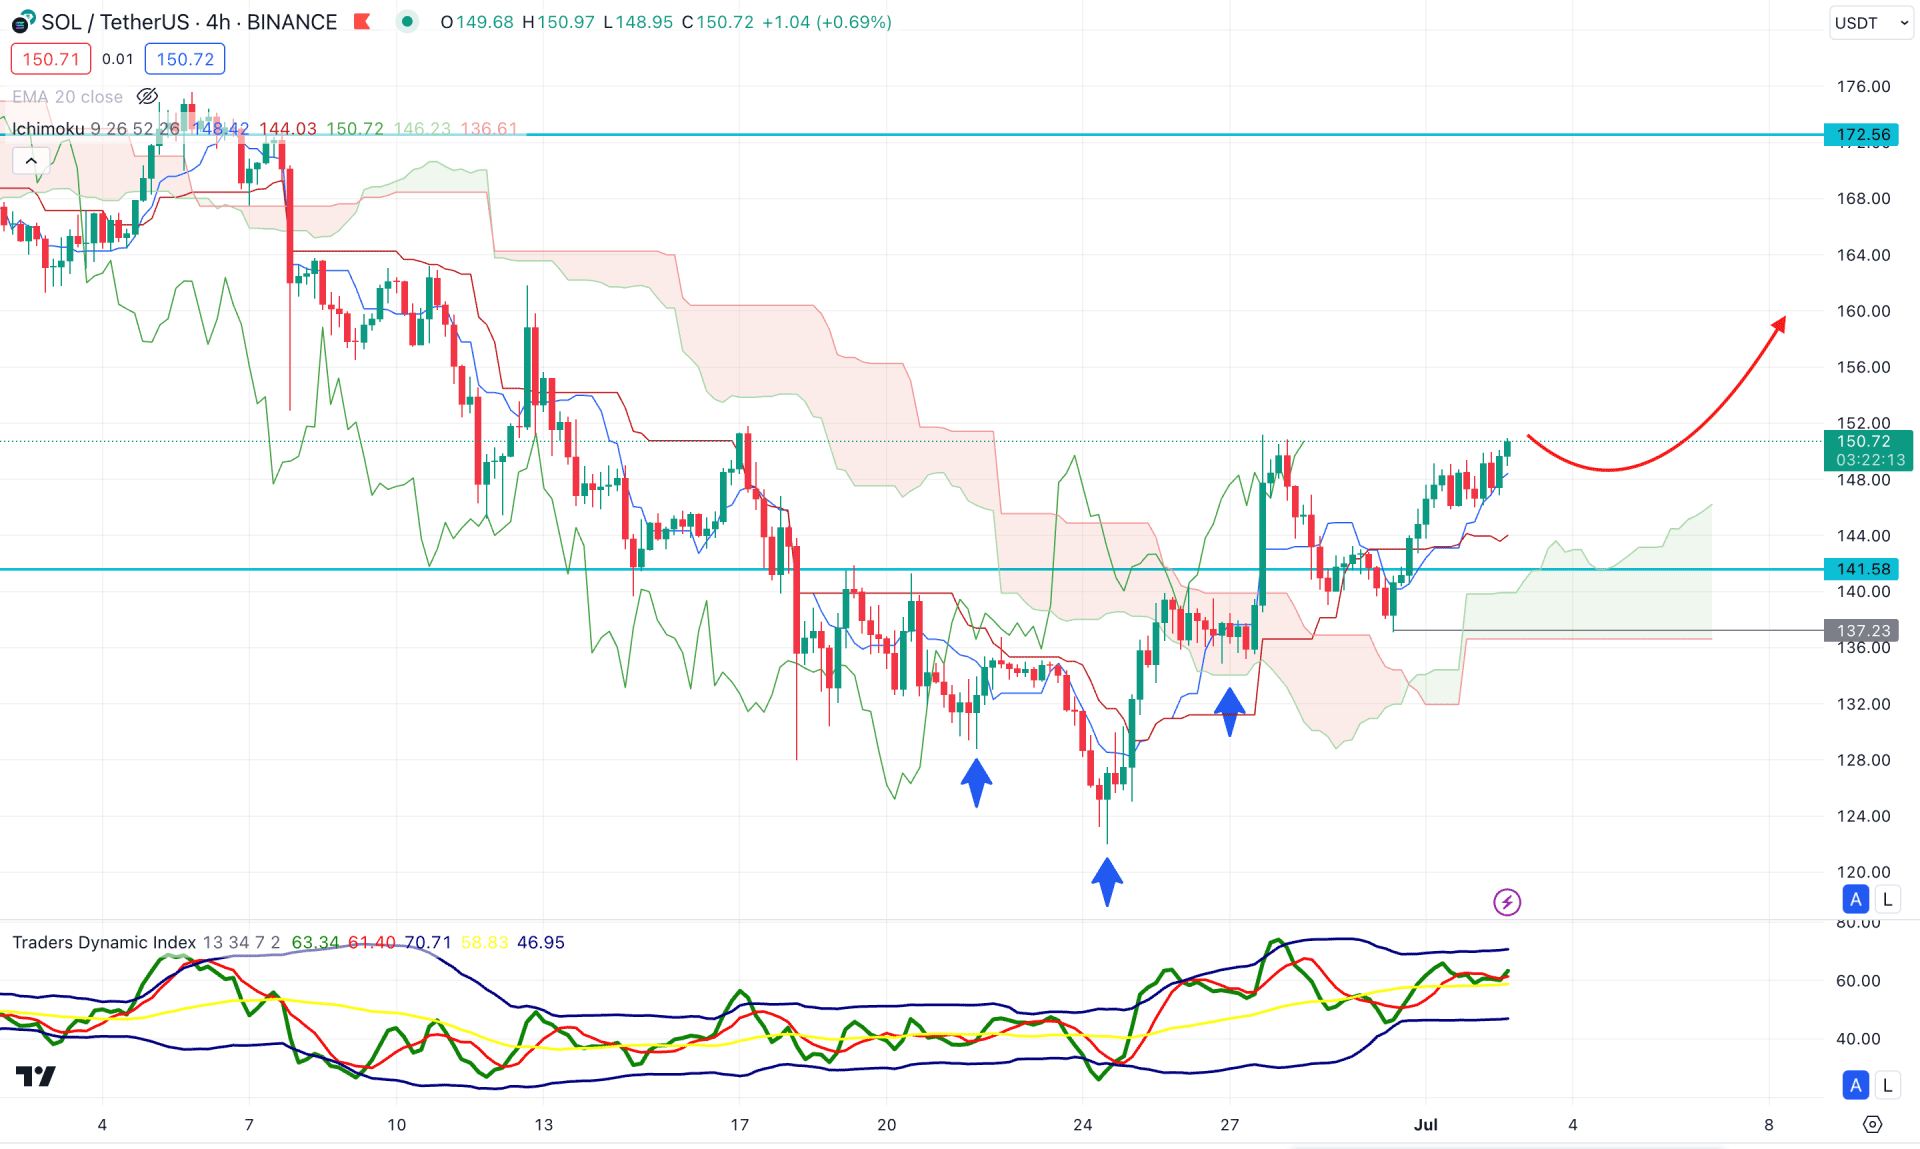
In the H4 timeframe, the recent price shows a high probability of a long opportunity from the valid inverse head and shoulders breakout. As the current price trades above the 141.58 event level, we may expect the buying pressure to extend in the coming days.
In the Ichimoku Cloud, the future cloud's position is shifted, where the Senkou Span A is above the flat Senkou Span B. In the indicator window, the Traders Dynamic Index (TDI) remains corrective at the 60.00 level, suggesting a bullish continuation in the upper band area.
Based on the four-hour price section, the upward continuation is potent, where the main aim is to test the 172.56 resistance level. However, the buying pressure is valid as long as the dynamic Kijun Sen is acting as a support level.
The alternative approach is to find an immediate reversal with an H4 candle below the 140.00 psychological line before aiming for the 120.00 level.
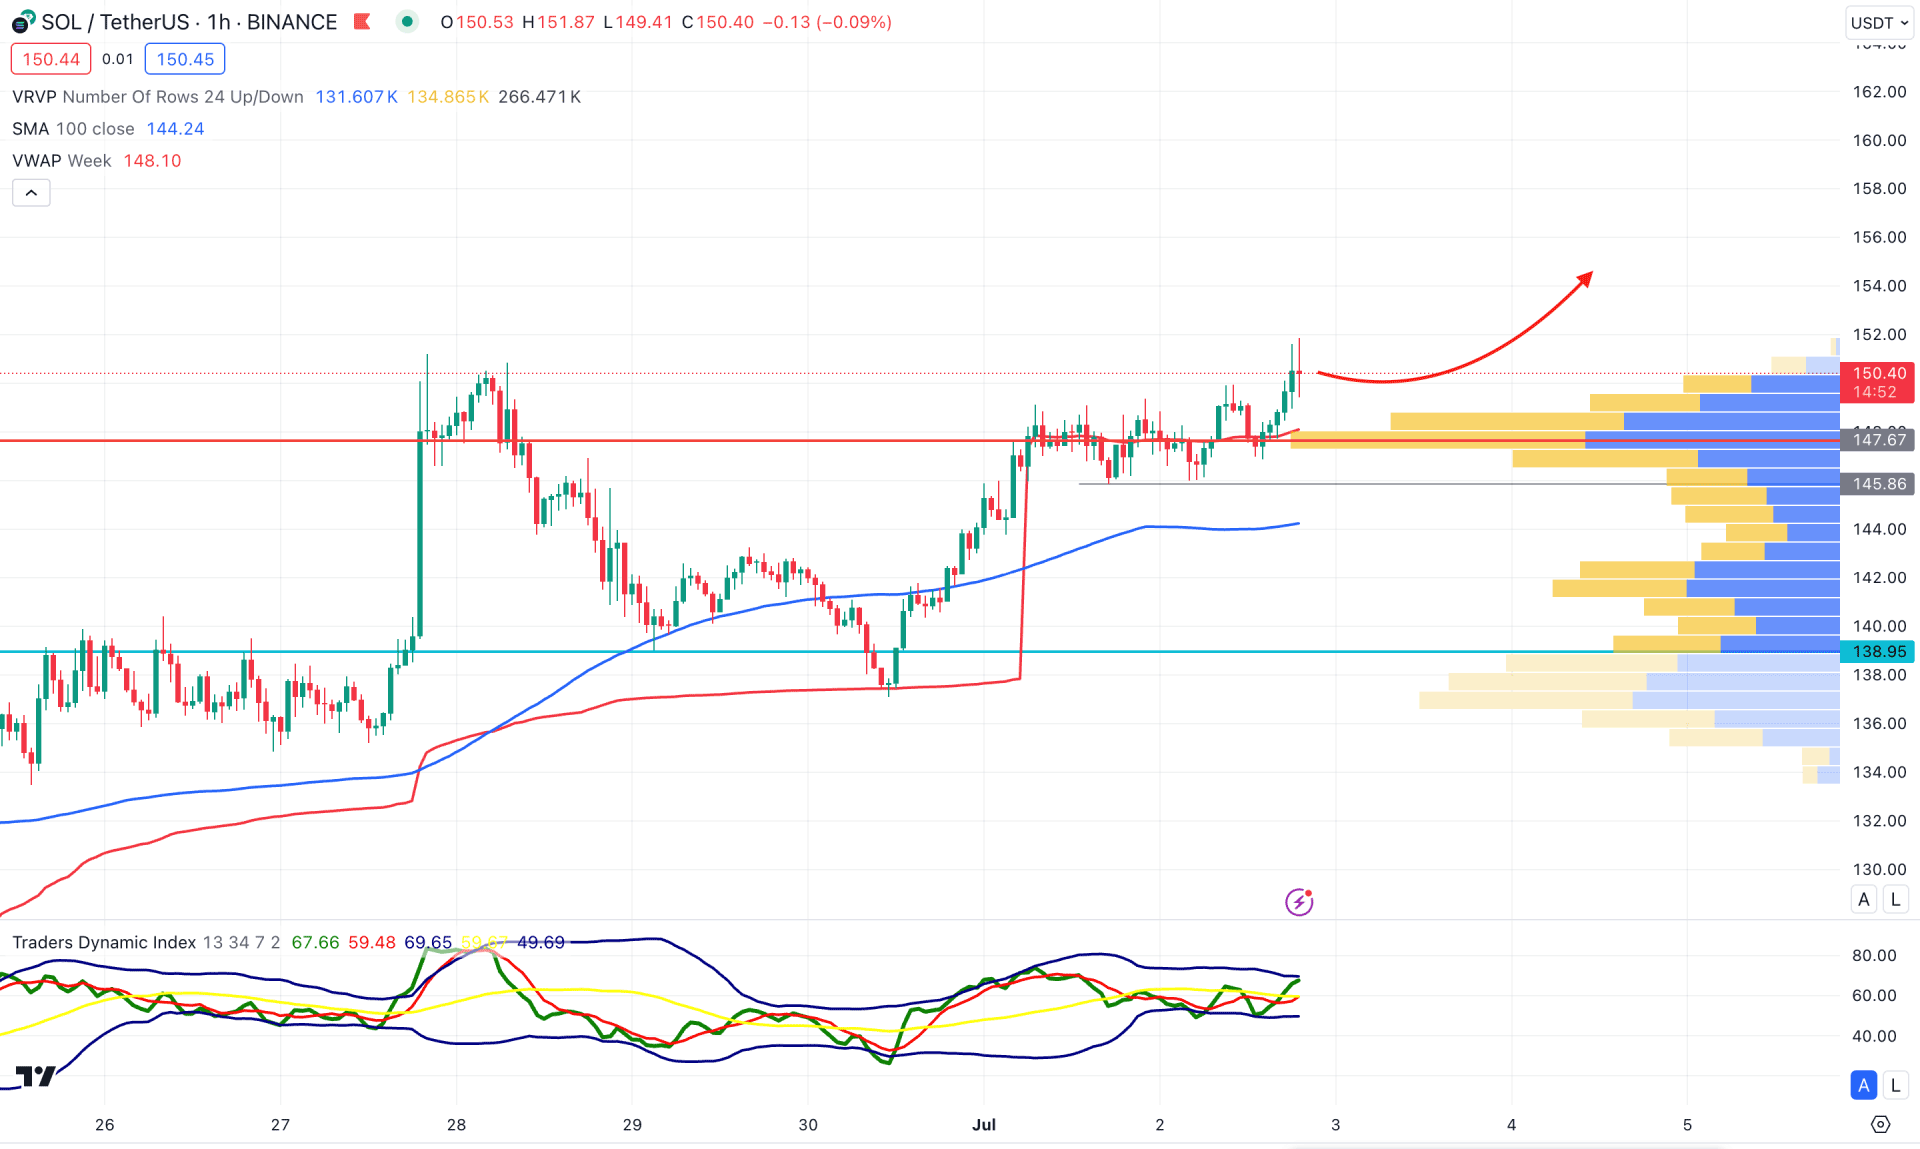
In the hourly chart of SOL/USDT, the buying pressure is potent as the current price is trading above the visible range high volume level. It is a sign so that institutional investors hold the position, which might work as a primary bullish signal.
In the broader structure, the 100 Simple Moving Average is below the current price, suggesting an upward continuation. Moreover, the weekly VWAP level is also below the current price and acting as an immediate support.
The indicator window tells the same story, where the MACD Histogram is above the neutral line, suggesting buyers are present in the market.
Based on the hourly projection, the price has a higher possibility of extending the buying pressure after completing the downward connection. Investors might find an opportunity to add more positions once the price shows a bullish reversal from the 150.00 to 146.00 zone.
Based on the ongoing market outlook, SOL/USDT is more likely to extend the buying pressure, where the most reliable signal might come from the valid pennant breakout. As of now, the ongoing intraday buying pressure might correct lower before forming a bullish signal.


