
Published: April 3rd, 2024
SoFi, a prominent entity in the fintech industry, is preparing to disclose its first-quarter earnings report on April 29 while anticipating a substantial trial. Amid increasing skepticism among Wall Street analysts concerning the company’s future prospects, this development transpires. SOFI stock has witnessed a year-to-date (YTD) decline exceeding 25%, notwithstanding its appeal to retail investors.
Regarding revenue projections, eight analysts anticipate a mean of $554.31 million, ranging from a minimum of $529.73 million to a maximum of $593 million. Comparable quarters ago, SoFi disclosed earnings amounting to $460.16 million. Meeting the consensus estimate for the first quarter of 2024 would indicate a year-over-year (YOY) company expansion of 20.5%.
SOFI stock is fundamentally exposed to increasing pressure due to the expansion of competitors' product lines. It is worth mentioning that Robinhood has recently made its entry into the credit card industry, introducing appealing attributes, including a 3% cash-back rate on all purchases.
Let’s see the upcoming price direction of this stock from the SOFI technical analysis:
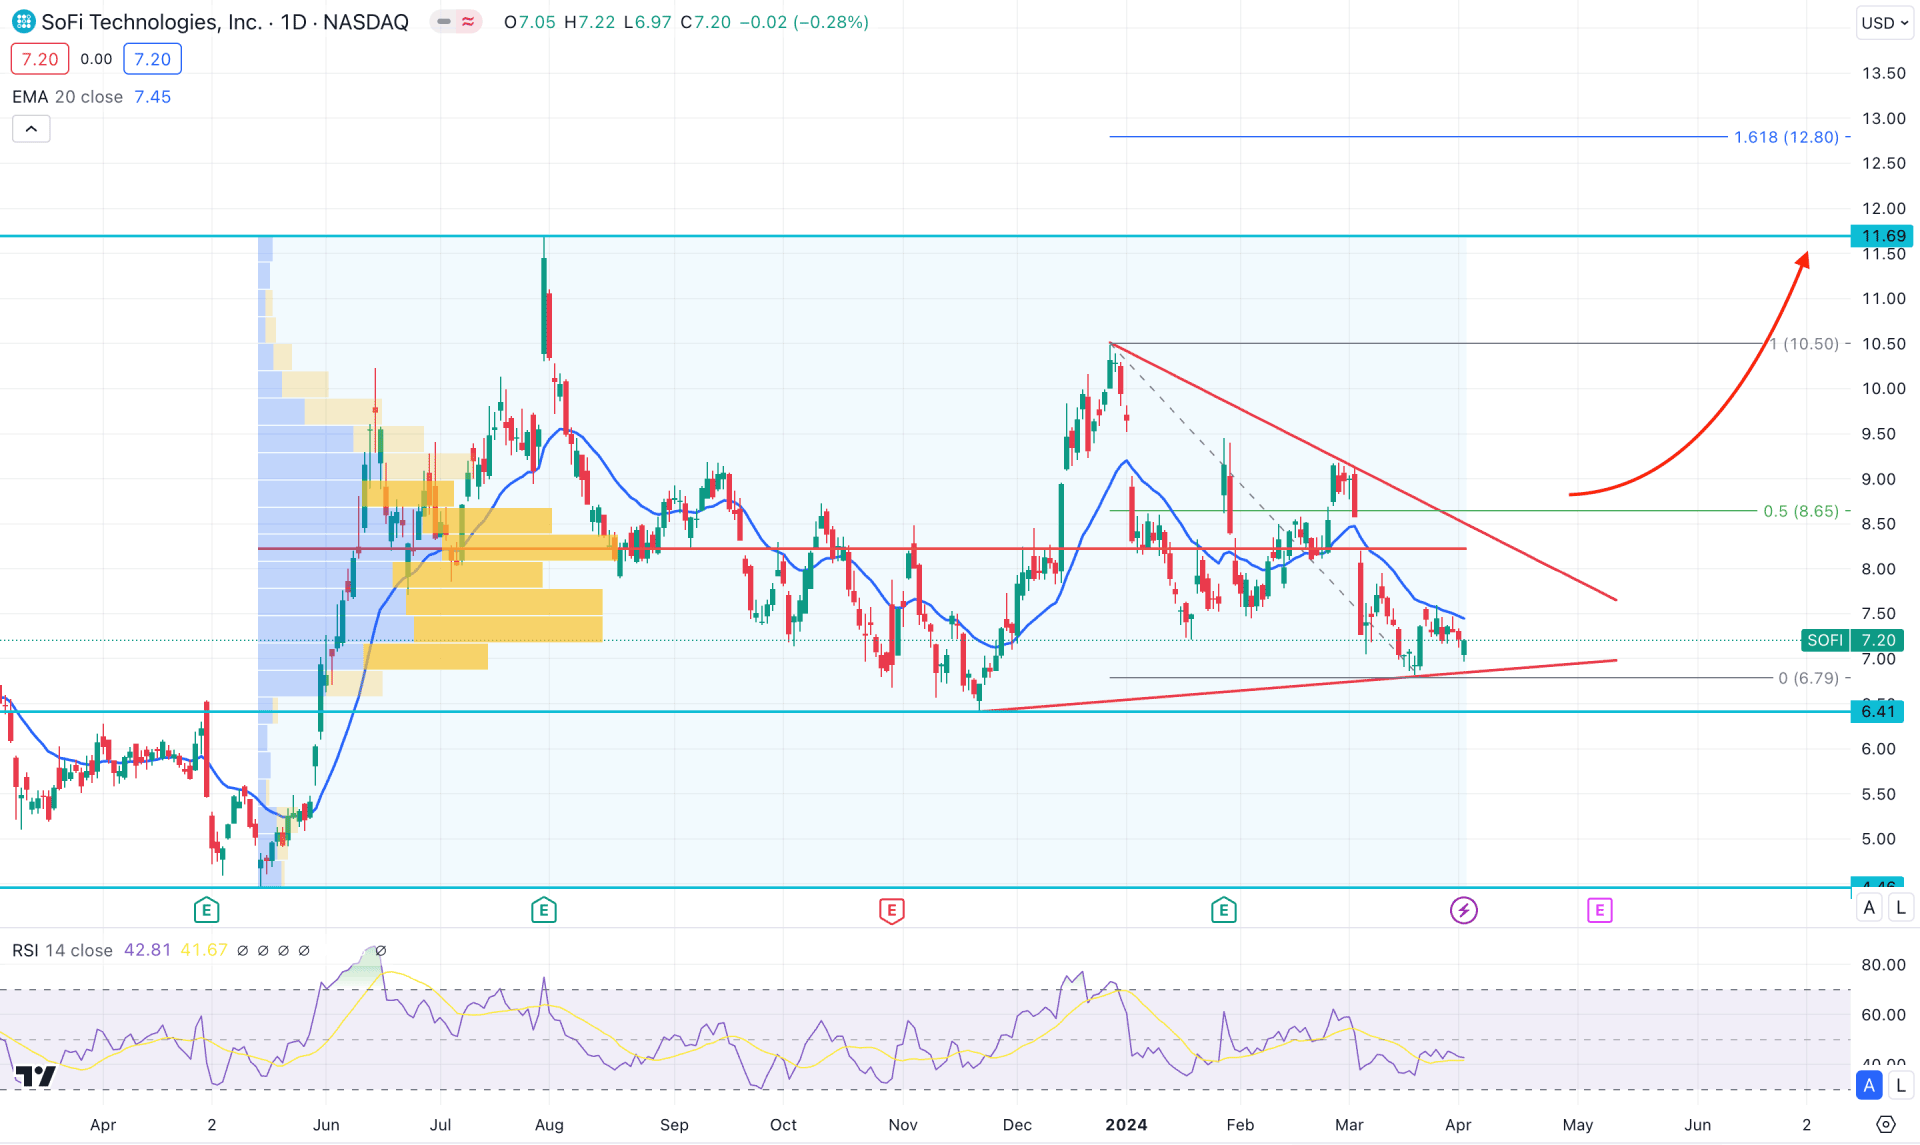
In the daily chart of SOFI, the recent price shows a bearish momentum from the 10.50 top. As the recent price trades at the discounted zone from the 4.46 low to the 11.69 high, which suggests a cheaper price for bulls.
Recent candles suggest an extreme correction in the higher timeframe, from where a breakout could signal a trend trading opportunity. The weekly price suggests a bearish pressure as the last two candles are indecisive after a bearish wave.
In the volume structure, downside pressure is also visible as the most active level since 2 April 2023 is at 8.23 level, which is above the current price. Therefore, a bullish signal might come after having a valid price action above this line.
In the daily price, the dynamic 20 EMA is above the current price, while the 14-day Relative Strength Index (RSI) hovers below the 50.00 line.
Based on the daily outlook of SOFI, a bullish breakout is potent from the symmetrical triangle formation, where a daily candle above the 8.65 line could signal a potential long opportunity, targeting the 10.50 resistance level.
The alternative trading approach is to find an immediate selling pressure below the 6.79 key support level. A daily close below this level with a redistribution could signal a bearish continuation, targeting the 4.46 level.
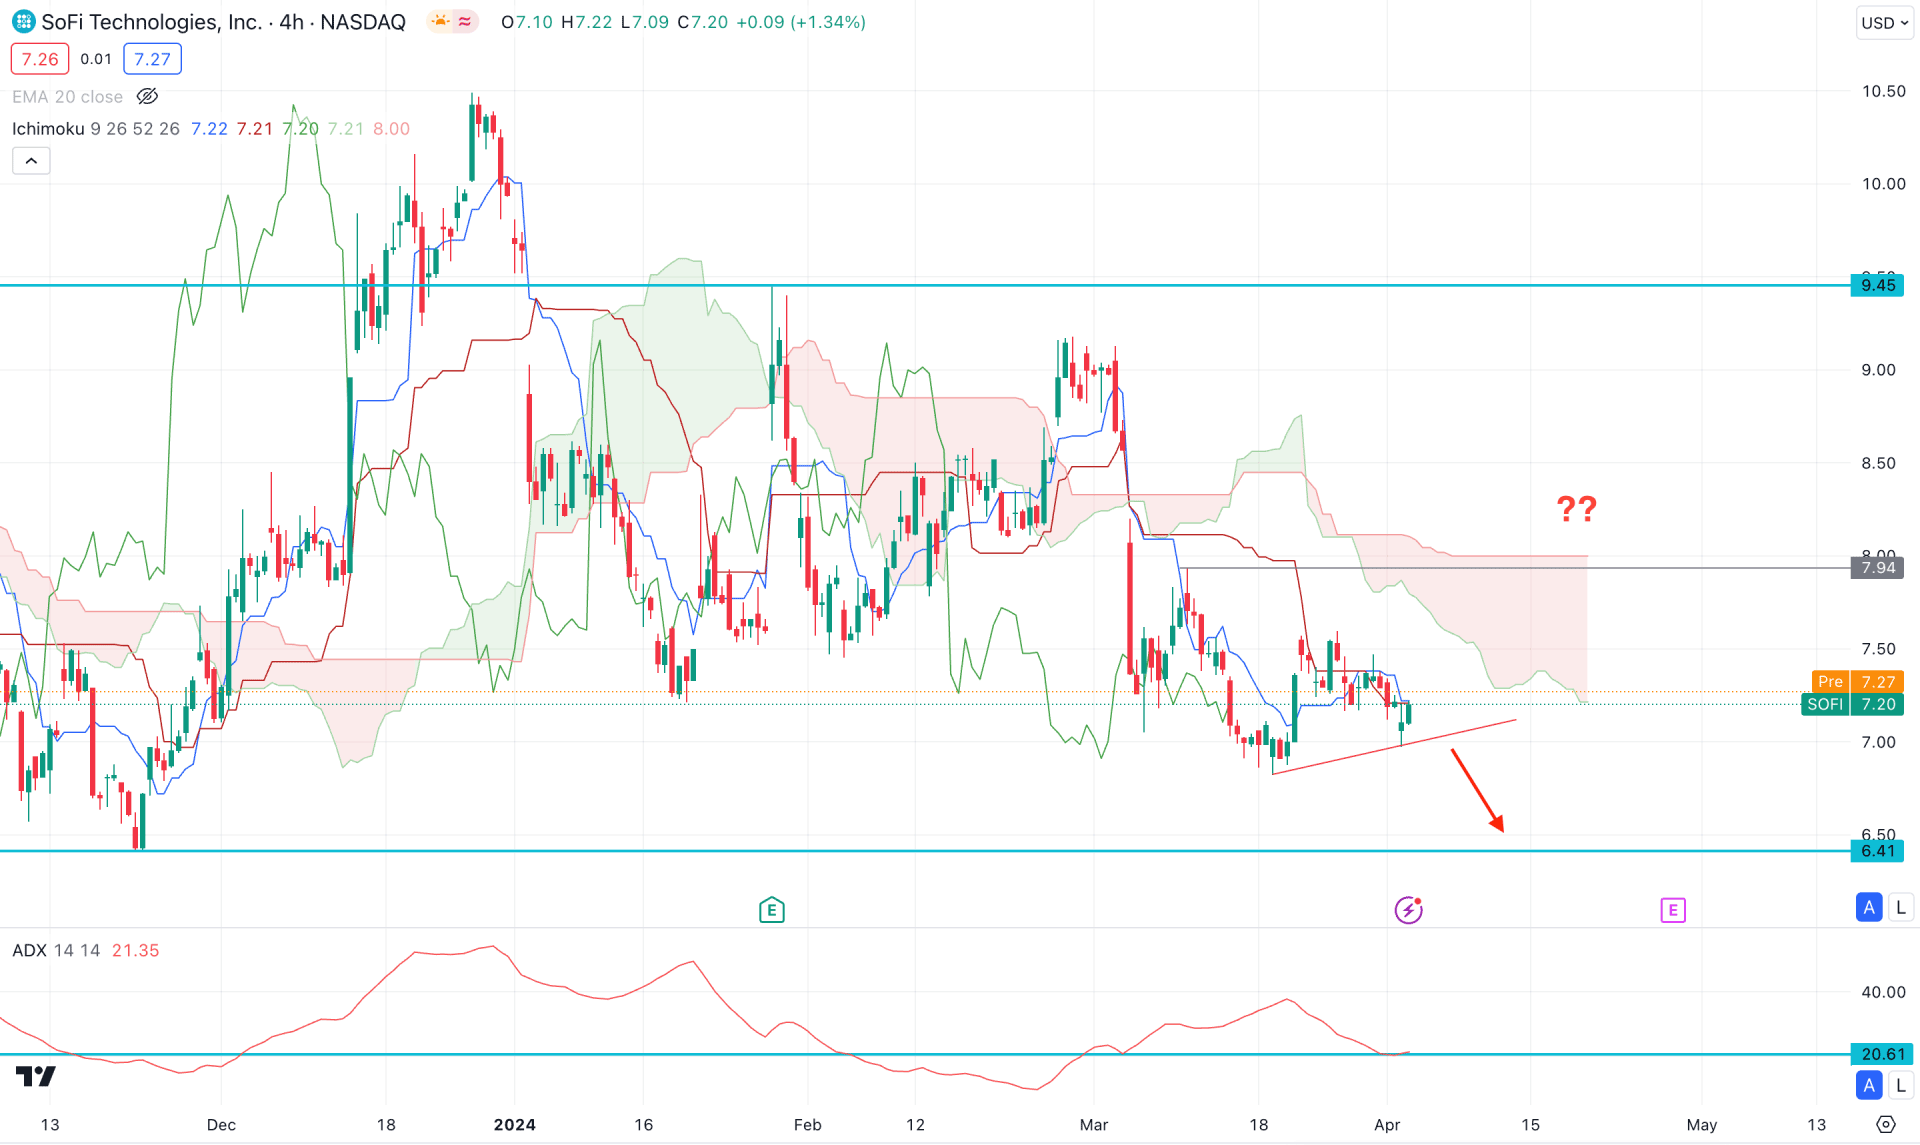
In the H4 timeframe, ongoing selling pressure is visible, where the recent price trades sideways at the trendline support. Moreover, the thickness of the future cloud suggests a strong bearish trend, where the Senkou Span A shows a downside pressure below the Senkou Span B.
In the secondary indicator window, the Average Directional Index (ADX) suggests a corrective trend, as the recent reading is at the 20.00 line.
Based on the H4 outlook, a bullish reversal with an H4 close above the 7.94 static level could offer a high probability of a long opportunity, which could signal a possible trend change.
On the other hand, a bearish continuation is possible, where a bearish break below the trendline support could resume the existing trend, targeting the 6.00 level.
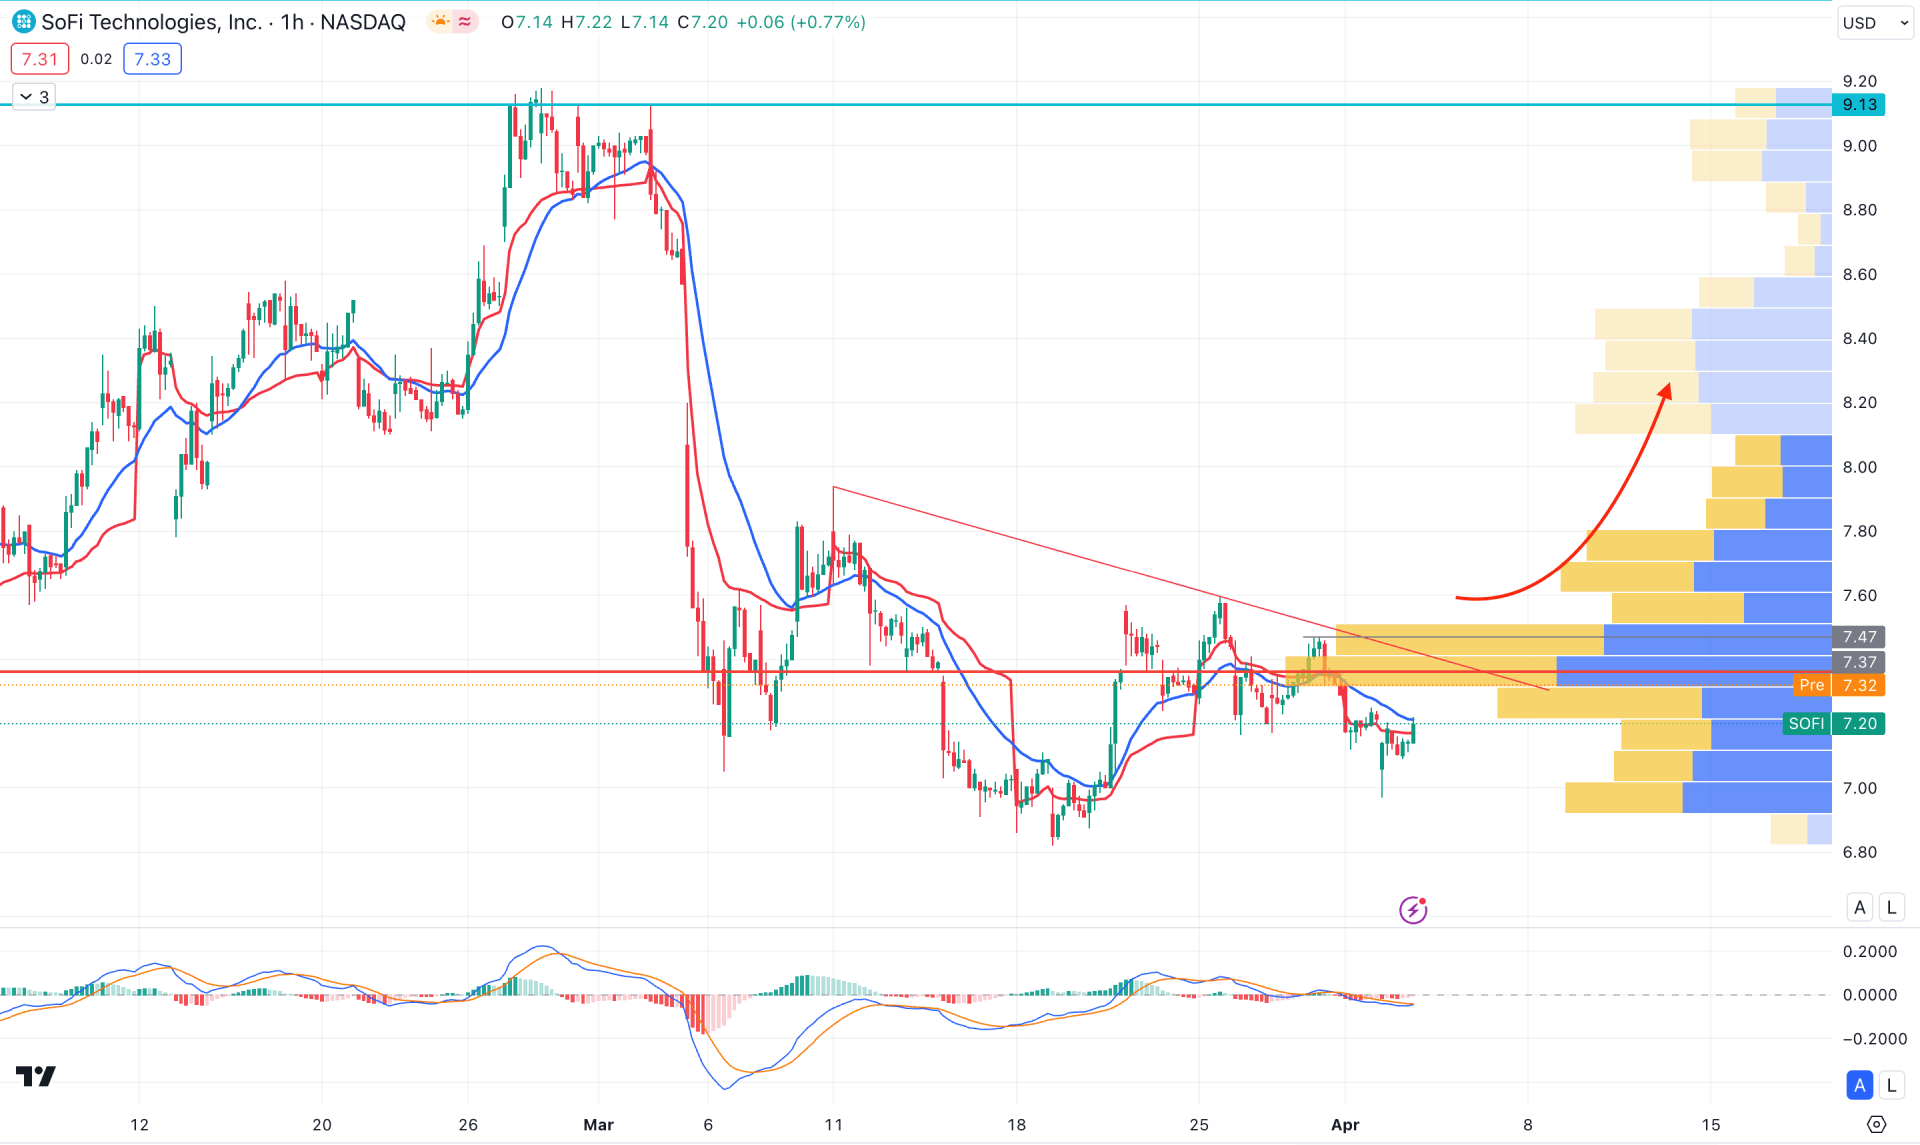
In the H1 timeframe, the recent price consolidated below the visible range high volume level, suggesting an ongoing selling pressure in the intraday chart. Moreover, the dynamic 20 EMA is above the current price, suggesting a confluence to bears.
In the indicator window, the MACD Histogram remains closer to the neutral level for a considerable time. It is a sign that corrective market pressure is visible, with no sign of a bottom formation.
Based on the H1 outlook, a trendline resistance is visible, where a bullish breakout above the 7.47 level could be an early signal of a trend reversal. However, a downside continuation is possible as long as the price remains below the 7.37 high volume level. In that case, an immediate selling pressure could resume the market momentum towards the 6.47 support level.
Based on the current multi-timeframe analysis, SoFi Stock (SOFI) bulls could initiate from the daily triangle breakout. Analysts have already provided an optimistic outlook about this stock, where an upbeat result in the forthcoming earnings report could be a confluence of long signals of this stock.


