
Published: July 6th, 2022
Sofi provides a full-time financial service to young high-income individuals. High earners have a less probability of defaults on debt which may work as a positive factor for companies like Sofi.
Moreover, Sofi extends the credit limit to those who wouldn’t qualify. For example, a person with $150,000 in earnings might not qualify to borrow funds, but from Sofi, it is possible. The company's potential is that it focuses on a person's future potential rather than the current status.
That insight allowed the company to enter the world of finance. In terms of investment opportunities, this company also showed strength by generating a $732 million non-interest income in 2021. As a result, it became the 27th largest bank in the US. According to some analysts, the fair value of Sofi stock is 3X book or 200% up from the current level.
In Q1 of 2022, Sofi reported adjusted net revenue of $322 million, 49% up from the previous quarter. However, the company failed to achieve satisfactory earnings, and the Q1 report came at a $0.14 loss per share. On the other hand, new members and products showed signs of development by reaching 70% and 84%, consecutively.
Let’s see the future price direction from the Sofi Stock (SOFI) Technical analysis:
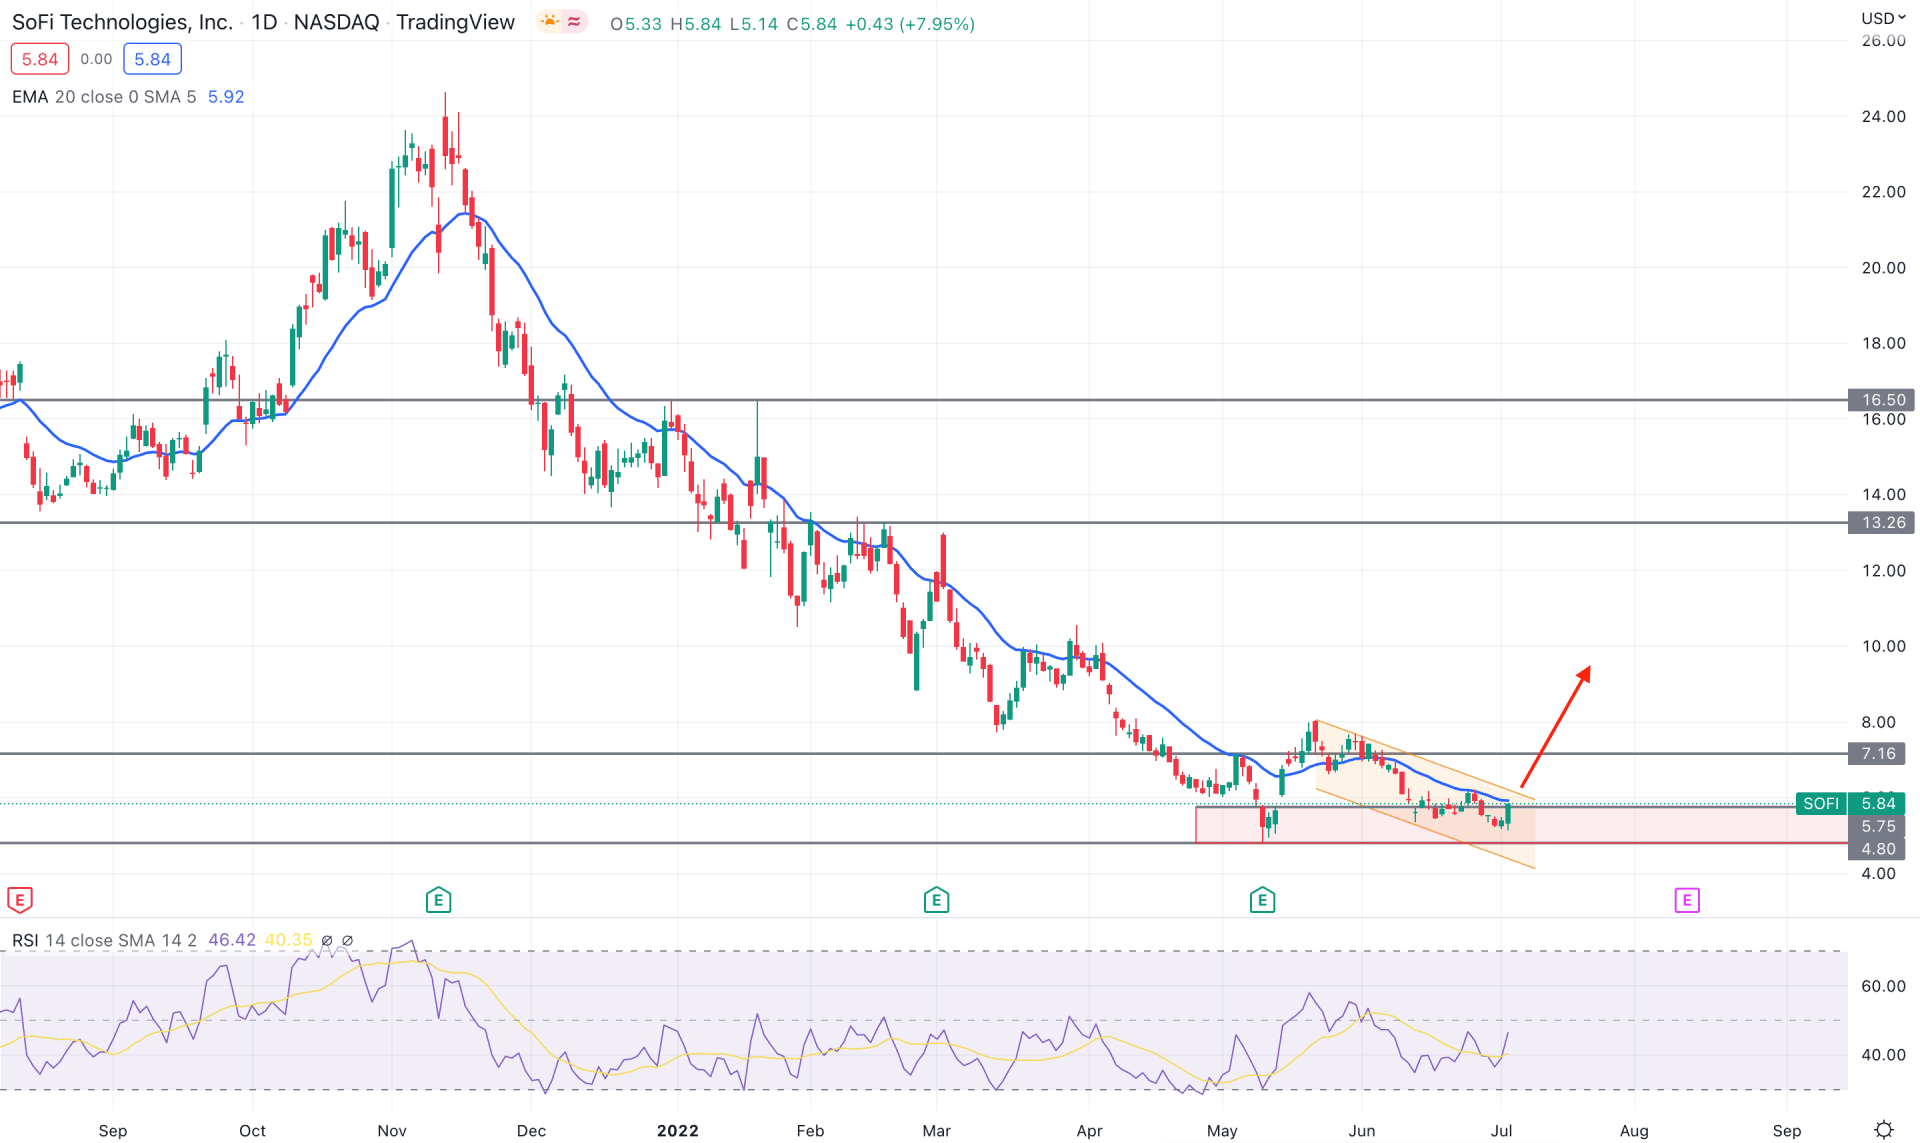
According to the daily chart, SOFI trades within a definite bearish trend followed by market sentiment coming from higher US inflation and Covid-19-driven economic disaster. However, the lower price with future potentiality is a good combination while buying a stock, which applies to Sofi.
Although the long-term market trend is bearish, the recent price showed buyers’ interest with a bullish CHoCH at the 7.16 level. Furthermore, the bullish structure break and daily candle above the 7.16 level made the 5.79 to 4.88 a valid demand zone. Therefore, any intense buying pressure in the intraday chart from daily demand would provide a decent bullish opportunity.
The above image shows how the selling pressure is weakening within the daily demand zone while the dynamic 20 EMA works as immediate resistance. In the indicator window, the Relative Strength Index (RSI) shows buyers' interest by forming a rebound towards the 50.00 neutral zone. Based on this structure, investors should wait for a bullish breakout from the descending channel with a daily close to set the bullish target toward the 13.26 resistance level.
The conservative approach is to wait for the price to break below the 4.80 level with a bearish daily candle to see further discounts towards the 3.00 level.
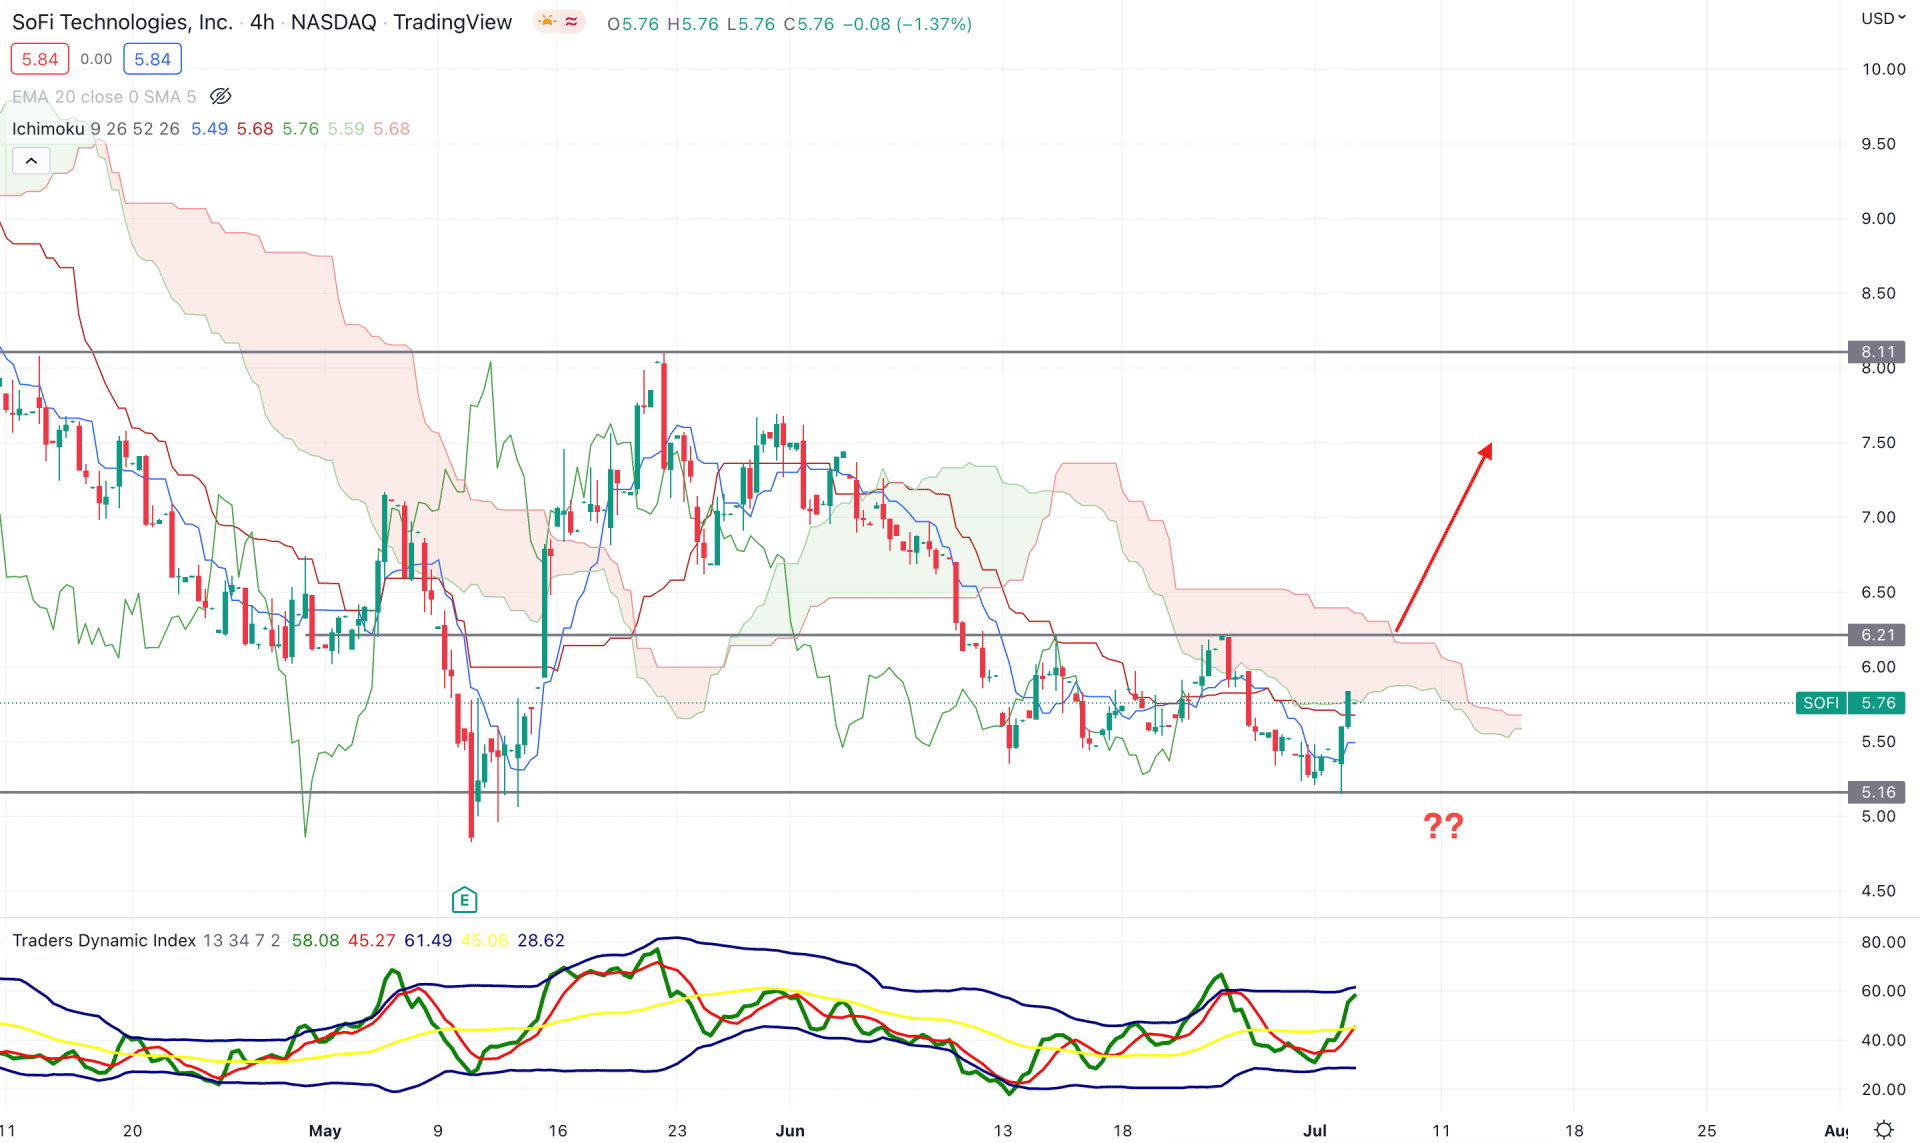
According to the H4 chart, the SOFI price is still within a bearish trend where the current price is trading below the Cloud resistance. However, the thickness of the future cloud is not weakening, indicating less pressure on the sellers’ side. Moreover, the recent bullish H4 candle moved above the dynamic Kijun Sen and closed within the cloud area. Therefore, investors should wait for the price to make another swing high above the cloud resistance to consider it a trend change.
In the indicator window, the buying pressure is solid, as shown by the Traders Dynamic Index indicator. The current TDI line is stable above the neutral 50 lines and has yet to test the overbought zone. The dynamic Tenkan Sen moved higher but still below the Kijun Sen line in the price chart. In that case, investors wait for the price to move above the Cloud resistance with a confirmation from the crossover in Tenkan and Kijun Sen.
Based on the current price action, the bullish trend must be confirmed by finding the price above the Kumo Cloud. In that case, the primary aim is to test the 8.11 resistance level in the coming days. On the other hand, a recovery below the Kijun Sen with an H4 candle close would be a selling opportunity towards the 4.00 level.
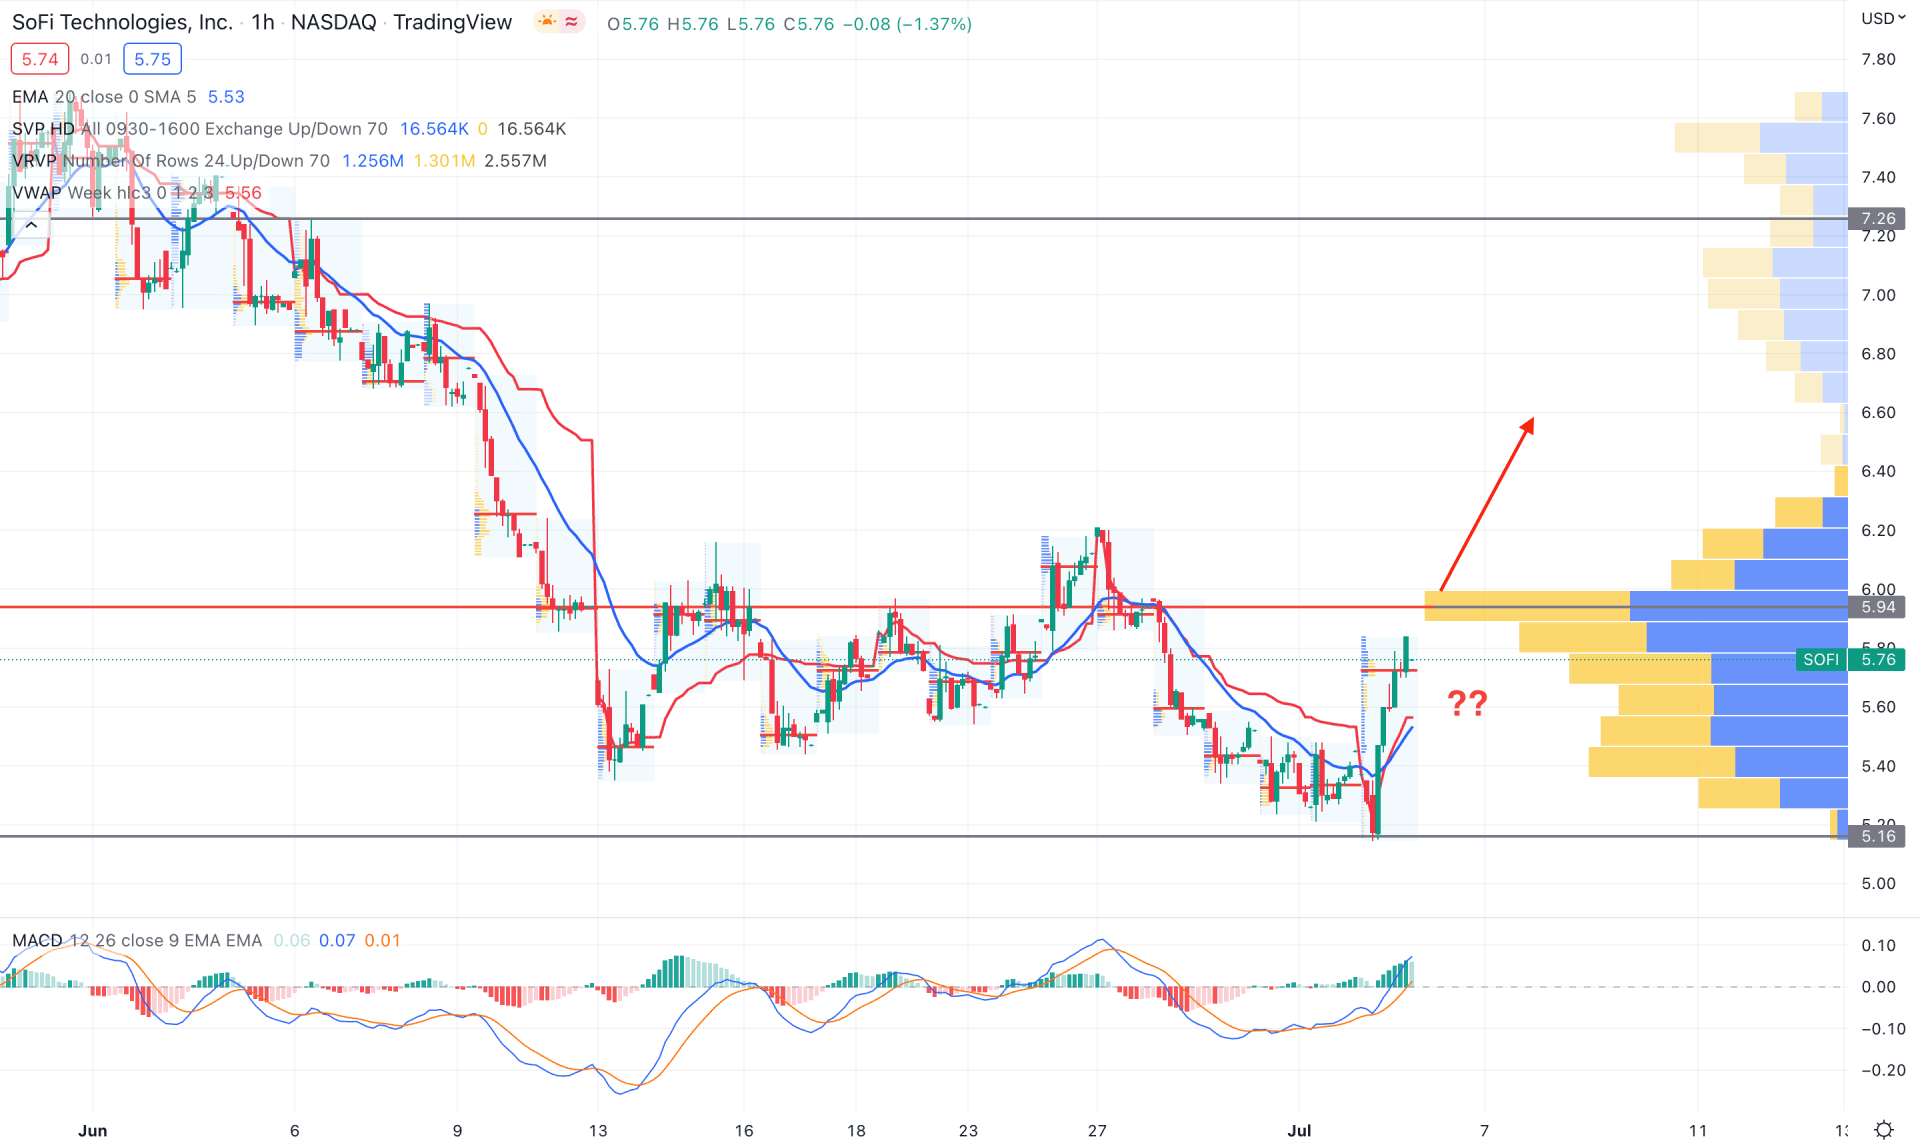
In the H1 chart, the market direction for the Sofi stock is bearish, while the recent recovery from the 5.16 level came with an impulsive bullish pressure. However, the buying pressure does not have volume support to recover above the 5.94 visible range high volume level. However, the latest intraday high volume level is below the price, showing buyers' interest.
In the indicator window, the MACD Histogram is steady bullish, followed by divergence with the price, indicating that the price formed a bottom. However, the trend change should be confirmed by recovering above the 5.94 level. The dynamic 20 EMA and weekly VWAP are also supportive for bulls as these lines are below the current price, moving upwards.
Based on the H1 structure, a failure to break above the 5.94 level with a bearish H1 candle below the dynamic VWAP would be a selling opportunity towards the 5.16 level. However, a decisive break above the 5.94 level with volume support would increase the possibility of the trend change where the main is to test the 7.28 resistance level.
Based on the current price action, Sofi stock is more likely to form a trend change where the descending channel breakout would provide a bullish opportunity. In that case, investors should monitor the intraday price action to find a reliable bullish opportunity above the H4 cloud resistance.