
Published: December 2nd, 2025
It is anticipated that Snowflake's fiscal third-quarter achievement represented a growing clientele propelled by robust AI capabilities and a diverse partner base.
Snowflake keeps profiting from excellent adoption and higher utilisation of its system, as indicated in its overall revenue retention percentage, which was 125% at the close of the second period of fiscal 2026. The company claimed a 19% year-over-year rise in the number of clients, hitting 12,062 in the reporting quarter.
At the conclusion of the fiscal second period, SNOW had 654 clients with trailing 12-month product sales higher than $1 million (increased by 27 percent year over year) and 751 Forbes Global 2000 users.
AI features from Snowflake, like Cortex AI and Snowflake Intelligence, are becoming more popular. Nearly fifty percent of new client logos in the following quarter of financial year 2026 were impacted by artificial intelligence, and 25% of operational use cases incorporated AI.
Snowflakes relationship with OpenAI, Microsoft Azure, and Anthropic is increasing its reach and strengthening its AI capabilities. In the subsequent quarter of fiscal 2026, Microsoft Azure grew by 40% year over year, making it Snowflake's most profitable cloud.
In November 2025, Snowflake launched an additional partnership with SAP to link Snowflake's Intelligence Data Cloud with SAP Business Data Cloud, which is another significant step to consider.
Let's see the complete price outlook from the SNOW technical analysis:
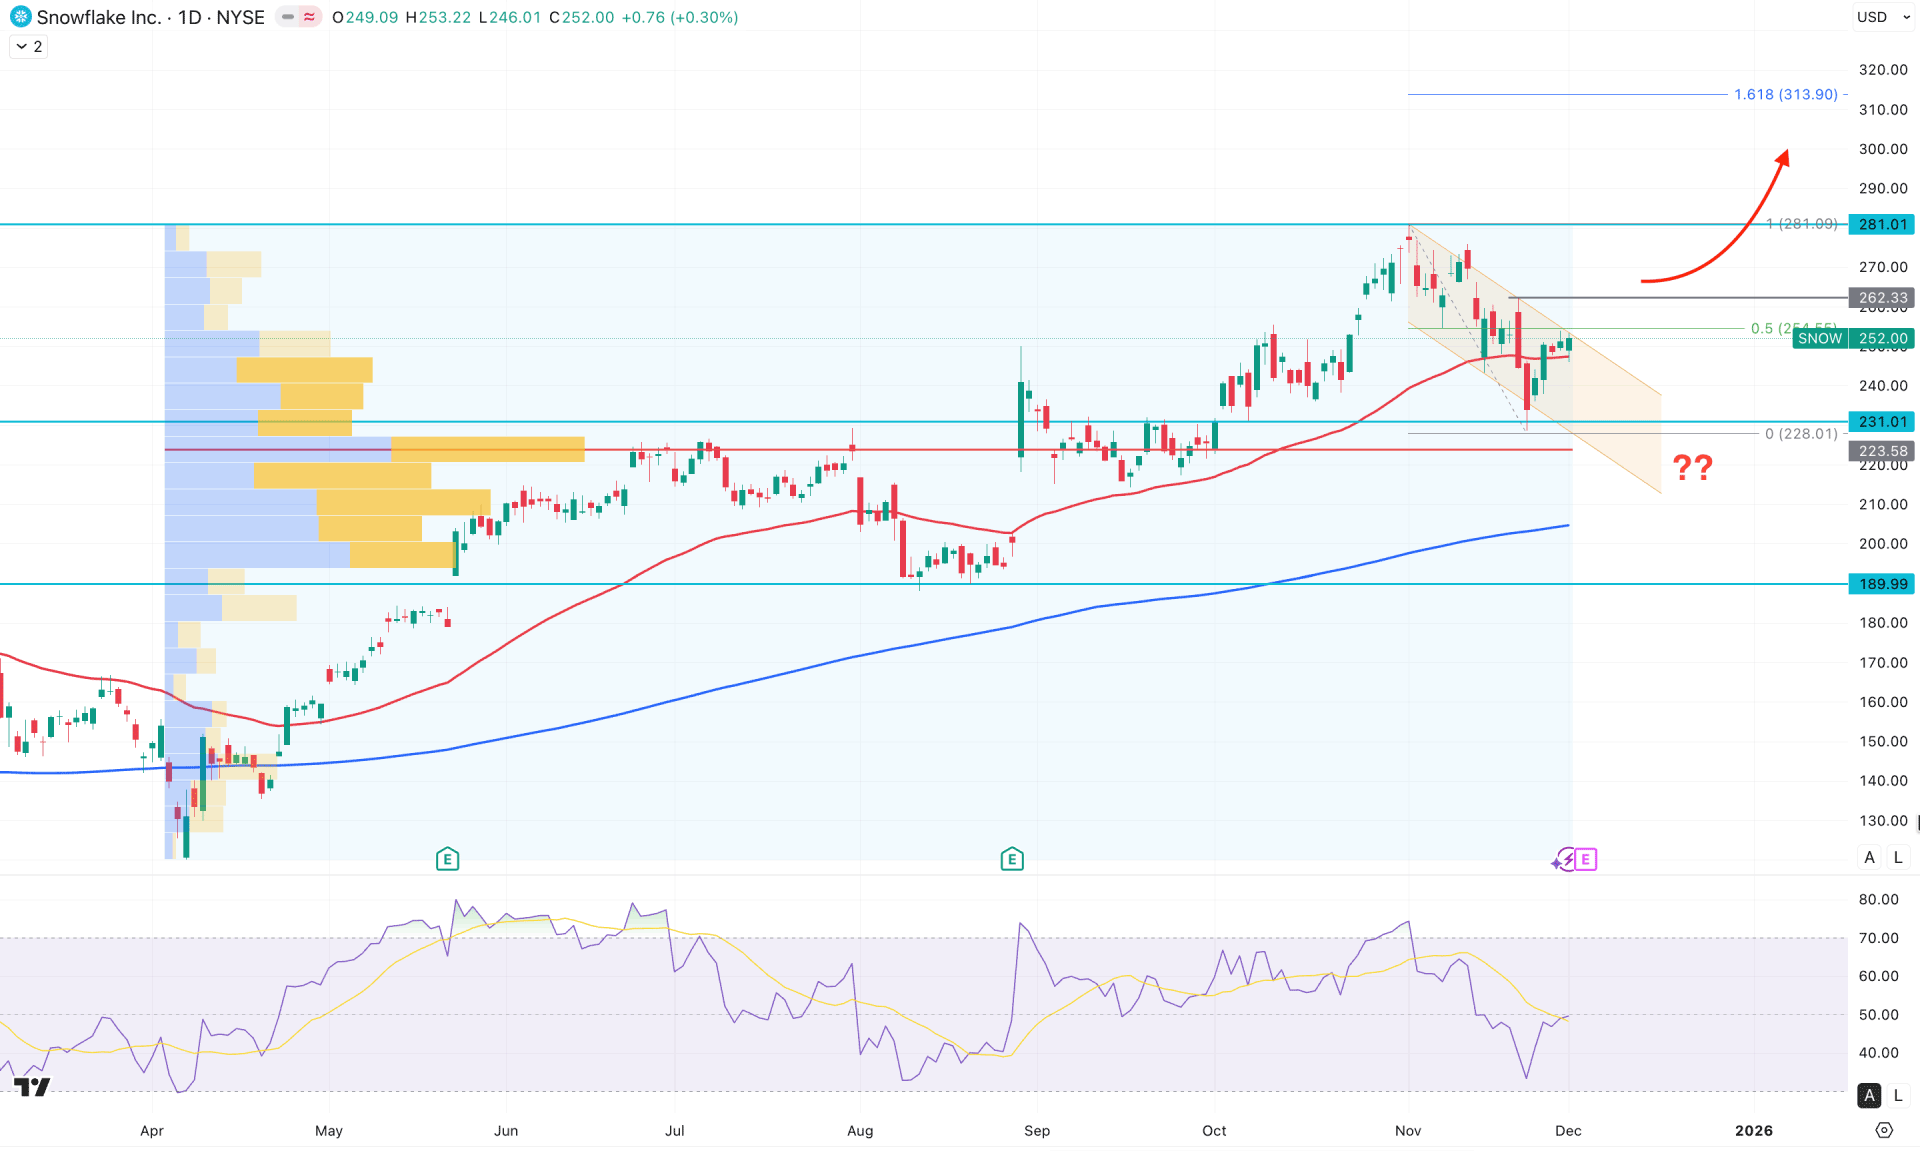
In the daily chart of SNOW, a prolonged bullish continuation is visible as the price keeps moving higher from the April 2025 bottom, with no sign of counter-bearish momentum. Meanwhile, the most recent price action is moving sideways within a channel, where a valid breakout could resume the broader market trend.
On the higher timeframe, the recent monthly candle closed as an inside bar, following a strong bullish close in October 2025. Since the price failed to break below the 223.11 monthly low, the major market trend remains in favor of buyers. The weekly timeframe also shows a valid bullish recovery from the 228.50 bottom, although more confirmation is needed before anticipating a continuation.
Looking at the volume structure, we can see active buying pressure in the market as strong bullish orders appear around the 223.50 VWAP level. As long as the current price hovers above the high-volume line, further bullish extension remains likely — even if a temporary downside correction appears.
In the daily market chart, the price is trading within a descending channel, where the most recent candles are facing a strong barrier at the channel resistance. A mild bearish pressure is possible as long as the price remains below this resistance.
On the other hand, the 200-day Simple Moving Average is positioned below the high-volume line and shows a bullish slope, which supports the major bullish trend. Moreover, bullish recovery signals from the 50-day Exponential Moving Average, along with multiple daily bullish candles, indicate short-term buying pressure.
In the secondary indicator window, the Relative Strength Index has found a bottom after rebounding from below the 50.00 line, signaling an early bullish recovery. However, as the RSI is still hovering at the neutral 50.00 area, more confirmation is required before expecting a strong continuation. Additionally, the Average Directional Index shows signs of trend-trading potential, as the current reading is still above the 20.00 threshold.
Based on the broader market outlook, a strong bullish rebound with a daily close above the 262.33 level could validate the channel breakout. In that scenario, the price could extend its upward pressure toward the 281.01 key resistance level, with an ultimate target at the 313.90 Fibonacci extension level before potentially moving toward the 366.99 area.
On the bearish side, immediate selling pressure is visible as the price struggles to break the channel resistance. If the price fails to overcome the 262.33 level and forms a bearish daily close below the 50 EMA, we may anticipate a range extension toward the 200-day Simple Moving Average.

In the four-hour timeframe, the most recent price is trading below the Kumo Cloud area, suggesting a potential downside continuation. Additionally, the future cloud signals a bearish flip, where Senkou Span B is positioned above Senkou Span A.
On the other hand, a solid bottom is visible in the indicator window, as the MACD signal line is showing a bullish crossover in the negative zone. Moreover, the histogram continues to rise, forming consecutive higher bars above the neutral line.
Based on this outlook, the downside momentum appears to have originated from a potential divergence at the top, where the primary expectation is a bearish continuation. In that case, a four-hour candle closing below the Tenkan-Sen level could increase the likelihood of a decline toward the 210.00 level.
On the other hand, an immediate bullish rebound — supported by a stable price above the cloud area — could resume the existing bullish trend at any time.
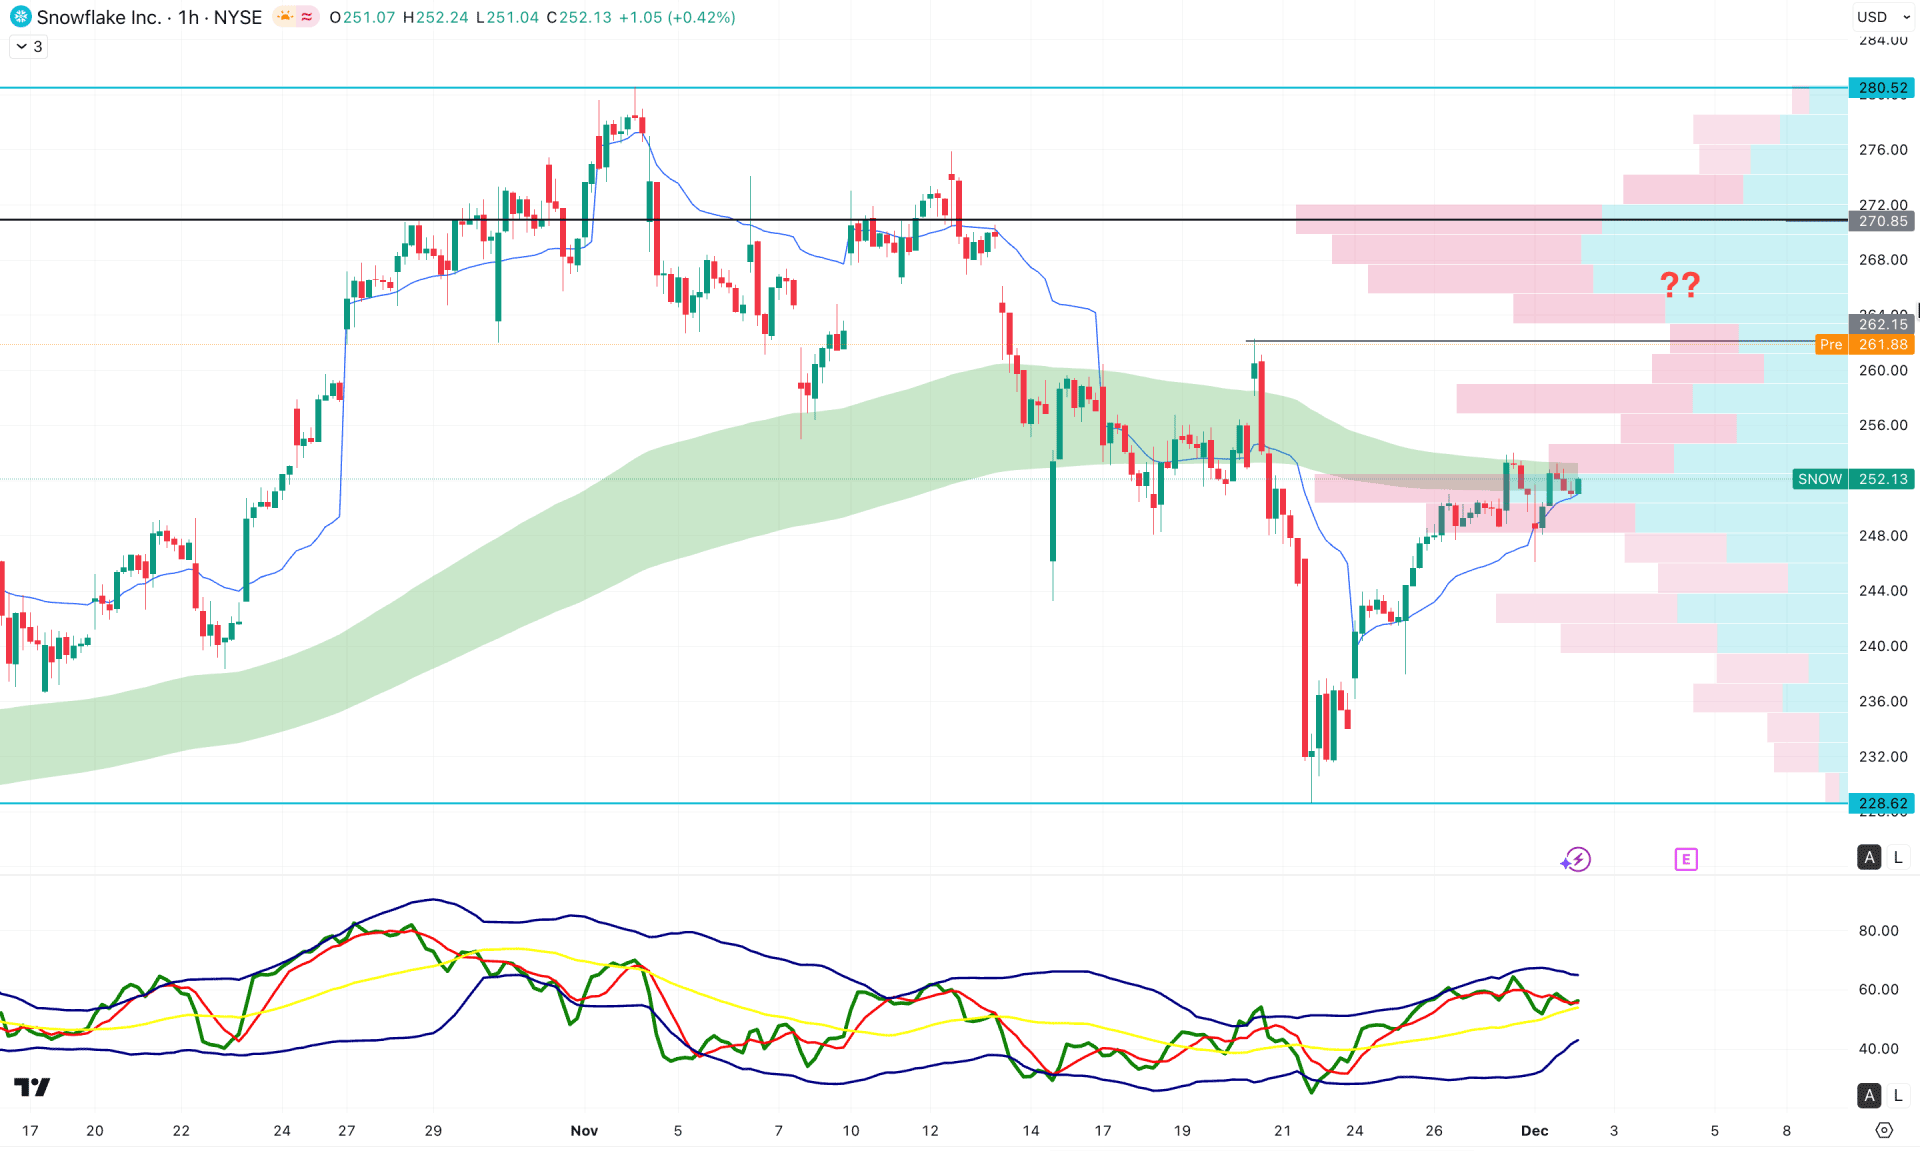
In the hourly timeframe, the current price is trading sideways, where a strong bullish rebound is present above the dynamic weekly VWAP line. However, the current price is facing strong resistance from the EMA wave, which needs to be overcome before confirming the bullish breakout.
On the other hand, the Traders Dynamic Index (TDI) is hovering in the premium zone, which signals an ongoing buying pressure.
Based on this outlook, further upside pressure with an hourly close above the 270.85 high-volume line could validate a bullish V-shape recovery, creating a long opportunity. However, as long as the high volume line is untouched, investors' sentiment will be towards the bearish side only.
Based on the above scenario, SNOW is trading within a strong bullish trend, where a valid bullish recovery could come once the downside pressure is over. As the current price is facing daily and intraday resistance at the top a valid bullish breakout is needed before anticipating a bullish pressure.


