
Published: December 13th, 2023
Snap Stock (SNAP) has increased by 39.38% over the previous month. The Computer and Technology sector and the S&P 500 experienced gains of 4.16% and 4.85%, respectively, during the corresponding time frame.
Investors are keeping a close eye on Snap's forthcoming earnings report, anticipating an EPS of $0.05, representing a decrease of 64.29% compared to the prior year. Analysts’ Consensus Estimates anticipate annual revenues of $4.6 billion and earnings per share of $0.05, reflecting decreases of -0.01% and -70.59%, respectively.
Recent revisions by analysts to Snap's projections underscore the fluidity of short-term business trends. Positive revisions indicate that analysts have faith in the profitability and operations of the company.
Regarding valuation, Snap is presently assessed at a premium to the industry average Forward P/E ratio of 37.51, with a Forward P/E ratio of 293.02.
SNAP also possesses a current PEG ratio of 21.23, considering the anticipated expansion of the company's earnings. The average PEG ratio for the Internet industry is 1.73 before the market closes.
Let’s see the future price direction of this stock from the SNAP technical analysis:
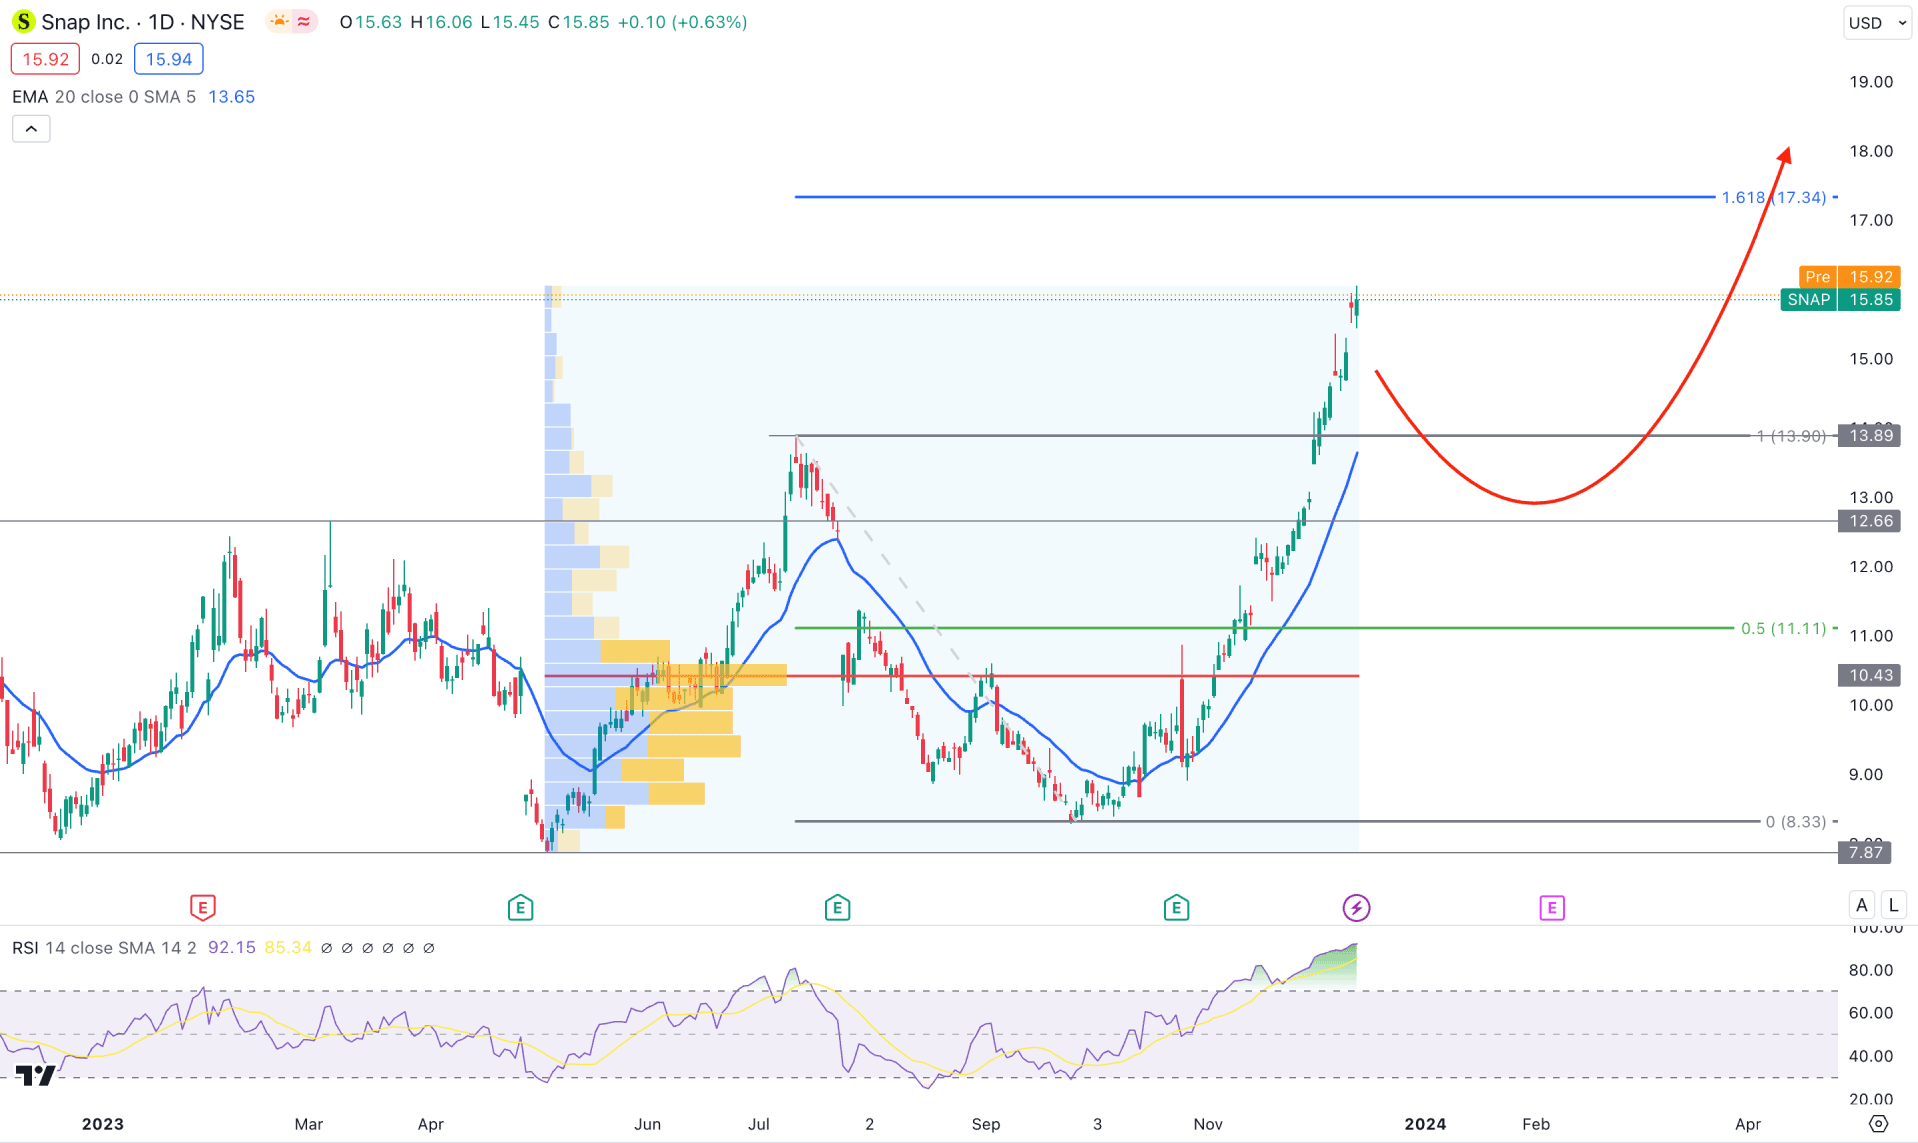
In the daily chart of SNAP, the recent price showed a strong bullish breakout, resulting in a proper change of character and correction. Therefore, as long as the current price holds the near-term swing low, we may expect bulls to expand the trend in the coming days.
As the SNAP stock remains at a record low, the possible bullish rebound should have a proper validation from the higher timeframe. In the monthly chart, three consecutive bullish candlesticks are seen, including the running candle of December. Currently, the price remains at the yearly, where a positive close in 2023 would be a remarkable sign of a long-term bull run. The weekly price shows the same story, where bulls hold the momentum above the consolidation area. In that case, downside correction is possible, opening an additional chance to go long in this stock.
For a considerable bearish momentum, investors should seek a high-volume formation at the top. As per the Fixed Range High Volume level indicator, the highest trading volume level since April 2023 is marked at the 10.43 level, which is below the current price. Therefore, as long as bulls hold the price above the high volume area, we may anticipate a continuation of the bullish trend in the coming days.
In the daily chart, the Relative Strength Index (RSI) showed an extremely bullish condition as the current reading is at the 92.00 level. However, the dynamic 20-day EMA is below the current price with an upward slope. Moreover, there is no sign of a divergence formation at the top, which could provide an early sign of a downside correction.
Based on the current daily outlook SNAP, a bullish trend continuation is potent, where an intraday bullish possibility could be an attractive opportunity for bulls. Primarily, the bullish target would be the 17.34 level, which is the crucial Fibonacci Extension level. Above this level, investors might anticipate the price for the 50.00 area.
On the bearish side, an immediate bearish recovery with a daily close below the 12.66 level could lower the price within the consolidation zone.
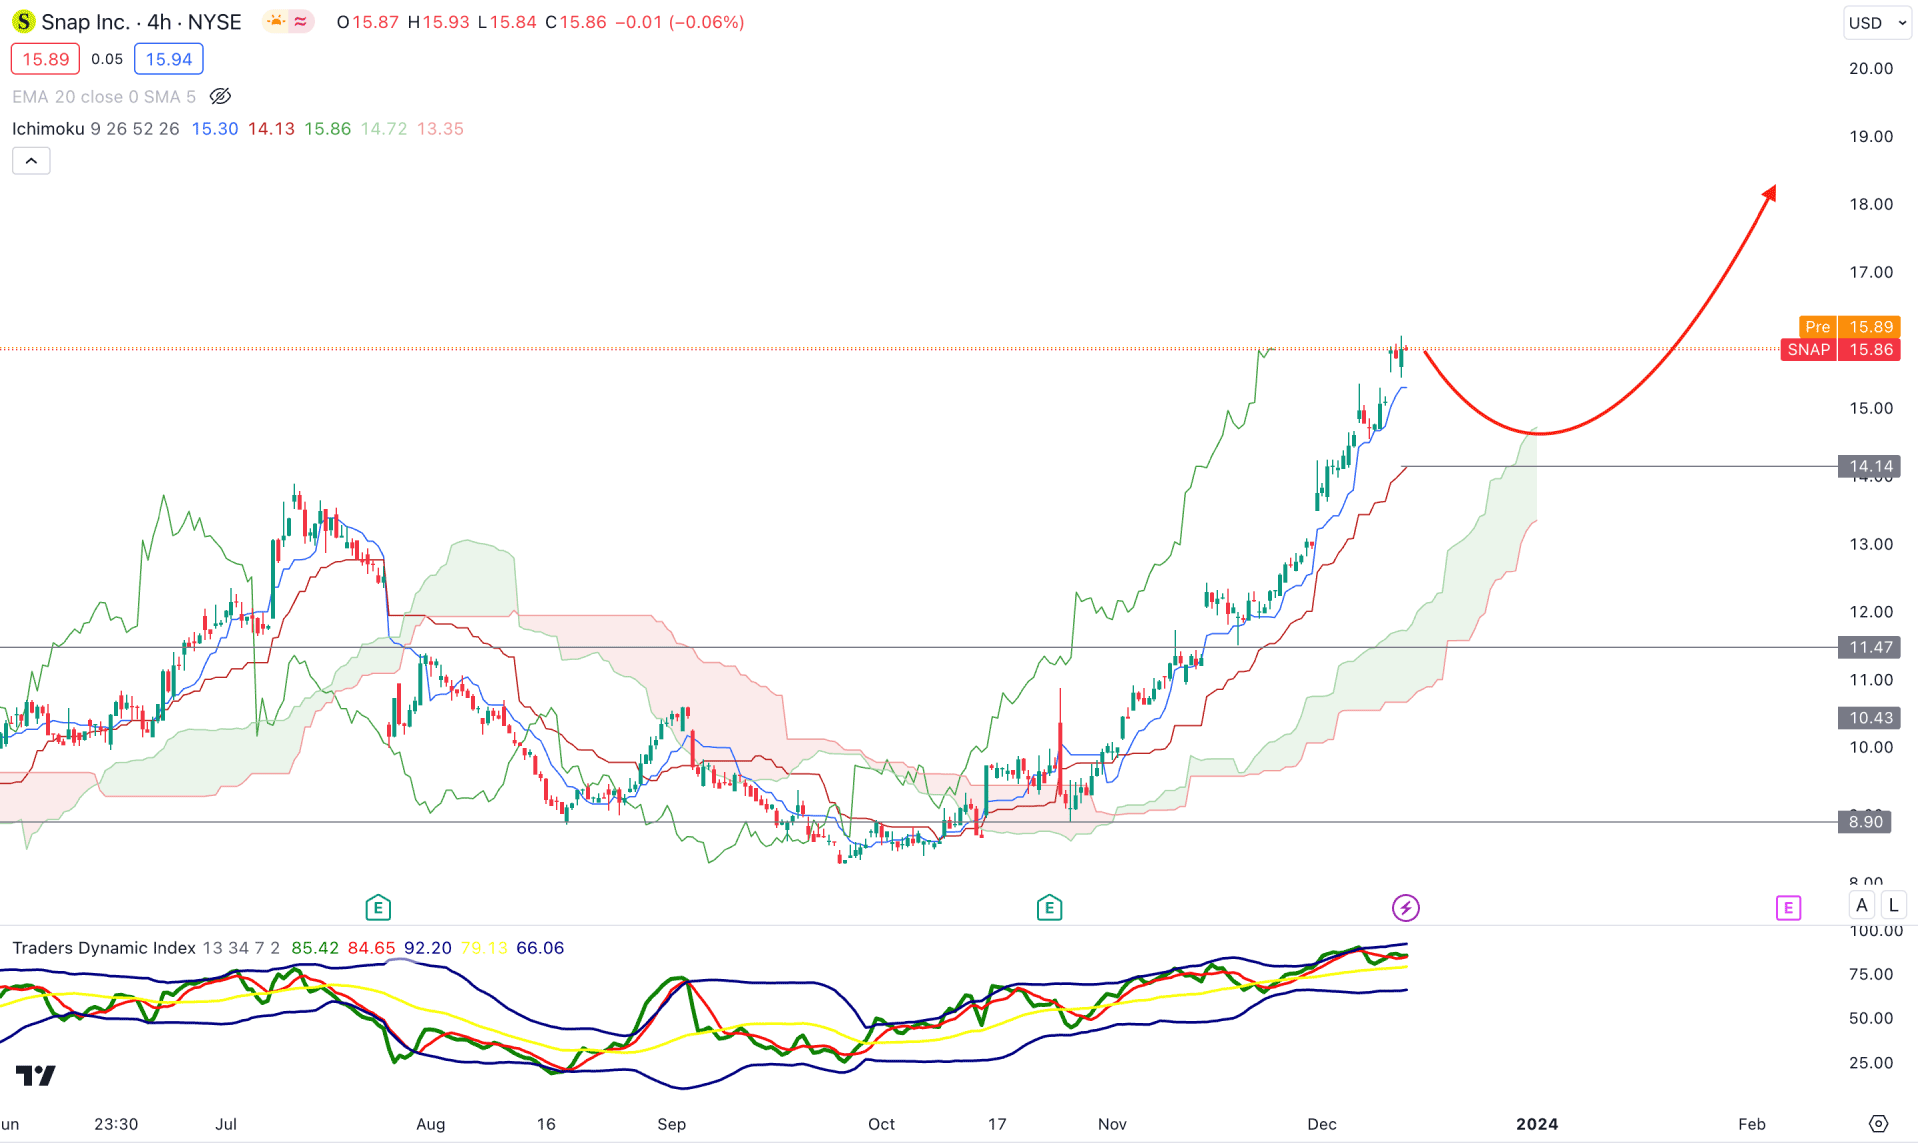
In the H4 timeframe, the overall market pressure is bullish as a stable market is visible above the dynamic Ichimoku Cloud area. Moreover, the Future cloud shows a bullish continuation as the Senkou Span A is above the Senkou Span B, which could work as a confluence bullish factor.
In the secondary window, the TDI seems stable above the 50.00 line, which indicates a stable bullish trend. In that case, investors might expect an upward continuation as long as the TDI level remains above the 50.00 line.
Based on the H4 chart, the existing bullish trend is more likely to form a continuation. However, a minor downside correction towards the dynamic Kijun Sen level is possible, but a bearish break below the 11.00 level could be an alarming sign to bulls.
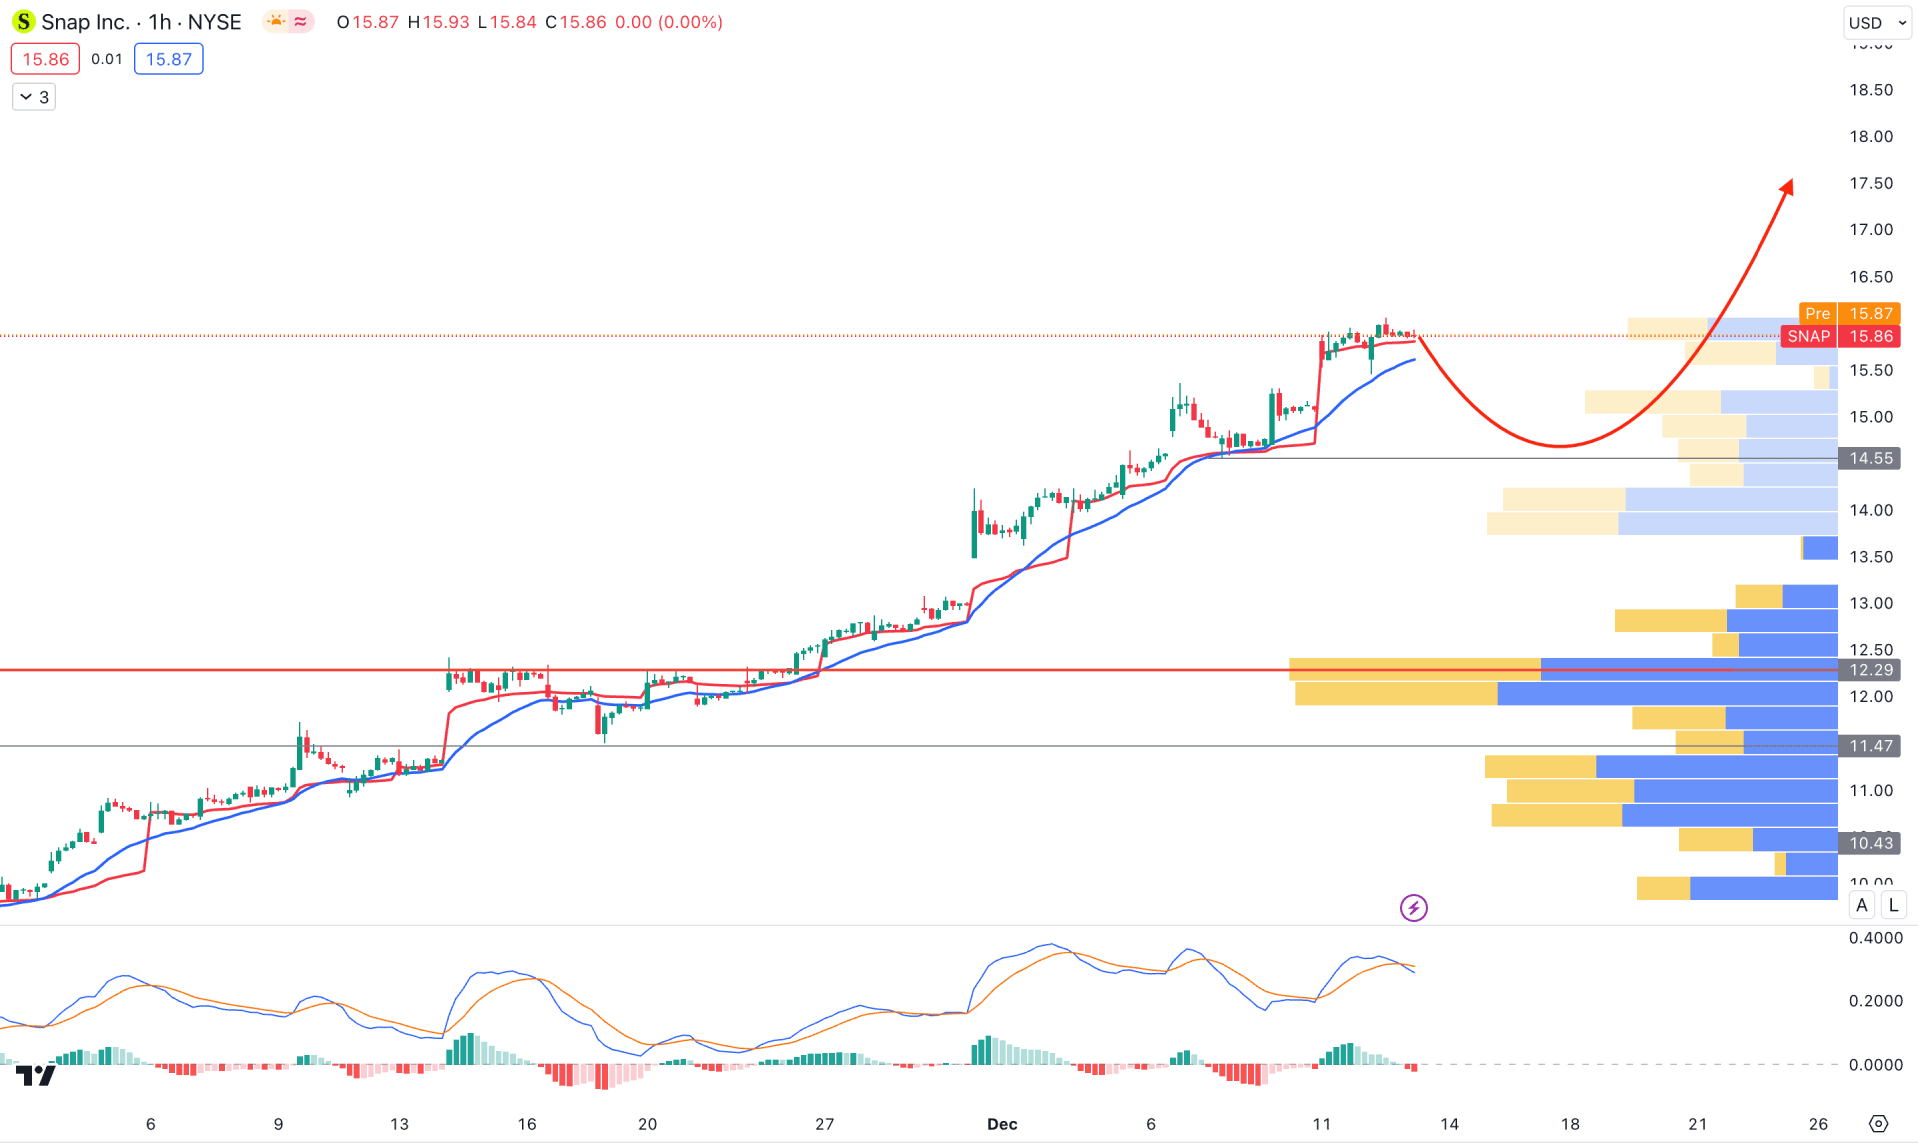
In the hourly chart, SNAP is trading within a bullish situation backed by a visible range of high volume levels below the current price.
However, the MACD Histogram reached below the neutral level, while the current Signal line is at the bullish zone.
Based on the hourly chart, a downside correction is possible towards the 14.55 level. However, a bullish continuation from the dynamic 20 EMA level could be a short-term long opportunity, targeting the 20.00 level.
Based on the current outlook, a long-term HODLing approach could grab buyers' attention in this stock from the extremely discounted price. Moreover, the intraday price moved up within an impulsive pressure, from where a bullish rejection could be a potential long opportunity.


