

Published: November 4th, 2026
Sky Ecosystem's October update highlights several key milestones, led by Q3 net revenue of $37.19 million.
The recap also features two credit assessments, confirmation of a second $SKY token burn, and continued engagement with institutional stakeholders across markets, including Singapore and CoinAlts. These developments underscore the ecosystem's financial progress and its efforts to strengthen institutional relationships.
October also saw further steps in the ecosystem's financial and strategic initiatives. Alongside the two credit assessments, the confirmed token burn reflects its ongoing approach to token management.
Meanwhile, discussions with institutional participants continue, signalling efforts to expand its presence and establish stronger connections within the financial sector.
As Sky Ecosystem advances its decentralised platform, these financial milestones and institutional engagements mark important progress in its broader development strategy. The latest update offers further insight into its financial position and evolving role in the digital asset landscape. For the full breakdown, refer to the official October recap.
Let's look at this token's further prospects through the SKY/USDT technical analysis:
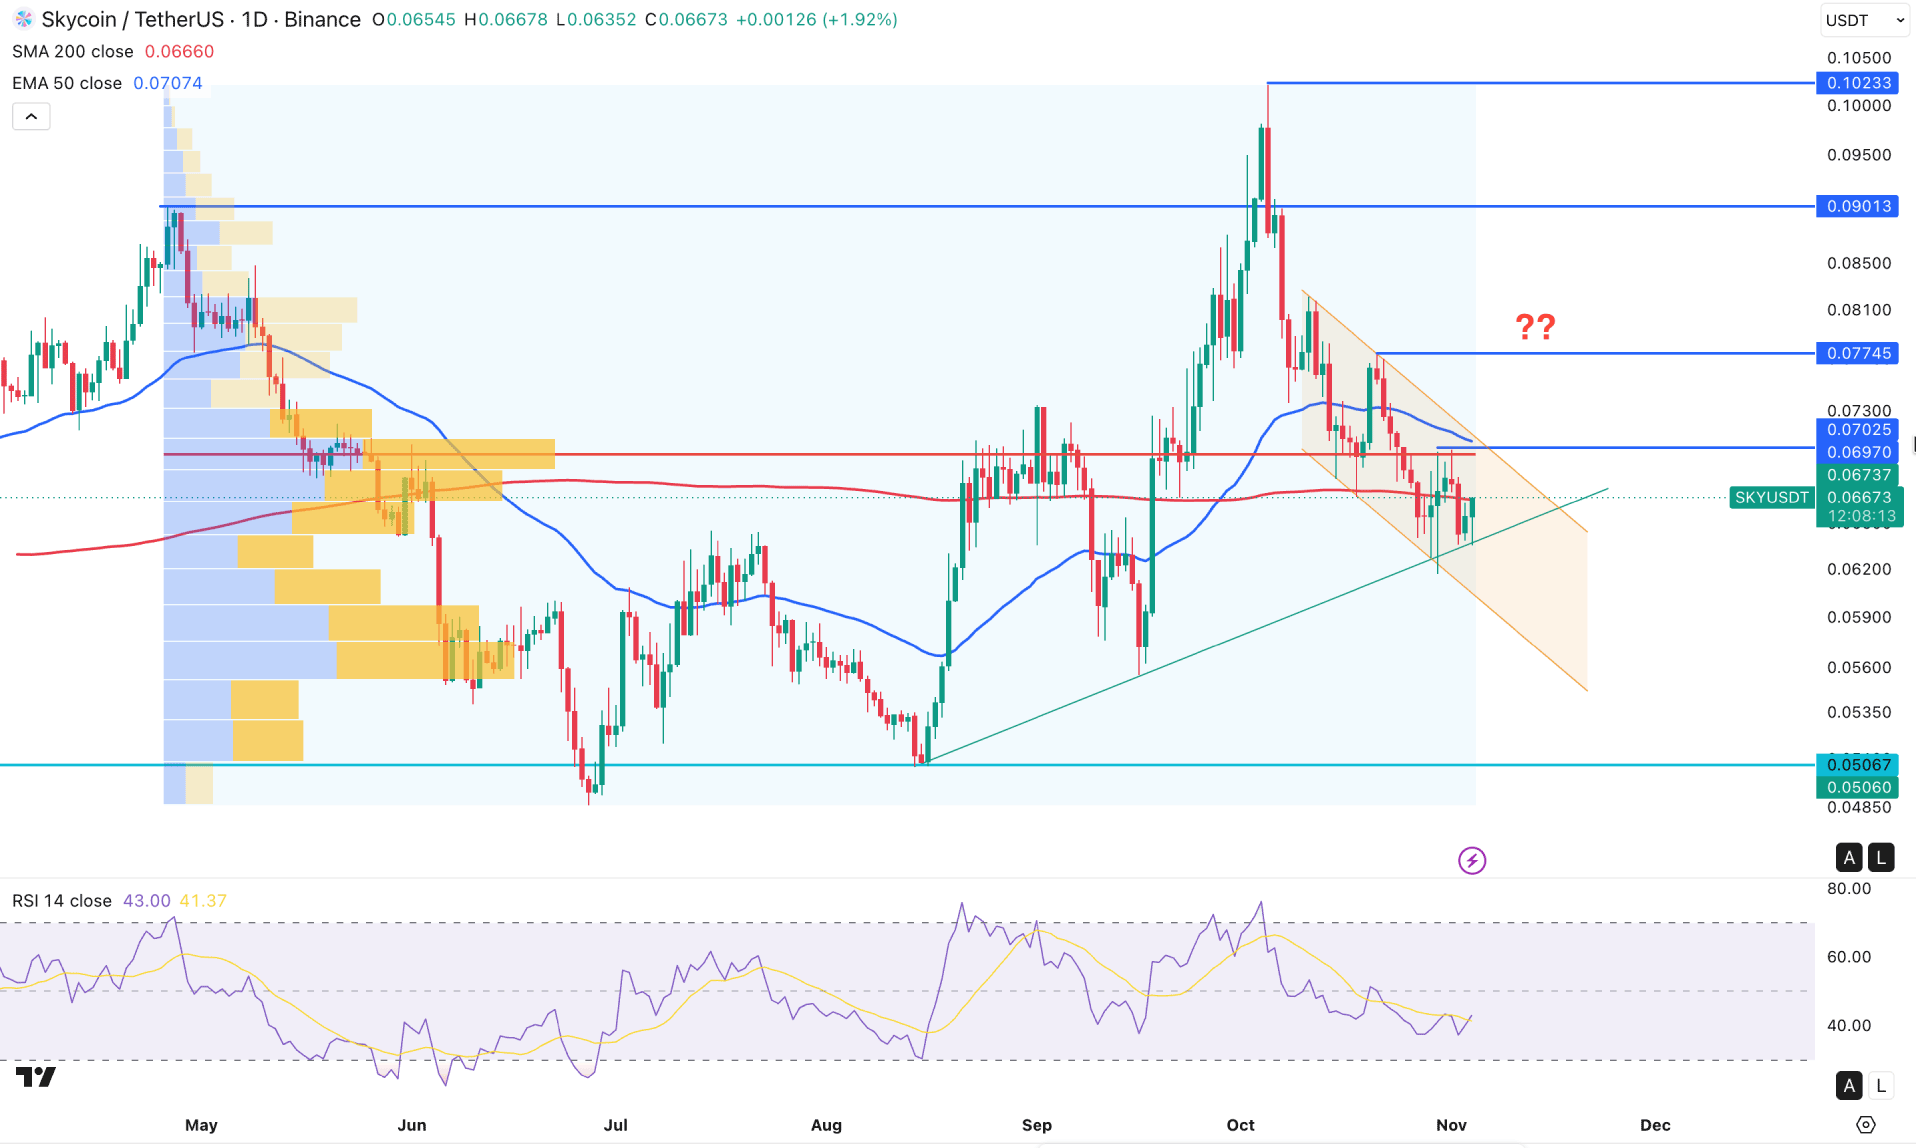
On the SKY/USDT daily chart, market momentum is sideways. However, price is trading within a bullish wave, and a rebound awaits confirmation.
The ongoing bearish pressure from the 0.1023 swing high came with a significant buy-side liquidity grab at the 0.0901 resistance level. Primarily it is a sign of a strong selling pressure in the market. However, after moving from the bullish peak area, price moved sideways, limiting selling pressure at the trendline support level. The monthly candle's position suggests strong pressure with a strong buy-side liquidity grab, while the weekly timeframe shows a volatile market structure.
On volume, price has been trading below the high-volume line since April 2026. This signals selling pressure, but the price action isn't strong enough to confirm a stable trend.
In the current tradable range, a new swing high at the 0.1023 level is a crucial point at the top, while the 0.0506 level is the bottom. Within this range, price is trading near the 50% Fibonacci retracement level with a corrective market structure.
As a result, multiple bearish candles are seen below the 50-day EMA, with at least three candles below the 200-day SMA.
In the secondary indicator, the Relative Strength Index remains sideways just below the 50.00 neutral level, signalling neutral-to-bearish sideways momentum.
Based on this outlook, momentum remains bearish as long as price stays below the descending channel resistance.
On the bearish side, the immediate swing high to watch is 0.0697, as sufficient liquidity could be present above this level. In that case, a bullish recovery above the 50-day EMA with immediate bearish pressure below the trendline resistance would be a high-probability short opportunity targeting the 0.0530 level.
On the other hand, the strong resistance level that would invalidate the bearish structure is 0.0775, which is above the 50-day EMA. A move above this line would invalidate the ongoing bearish structure. In that case, a valid descending channel breakout could increase the possibility of testing the 0.1023 resistance level again.
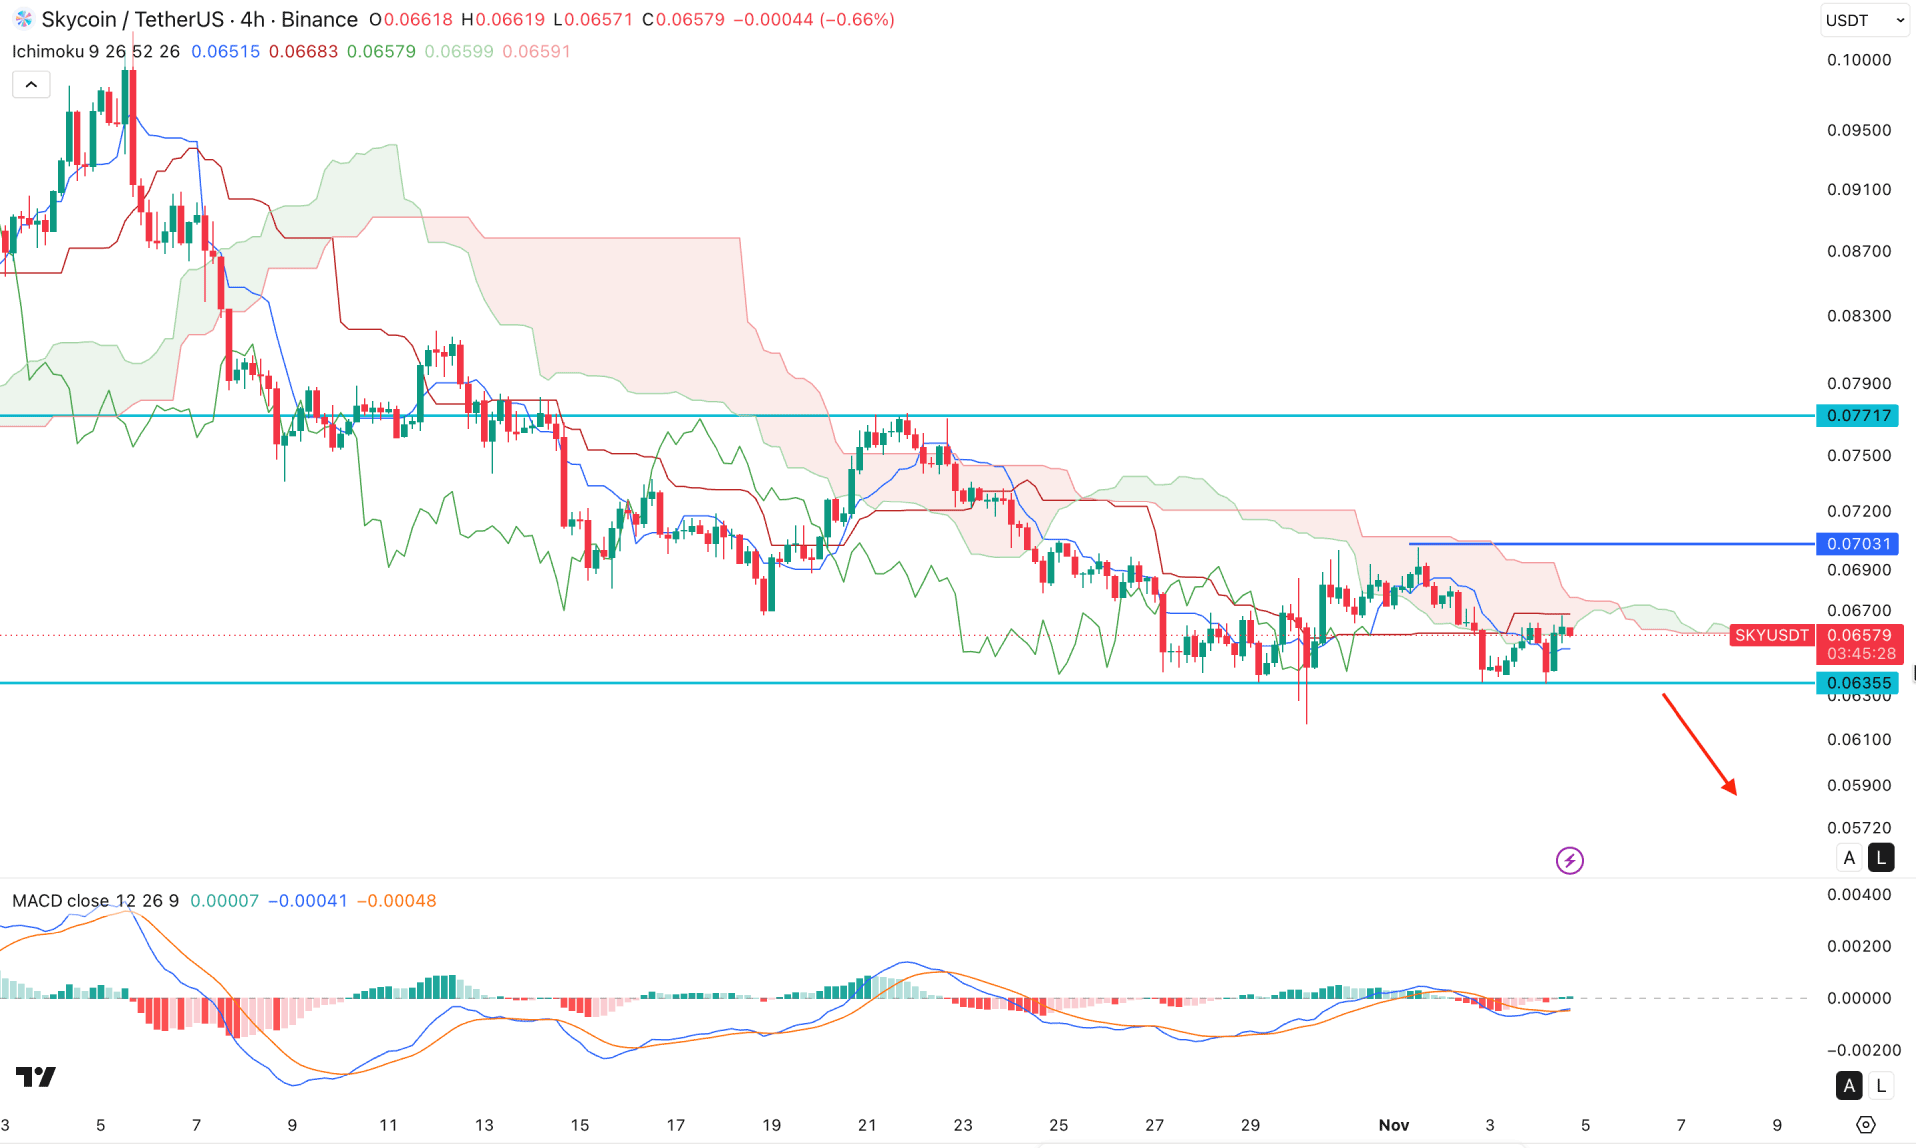
In the four-hour timeframe, SKY/USDT is moving sideways after a stable bearish move below the Kumo Cloud. Although the future cloud has narrowed, the price still remains below the cloud resistance.
In the secondary indicator window, the MACD histogram has squeezed toward the neutral level, while the signal line remains below the neutral area.
Based on this four-hour market structure, SKY/USDT is likely to form a new swing low as long as the price remains below the cloud resistance. The immediate support level to watch is 0.0635, as a break below this line could increase the chance of testing the 0.0580 area.
On the other hand, a significant bullish correction is pending, with the next resistance level to watch at 0.0703. A bullish break above this line, followed by consolidation, could reduce bearish pressure and encourage buyers to test 0.0771.
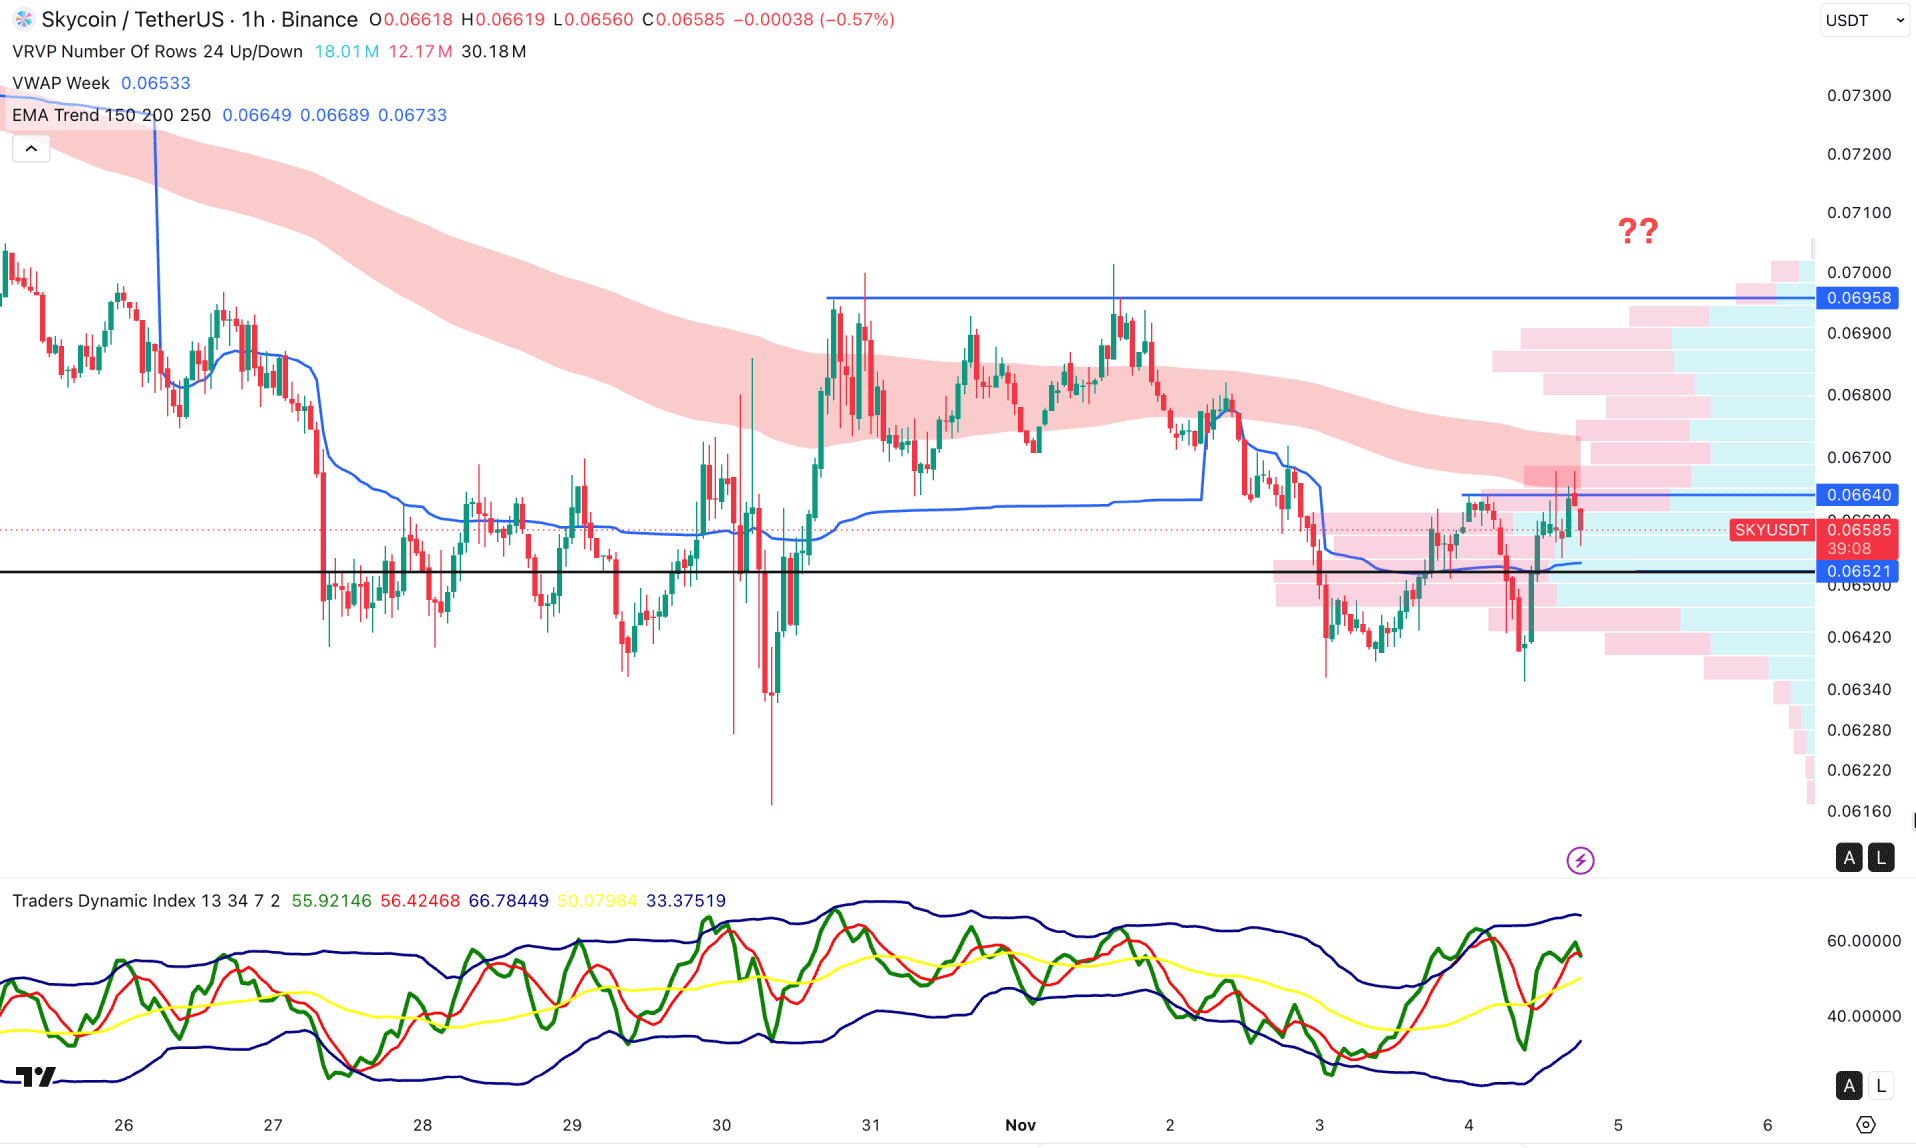
On the hourly timeframe, SKY/USDT is trading within a volatile market structure, with multiple violations near swing areas. Currently, the price is hovering above a high-volume line while the EMA wave is above the current price.
Primarily, this signals a sideways market from which a breakout could initiate a stable trend. The Trader's Dynamic Index is moving above the 60.00 level with sideways momentum, signaling ongoing bullish activity in the market.
Based on market structure, price tested the 0.0664 resistance level but moved sideways after grabbing liquidity. However, the 0.0652 internal level is still below the current price; if it breaks below this line, a short opportunity could target the 0.0600 area.
On the other hand, the bullish structure remains valid as long as price stays above the weekly VWAP line. In that case, overcoming the EMA wave could test the 0.0695 level before validating the bullish rebound.
Based on the overall market structure, SKY/USDT remains sideways as the entire structure is within a discounted trading zone. In that case, a sufficient liquidity grab from the sellers' side, along with a breakout from the ongoing market range, would primarily signal a bullish trend reversal.


