
Published: June 17th, 2025
After the start of its staking rewards scheme, SKY, the recently introduced governance coin in the MakerDAO ecosystem's restructuring initiative, is rapidly gaining popularity. With more than $580 million worth of SKY staked, players can expect a yearly yield of 16% in USDS. As much as 1.6 million USDS were distributed in the program's first week alone, indicating the community's enthusiastic embrace.
Staking SKY not only yields significant returns but also unlocks other incentives like governance tokens and participation points linked to future ecosystem projects. SKY's DeFi-native architecture is evident in customers' complete ownership over their property while earning.
With MakerDAO's extensive "Endgame" redesign, SKY takes the place of the outdated MKR token. Upgrading more than 420,000 MKR to SKY thus far gives holders entrance to the incentive program and the ability to vote. There will be a 1% fee that rises every three months starting on September 18, 2025, as a penalty for postponed renovations.
50% of revenue from protocols is allocated to SKY repurchases and awards in order to increase long-term value, and preparations are in place to remove constant protocol costs by the end of the year.
Let's see the future price movement from the SKY/USDT technical analysis:
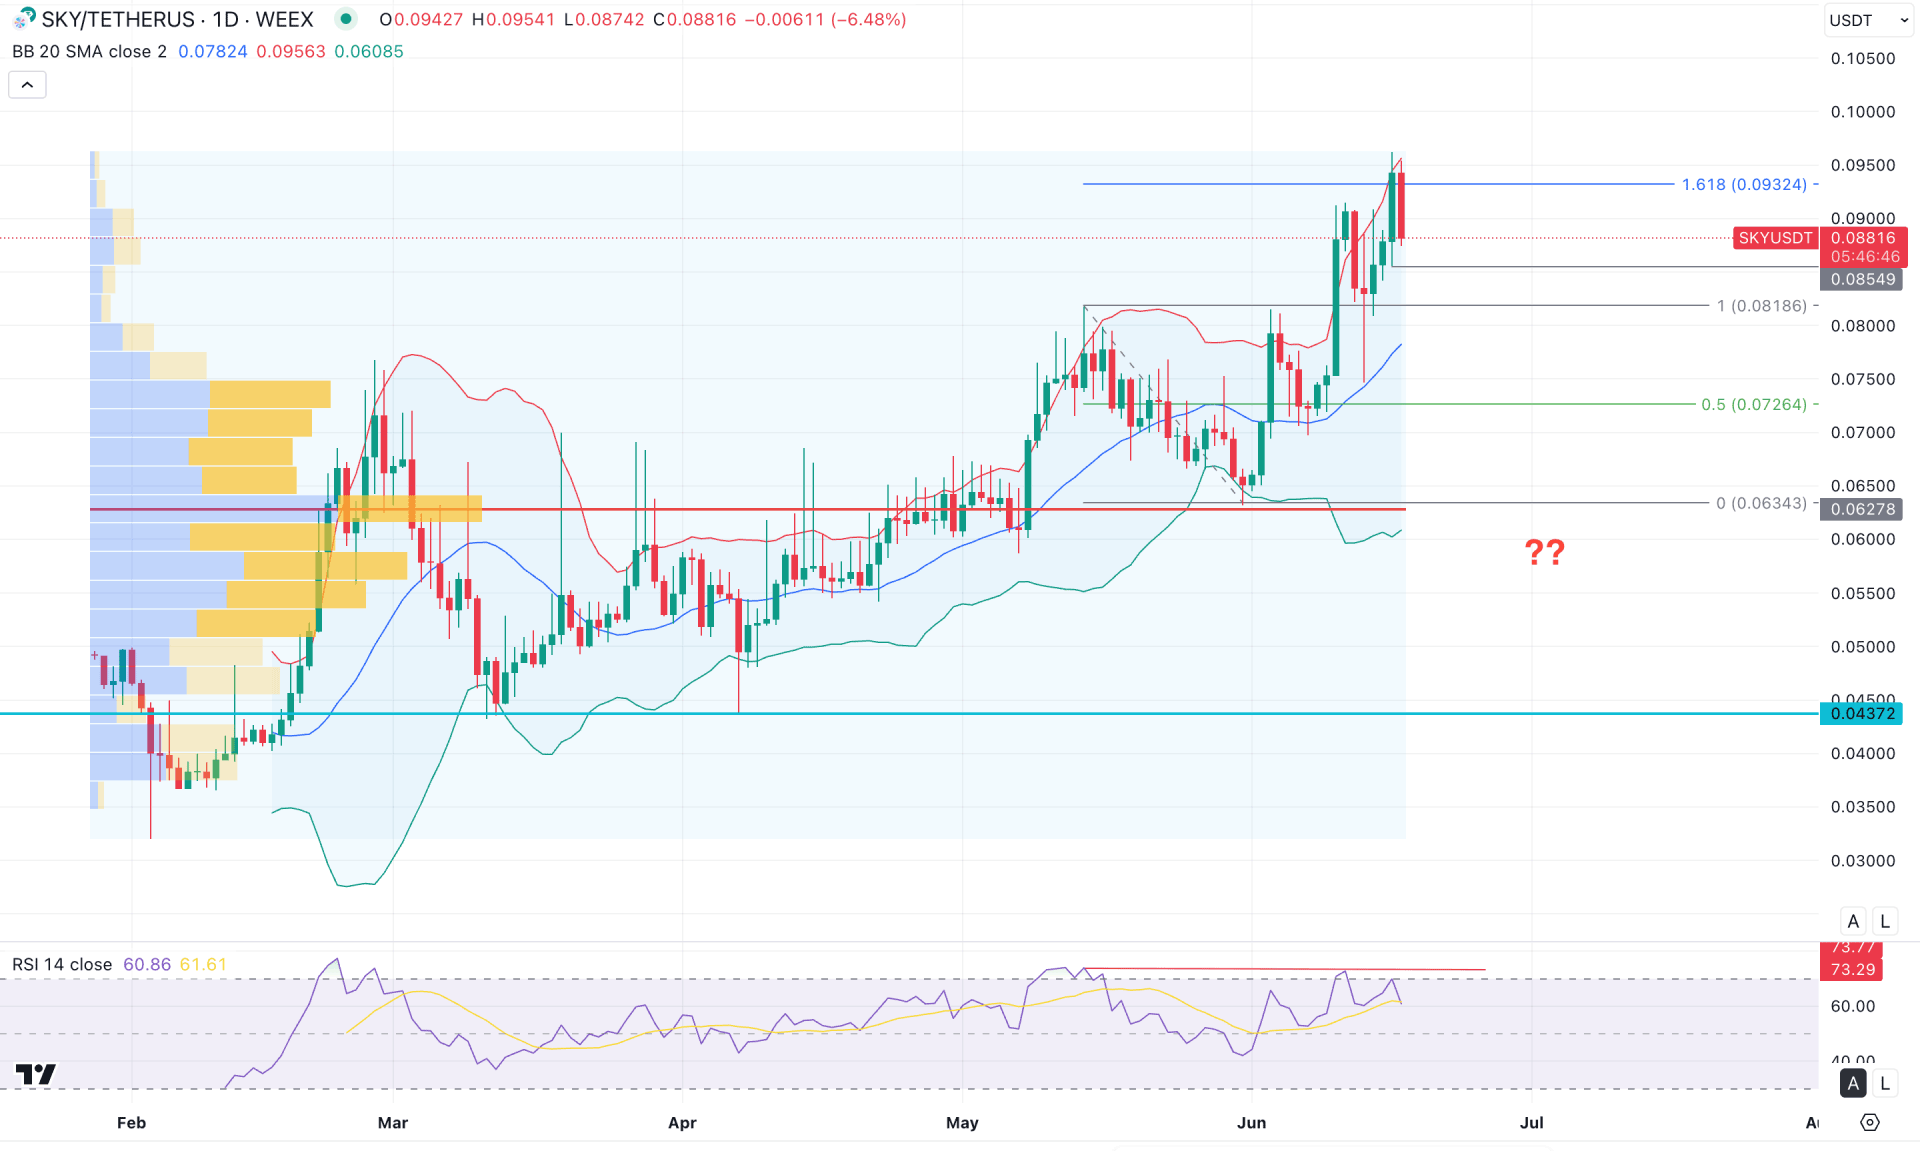
In the daily chart of SKY/USDT, the ongoing price action remains bullish, as the price has continued to rise since its inception. However, the current price is consolidating near the all-time high, suggesting that a corrective move may be due.
In the higher timeframes, a strong bullish momentum is evident on the monthly chart, with a clear continuation pattern forming on the weekly timeframe. As long as the weekly low of 0.0720 is protected, a bullish rebound remains likely.
On the volume side, the structure supports the bulls, as the most actively traded level since February 2025 sits at 0.0627, which is approximately 28% below the current price. Although the price trades above this high-volume node, it could signal a potential downside correction due to a possible mean reversion.
On the main price chart, the price is encountering resistance at the upper band of the Bollinger Bands, suggesting a potential bearish reversal. However, the price still holds above the 0.0854 daily support, which could serve as a strong demand zone.
In the secondary indicators, the Relative Strength Index (RSI) has entered the overbought zone and is showing signs of bearish divergence. A short-term downside correction is likely as long as the RSI remains below the 70.0 level.
From the SKY/USDT daily market outlook, the price trades at a premium zone, with resistance from the upper Bollinger Band nearby. This increases the likelihood of a downward move towards the midline of the Bollinger Bands, currently located near the 0.0780 level.
In the current context, the 0.0854 to 0.0700 zone is considered a potential bullish demand area, where a rebound could occur. On the upside, the immediate resistance is seen at 0.0962, which could act as the final target before any attempt to break above the 0.1000 psychological level.
On the other hand, an immediate bearish reversal below the 0.0854 support could increase the likelihood of a correction toward the 0.0783 mid-Bollinger Band. If selling pressure intensifies and the daily candle closes below 0.0696, a further decline toward the 0.0610 key support may follow.
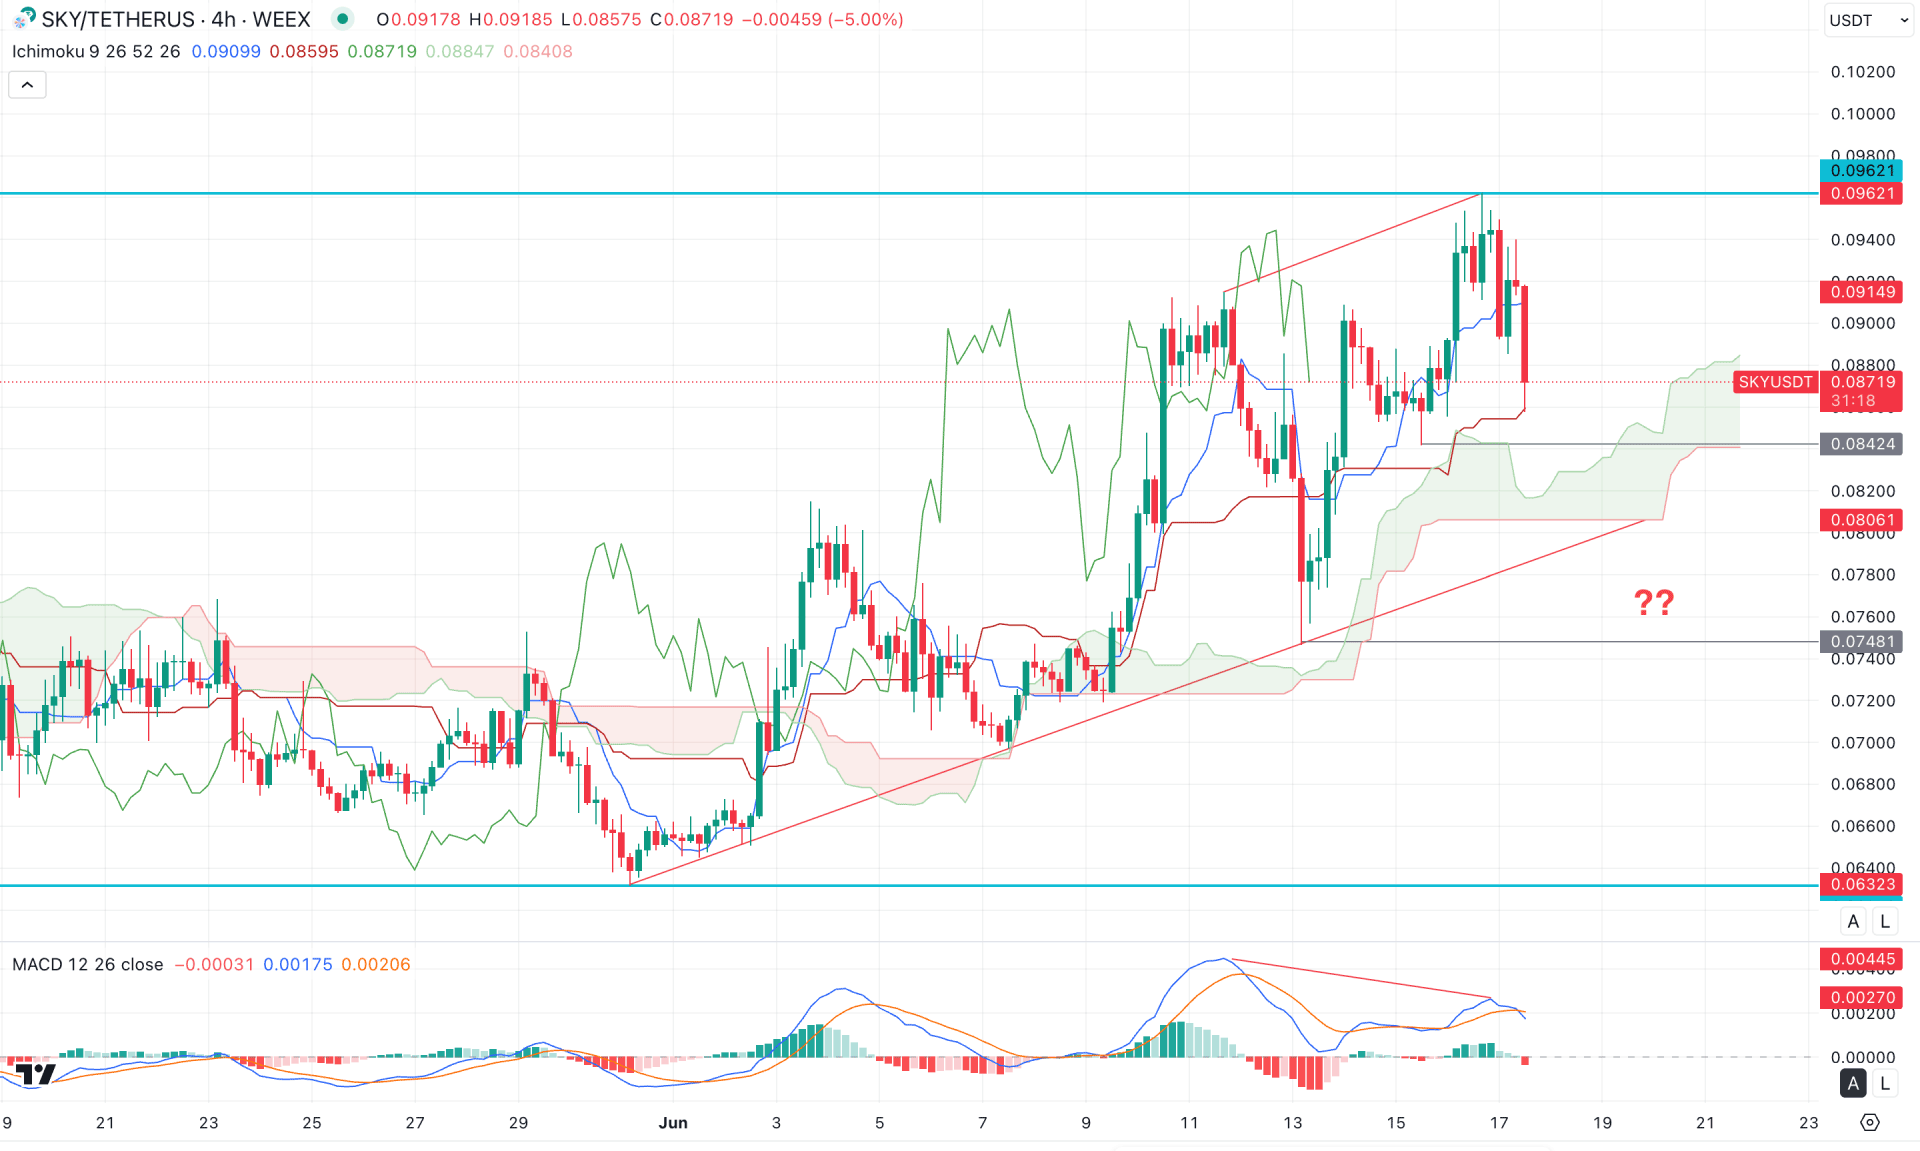
In the four-hour timeframe, the ongoing market momentum appears bullish, as the most recent price is trading above the Kumo Cloud. Moreover, the future cloud structure looks positive for the bulls, with both leading lines aiming higher.
However, the most recent four-hour candle has closed below the Tenkan Sen level and found support at the Kijun-sen area. This indicates a sideways market movement, especially following the bearish divergence with the MACD signal line. In this context, investors should remain cautious before opening long positions, as buying pressure appears weak at the current price level.
The MACD histogram has flipped to the negative zone in the indicator window, with a potential bearish crossover forming at the signal line. The secondary indicators support a possible downside continuation, although further confirmation from price action is needed.
Based on the four-hour outlook, investors should closely monitor how the price reacts to the 0.0842 support level, which lies just above the Kumo Cloud. A potential bullish recovery from the 0.0842 to 0.0748 zone, which is double-marked above key support, could lead to a bullish continuation opportunity, targeting the 0.1000 level.
On the other hand, failure to hold above the Kumo Cloud, with consolidation below the 0.0800 area, may open the door for a short opportunity, targeting the 0.0650 support level.

In the hourly timeframe, the Internet price is trading under selling pressure. Everest Webb is acting as immediate support. However, the price has rebounded and moved below the weekly VWAP line for four consecutive hours.
The volume histogram indicates ongoing selling pressure in the secondary indicator window, while the most recent price lines failed to create a new low.
Based on this outlook, the primary expectation is a bearish movement once the price drops below the 0.0855 level. If that happens, the next short-term support is expected at the 0.0800 level, followed by a potential decline toward 0.0746.
On the other hand, an alternative scenario could be an inside liquidity sweep from the 0.0841 low, followed by a recovery above the weekly VWAP. In that case, the price might push above the 0.0900 area in the coming hours.
Based on the current market outlook, SKY/USDT is trading in a premium zone, where a considerable downside correction could occur. Therefore, investors should remain cautious before opening any long positions, as the price has already reached the crucial Fibonacci Extension level based on the May 2025 swing.
If the price breaks below the 0.0746 support, potentially forming a new bottom around the 0.0650 area, a better long-term buying opportunity might arise.


