
Published: March 25th, 2026
Sky (SKY) token is a native token of the Sky Protocol, an upgraded version of MKR. The recent solid bottom formation in this coin, with a valid reversal that attracted bulls. Moreover, other functionalities, such as Sky Savings Rate, STRs, and activation rewards, could attract significant user attention.
The Sky Protocol is a rebranded version of MakerDAO, with the main aim of improving governance efficiency and making the structure more scalable. Also, the shift came with a migration to the SKY as a governance token, replacing MKR. However, the Sky Protocol continues to support MakerDAO's legacy assets, such as DAI and MKR. Also, SKY was created to enhance market participation as the MKR has a larger supply. As a result, the ecosystem can be more secure in the decentralised sector.
Let's see the upcoming price action of this coin from the SKY/USDT price analysis:
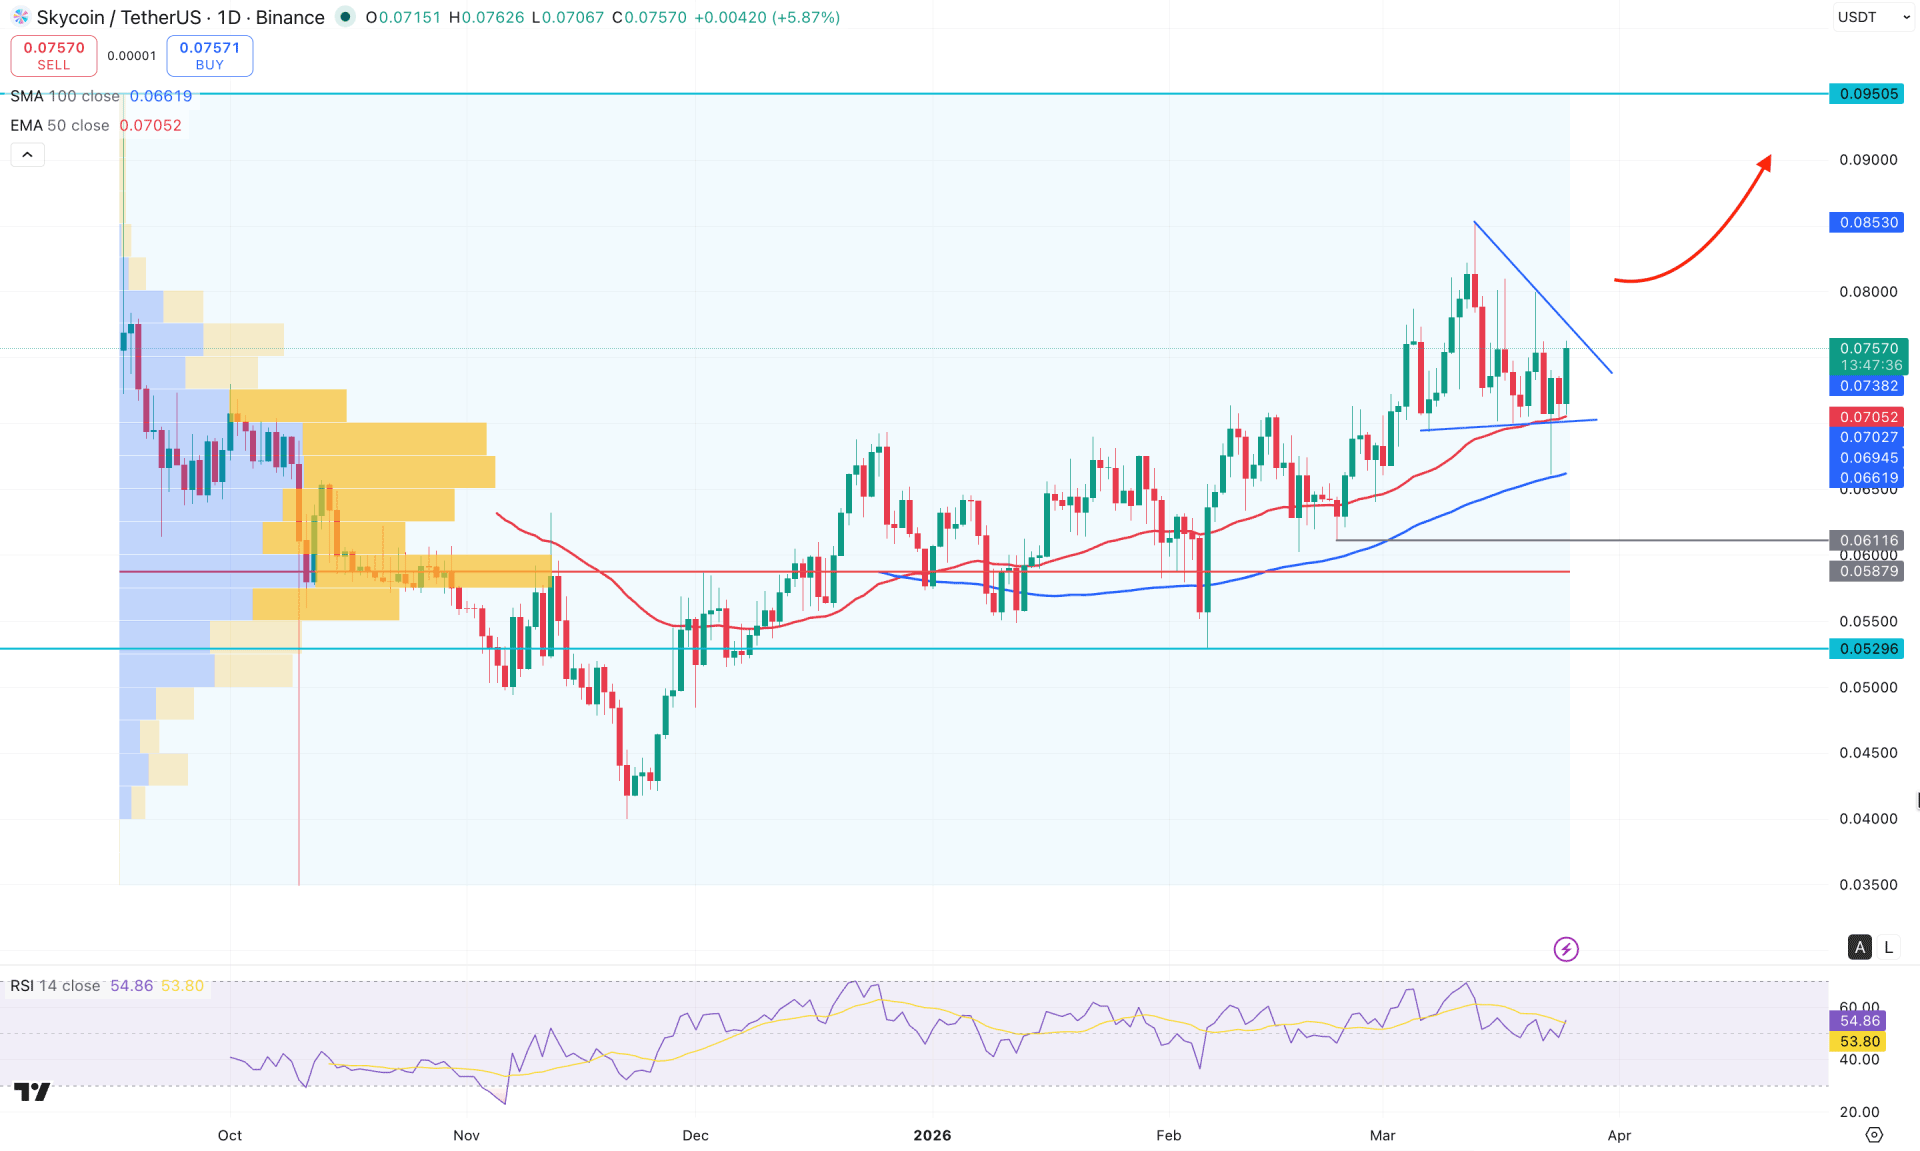
In the daily chart of SKY/USDT, the price is currently trading sideways within a broader bullish structure. After forming a valid bottom, the price rebounded and is now trading within an established range, suggesting that further continuation is possible.
On higher timeframes, bullish pressure remains evident. The monthly chart shows four consecutive bullish candles, indicating sustained upward momentum. The weekly timeframe also signals potential bullish continuation, although some volatility is visible around the 0.0800 level.
In terms of volume, buying pressure appears strong, with the highest activity level since the beginning observed around the 0.0587 zone. The price is currently trading above the high-volume node, and multiple sell-side liquidity sweeps indicate that buyers are still actively interested in this instrument.
The 100-day Simple Moving Average and the 50-day Exponential Moving Average are positioned below the current price, acting as dynamic support levels. Notably, a strong bullish reversal candlestick formed after touching the 100 SMA, followed by a daily close above the 50 EMA. This signals strong buying pressure, further confirmed by the bullish candlestick structure.
In the most recent price action, the market is forming a symmetrical triangle pattern. The current price is approaching the triangle resistance, from where a potential bullish breakout, supported by rising moving averages, could present a continuation opportunity.
In the secondary indicator window, the Relative Strength Index (RSI) remains above the 50.00 level, although it is facing some resistance near the upper boundary. Meanwhile, the Average Directional Index (ADX) suggests weak trend strength, as it remains below the 20.00 threshold, indicating a sideways market condition.
Based on the overall market structure, SKY/USDT is more likely to extend its bullish momentum following a confirmed breakout from the symmetrical triangle. Investors should closely monitor the 0.0800 level, as a breakout and consolidation above this zone could signal a long-term bullish move. The next resistance levels are at 0.0900, followed by the psychological 0.1000 level.
Alternatively, a strong bearish rejection at the triangle resistance could invalidate the bullish structure and lead to a retest of the 100 SMA. A daily close below the 0.0690 support level, followed by consolidation, may increase the probability of a move toward the 0.0529 level in the coming days.
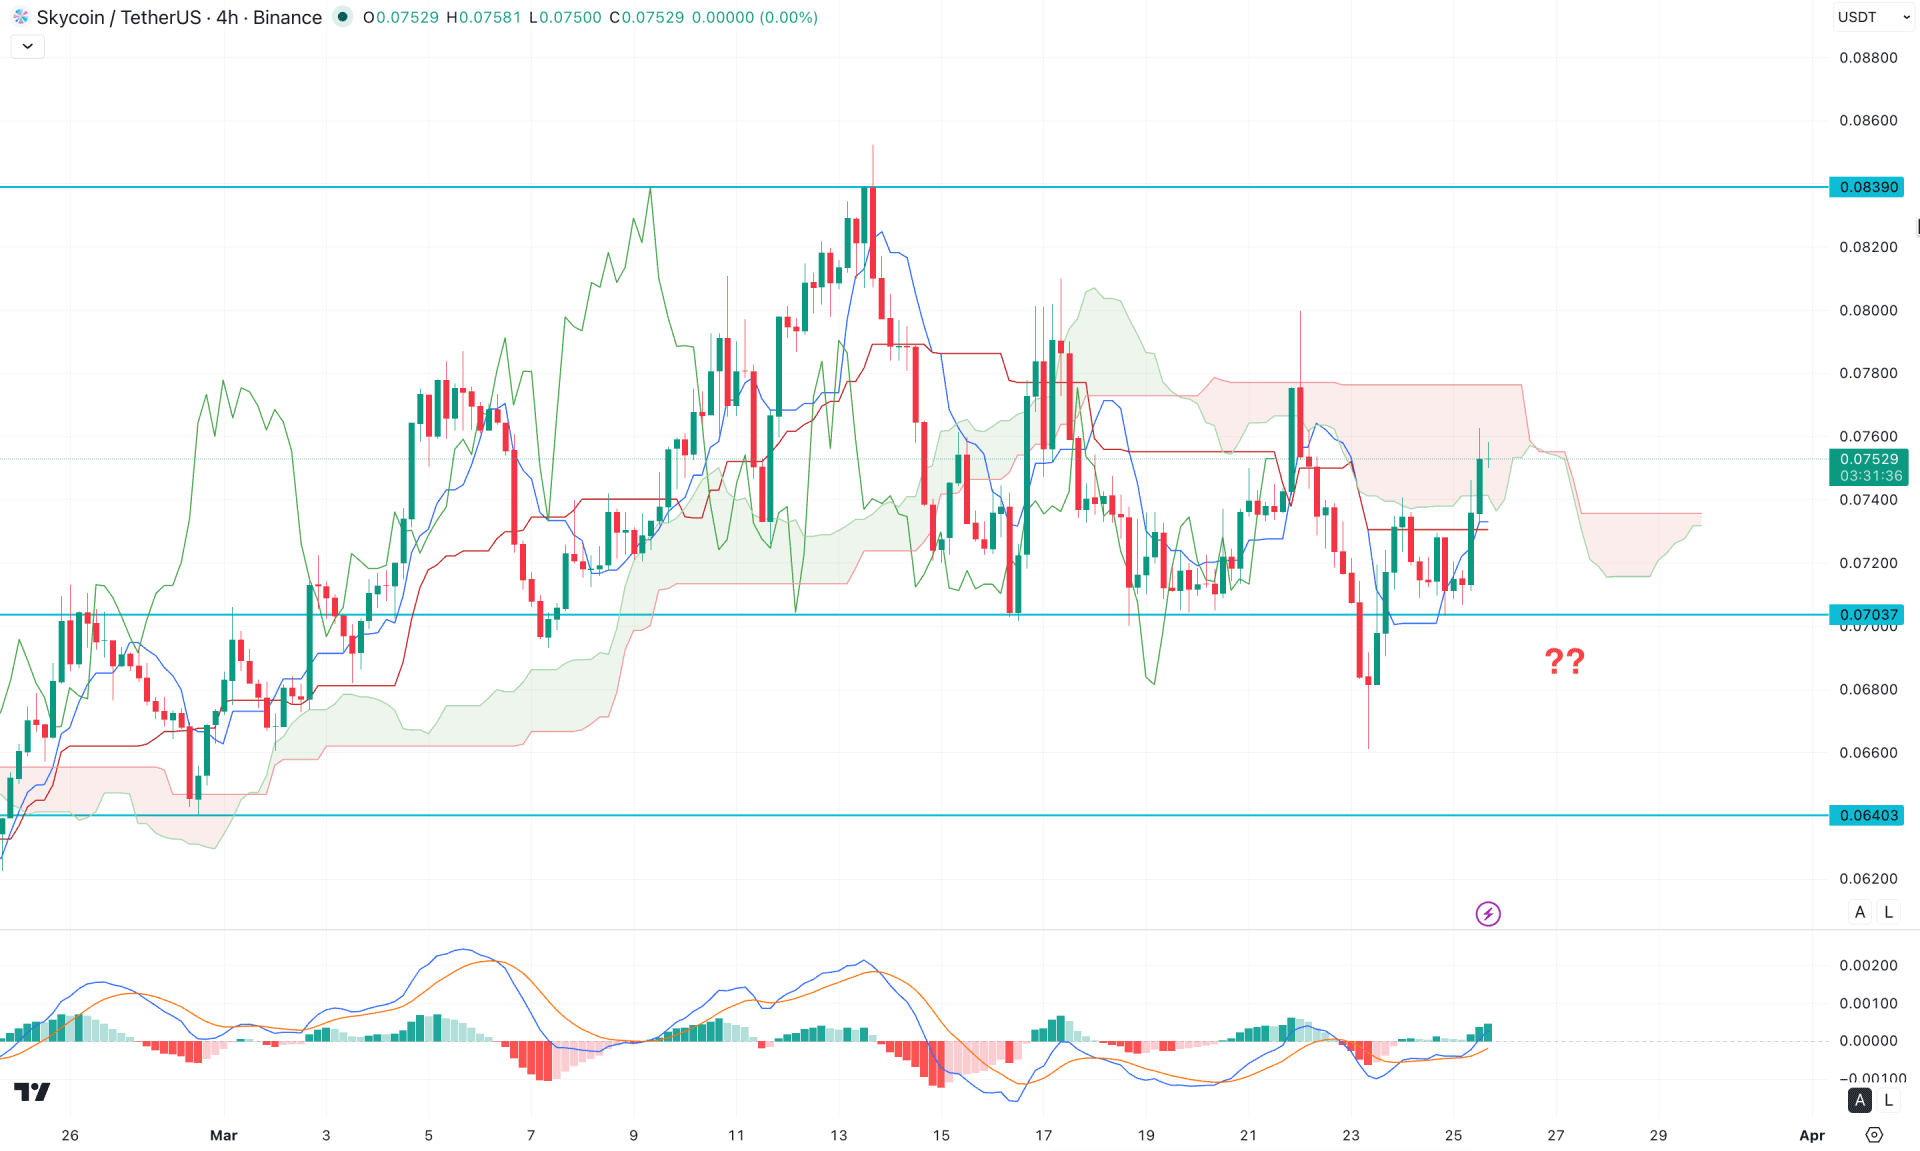
In the four-hour timeframe, the price is trading below the Ichimoku Cloud, and the overall structure appears highly volatile. The future cloud is relatively flat, with Senkou Span A moving upward toward a flat Senkou Span B, signalling a potential trend transition.
In the indicator window, the MACD histogram has been trending upward for some time, indicating strengthening momentum. The signal line is also following this upward movement. Based on the current reading, the signal line has reached the neutral level from the oversold region, suggesting the emergence of bullish pressure in the main price chart.
Based on the four-hour market structure, the price is struggling to break above the Ichimoku Cloud, as multiple bearish rejections have occurred at this level. Investors should closely monitor how the price reacts around the Kijun-sen level. A continued rejection, followed by a firm close below the 0.0700 level, could validate a short opportunity targeting the 0.0640 area.
On the other hand, if the price stabilises and moves above the 0.0780 level with a strong bullish breakout above the cloud, it could signal a trend reversal. In that scenario, buying pressure may extend toward the 0.0860 level in the coming days.
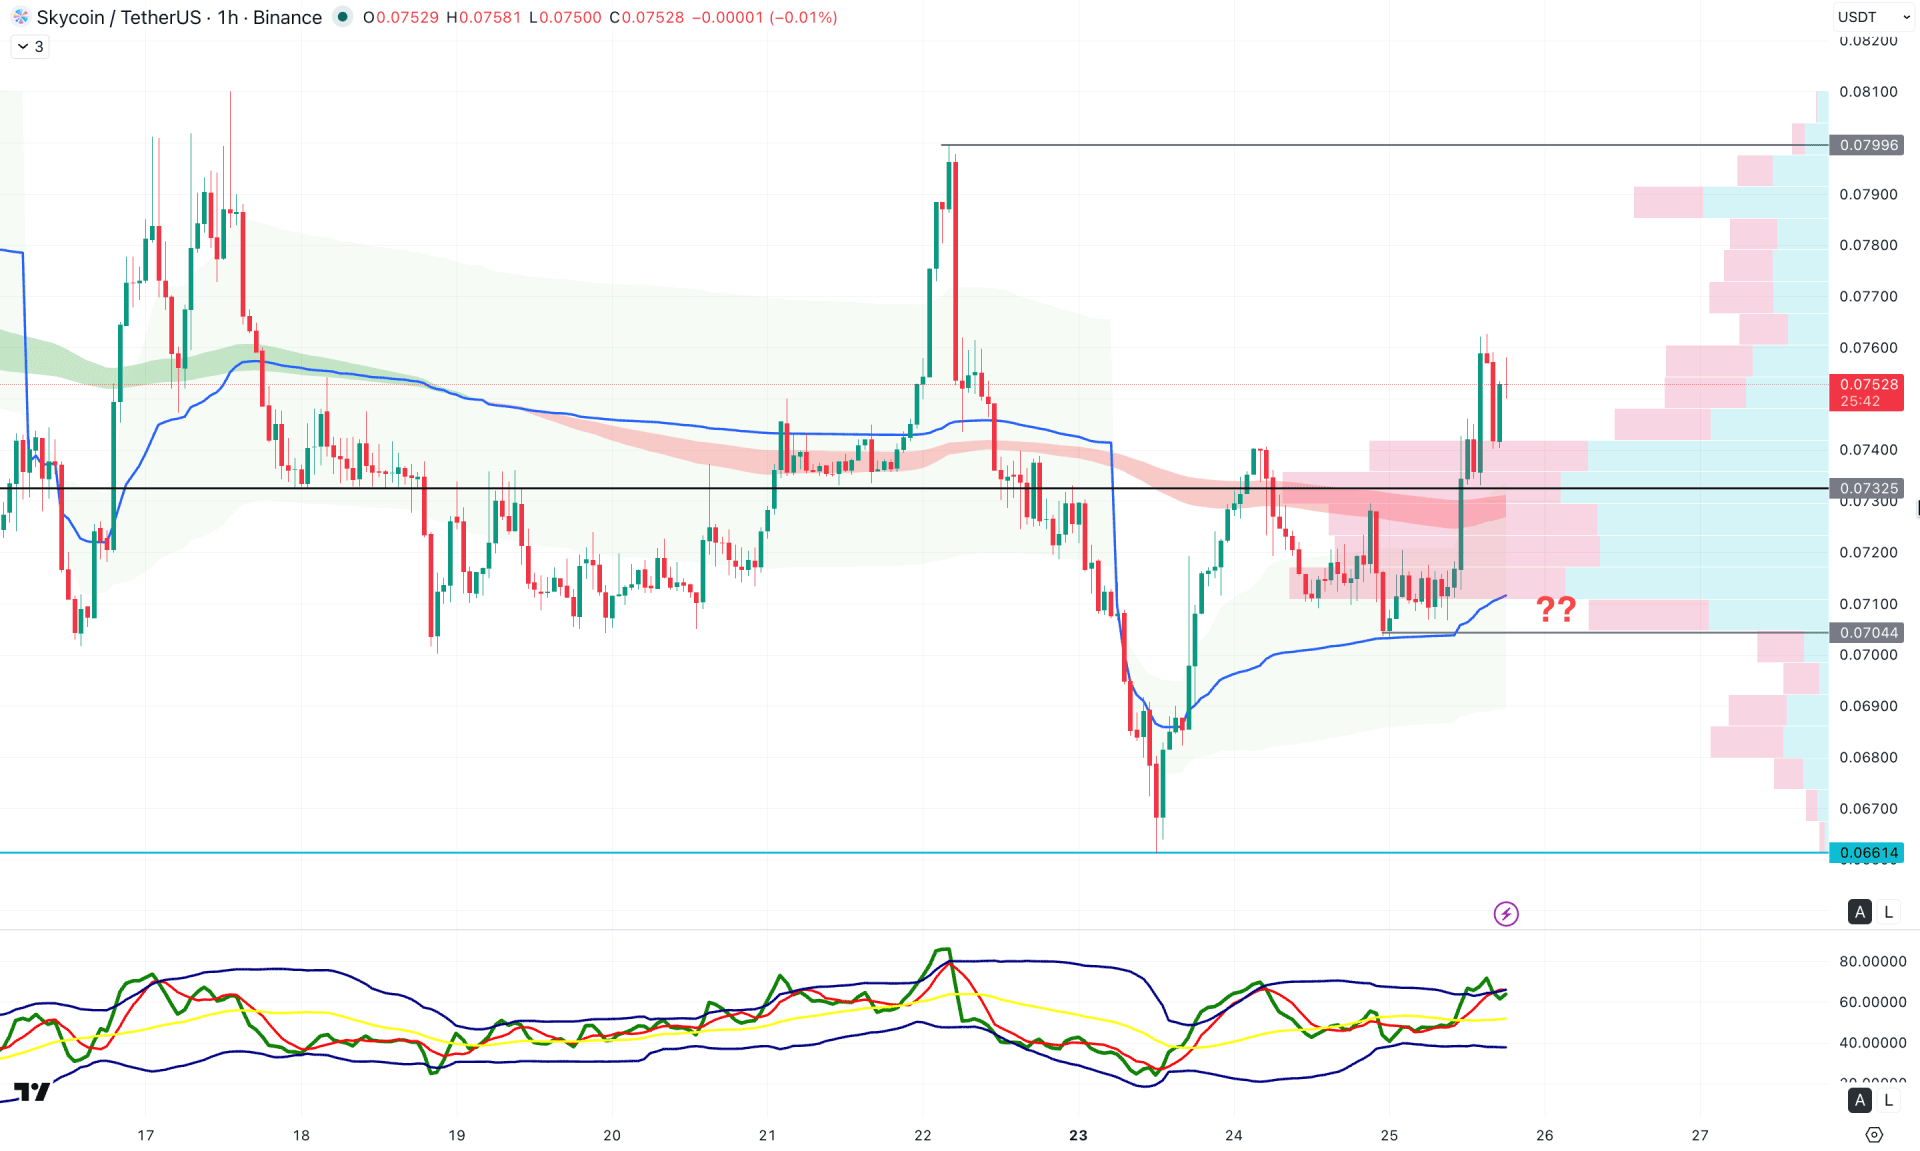
In the hourly timeframe, the price is trading bullish, where dynamic lines are below the current price. The weekly VWAP is widening, suggesting a bearish correction, while the EMA wave is the immediate support.
In the indicator window, the Traders Dynamic Index is at the bullish extreme level, which signals an ongoing buying pressure.
Based on this outlook, a minor downside correction is pending in this pair, where the major intraday trend remains bullish. As long as the price hovers above the EMA wave, we may expect a bullish continuation in the coming hours.
However, a failure to hold the buying pressure above the 0.0700 level with an immediate downside pressure could alter the current trend.
As per the current market structure, SKY/USDT is trading within a stable bullish trend, from where a valid symmetrical triangle breakout could boost the buying pressure at any time. As the intraday price is at the overbought area, a considerable downside correction might come before following the major market trend.


