
Published: July 4th, 2024
In the recent chart, Silver prices remained stagnant at approximately $30.00 per ounce, sustaining gains of more than 3% from the previous session and approaching a two-week high. This stability results from softer-than-anticipated US economic data, which has increased anticipation for the Federal Reserve's interest rate cuts.
This week, Federal Reserve Chair Jerome Powell observed that recent data suggests a transition to a disinflationary trend. Nevertheless, he underscored the necessity of greater assurance regarding the inflation outlook before contemplating implementing an easing policy.
Investors are concentrating on the critical monthly employment report from the United States, which will be released on Friday, to obtain additional information.
The sentiment towards silver was also bolstered by the anticipated increase in demand due to the expansion of renewable energy. Silver is essential for producing solar panels and other renewable energy technologies due to its exceptional conductivity and use in photovoltaic cells.
In the interim, China's economic prognosis, the world's largest consumer of silver, remains uncertain due to conflicting economic indicators. Additionally, markets are anticipating the Third Plenum, which is scheduled to occur later this month, in anticipation of potential new stimulus measures.
Let's see the future price of this instrument from the XAGUSD technical analysis:
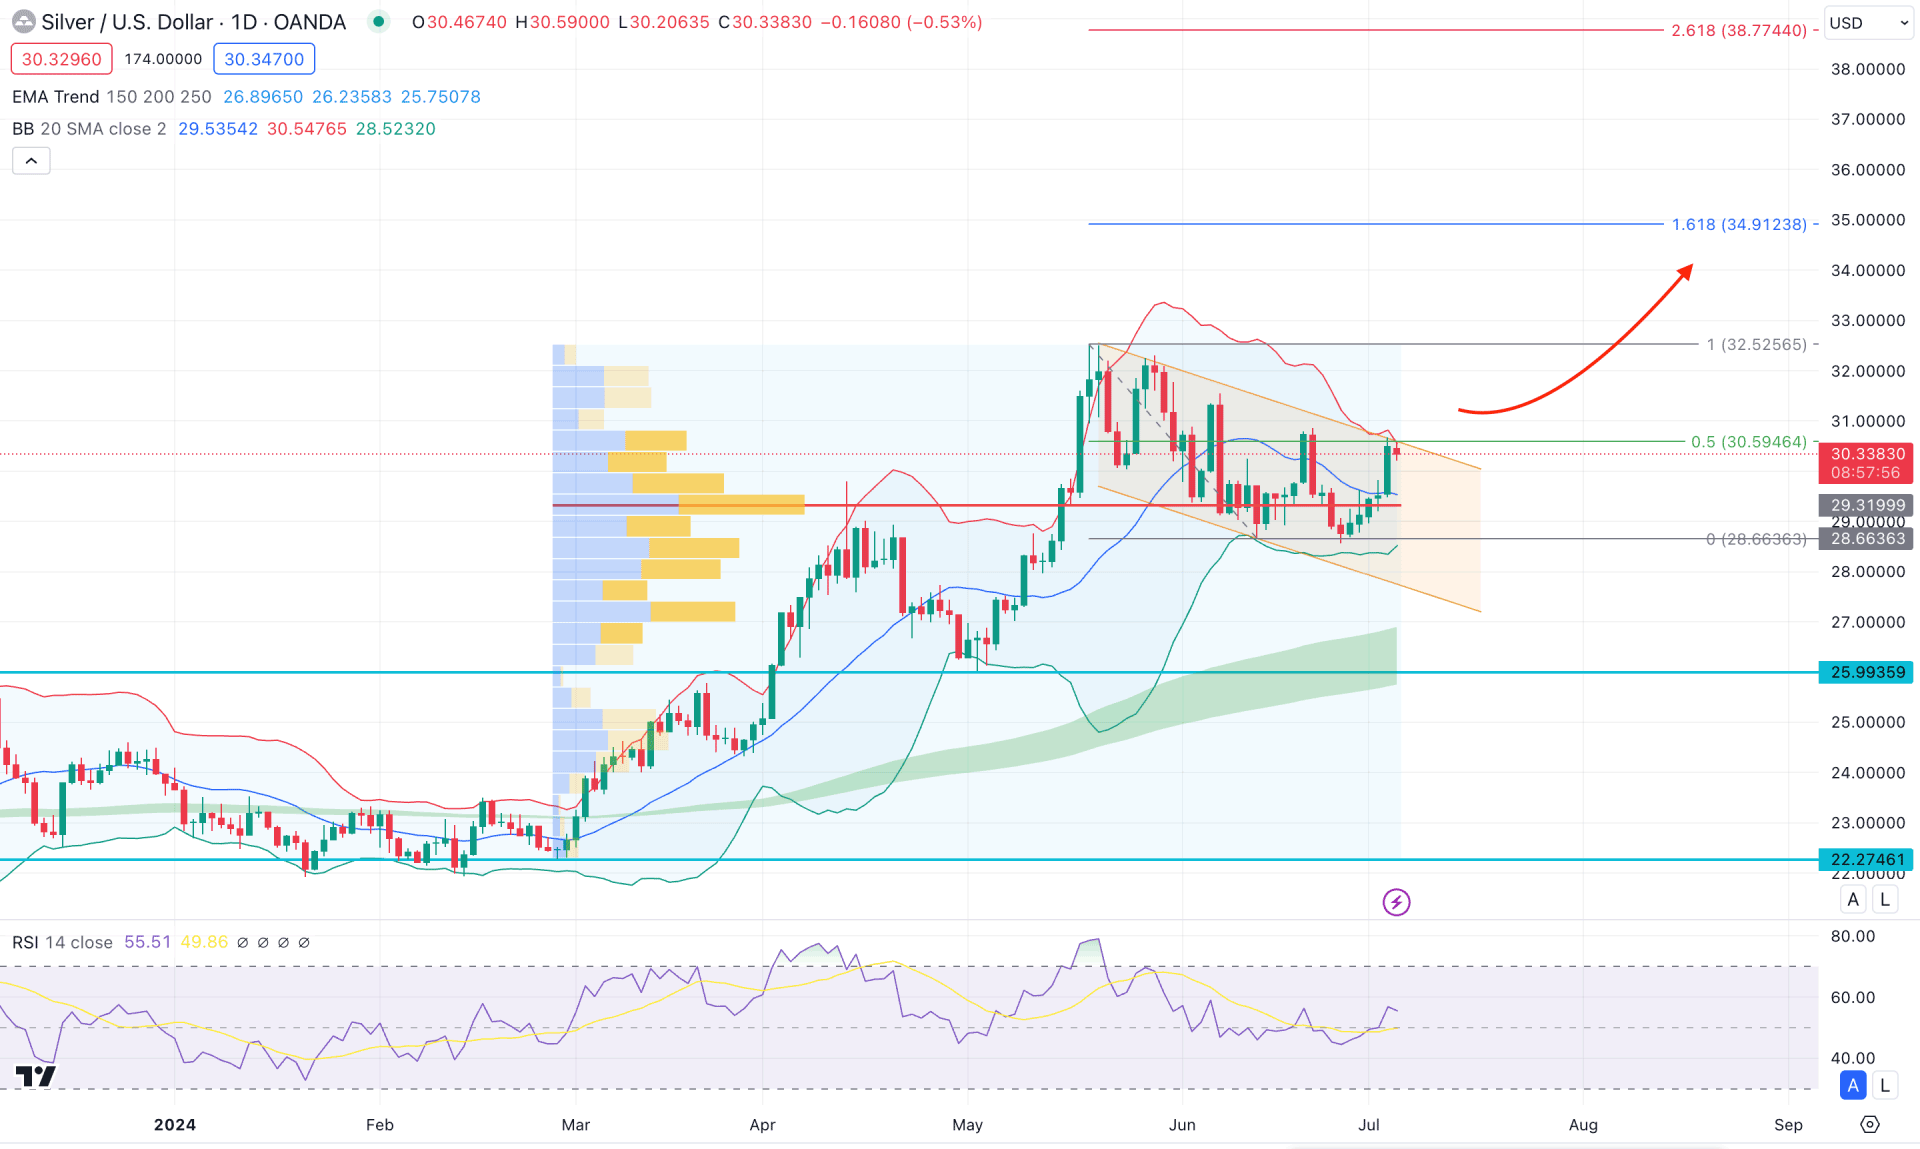
In the daily chart, the XAGUSD price is trading within a descending channel, where the broader market trend is bullish. Once the downside correction is over, investors might find a fresh trend.
In the volume structure, the buying pressure is positive, with the most significant level since March 2014 at 29.31. As the most recent daily candle closed bullish from this crucial level, we may expect the buying pressure to extend.
In the higher timeframe, a strong bullish monthly close is seen in May 2024, which is supported by the minor bearish close in the next month as an inside bar. Moreover, the latest weekly candle suggests an indecisive momentum, where a bullish break above the Doji candle's high could be a trend trading opportunity.
In the daily Bollinger Bands, the current price is facing resistance from the Upper Bollinger Bands, where the mid-Bollinger Bands suggest a neutral momentum by being flat. In this context, investors should monitor how the price trades at the upper Bollinger Bands resistance, from where a downside correction might happen.
In the broader context, the Moving Average wave consists of MA 150 to 250, which remains below the 28.66 support level, suggesting a major support. Moreover, the Relative Strength Index (RSI) found a base at the 40.00 level and rebounded higher. As the current RSI hovers above the crucial mid-point we may expect an upward pressure to extend.
Based on the current price prediction of XAGUSD, an immediate bullish pressure with a daily candle above the 31.00 level could increase the possibility of reaching the 34.91 Fibonacci Extension level. However, a downside pressure might come from the channel resistance, creating an extension below the 29.31 level. In that case, buying pressure with a valid daily candle from the 29.00 to 28.00 zone could be a potential long opportunity.
On the bearish side, any immediate bearish pressure from the 30.00 to 31.00 zone with a daily close below the 20-day EMA could lower the price towards the 27.00 area.
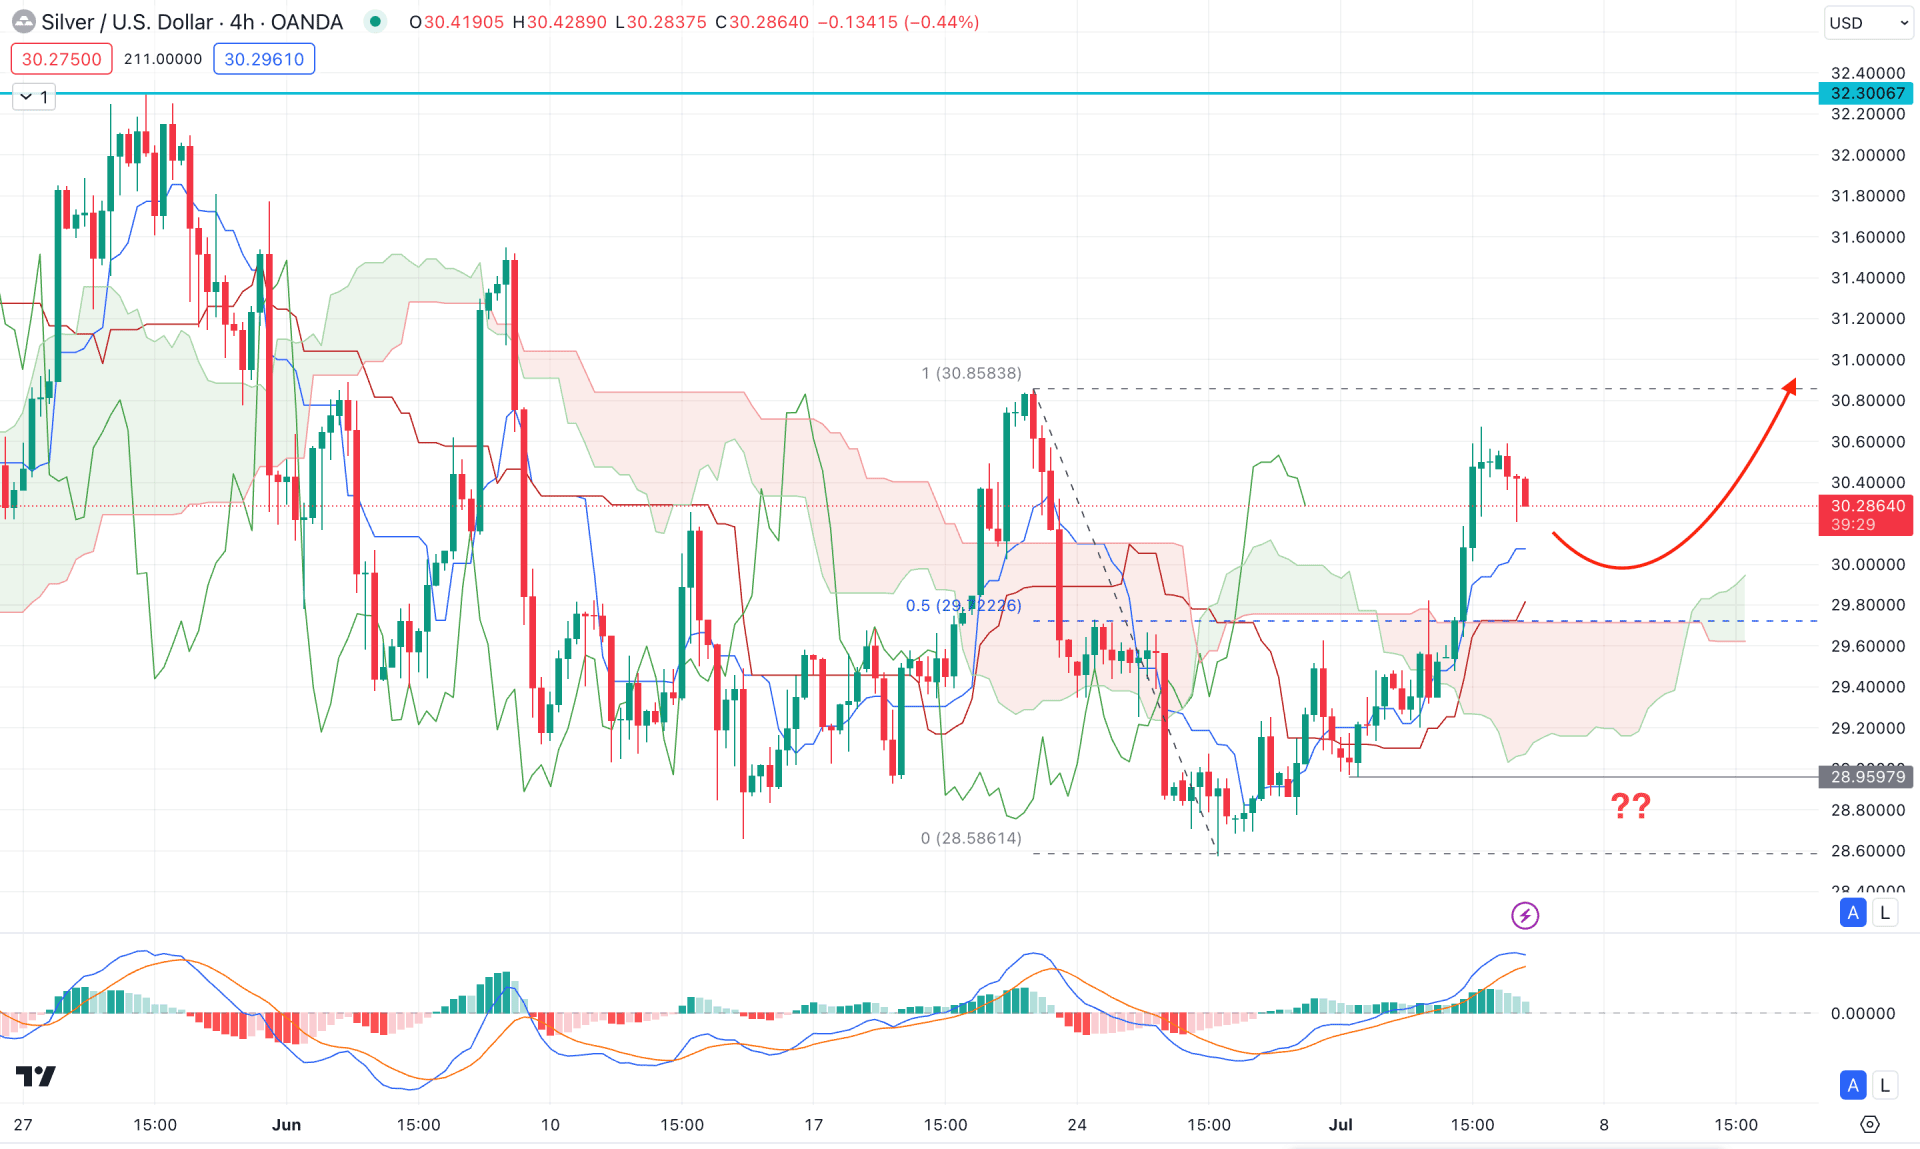
In the H4 timeframe, the most recent price shows a bullish breakout from the Ichimoku Cloud zone, suggesting a trend reversal. Moreover, the Senkou Span A moved above the Senkou Span B, supporting the potential buying pressure.
In the indicator window, the MACD Histogram aimed lower but maintained the buying pressure above the neutral level. However, the Signal line is at the top, suggesting a bearish pressure as a corrective momentum.
Based on the H4 structure, a downward correction is pending, where a bullish reversal from the 29.72 to 28.92 zone could be a potential long opportunity, targeting the 32.30 resistance level.
On the other hand, a counter-impulsive bearish pressure with a bearish cloud breakout could lower the price towards the 27.00 area.
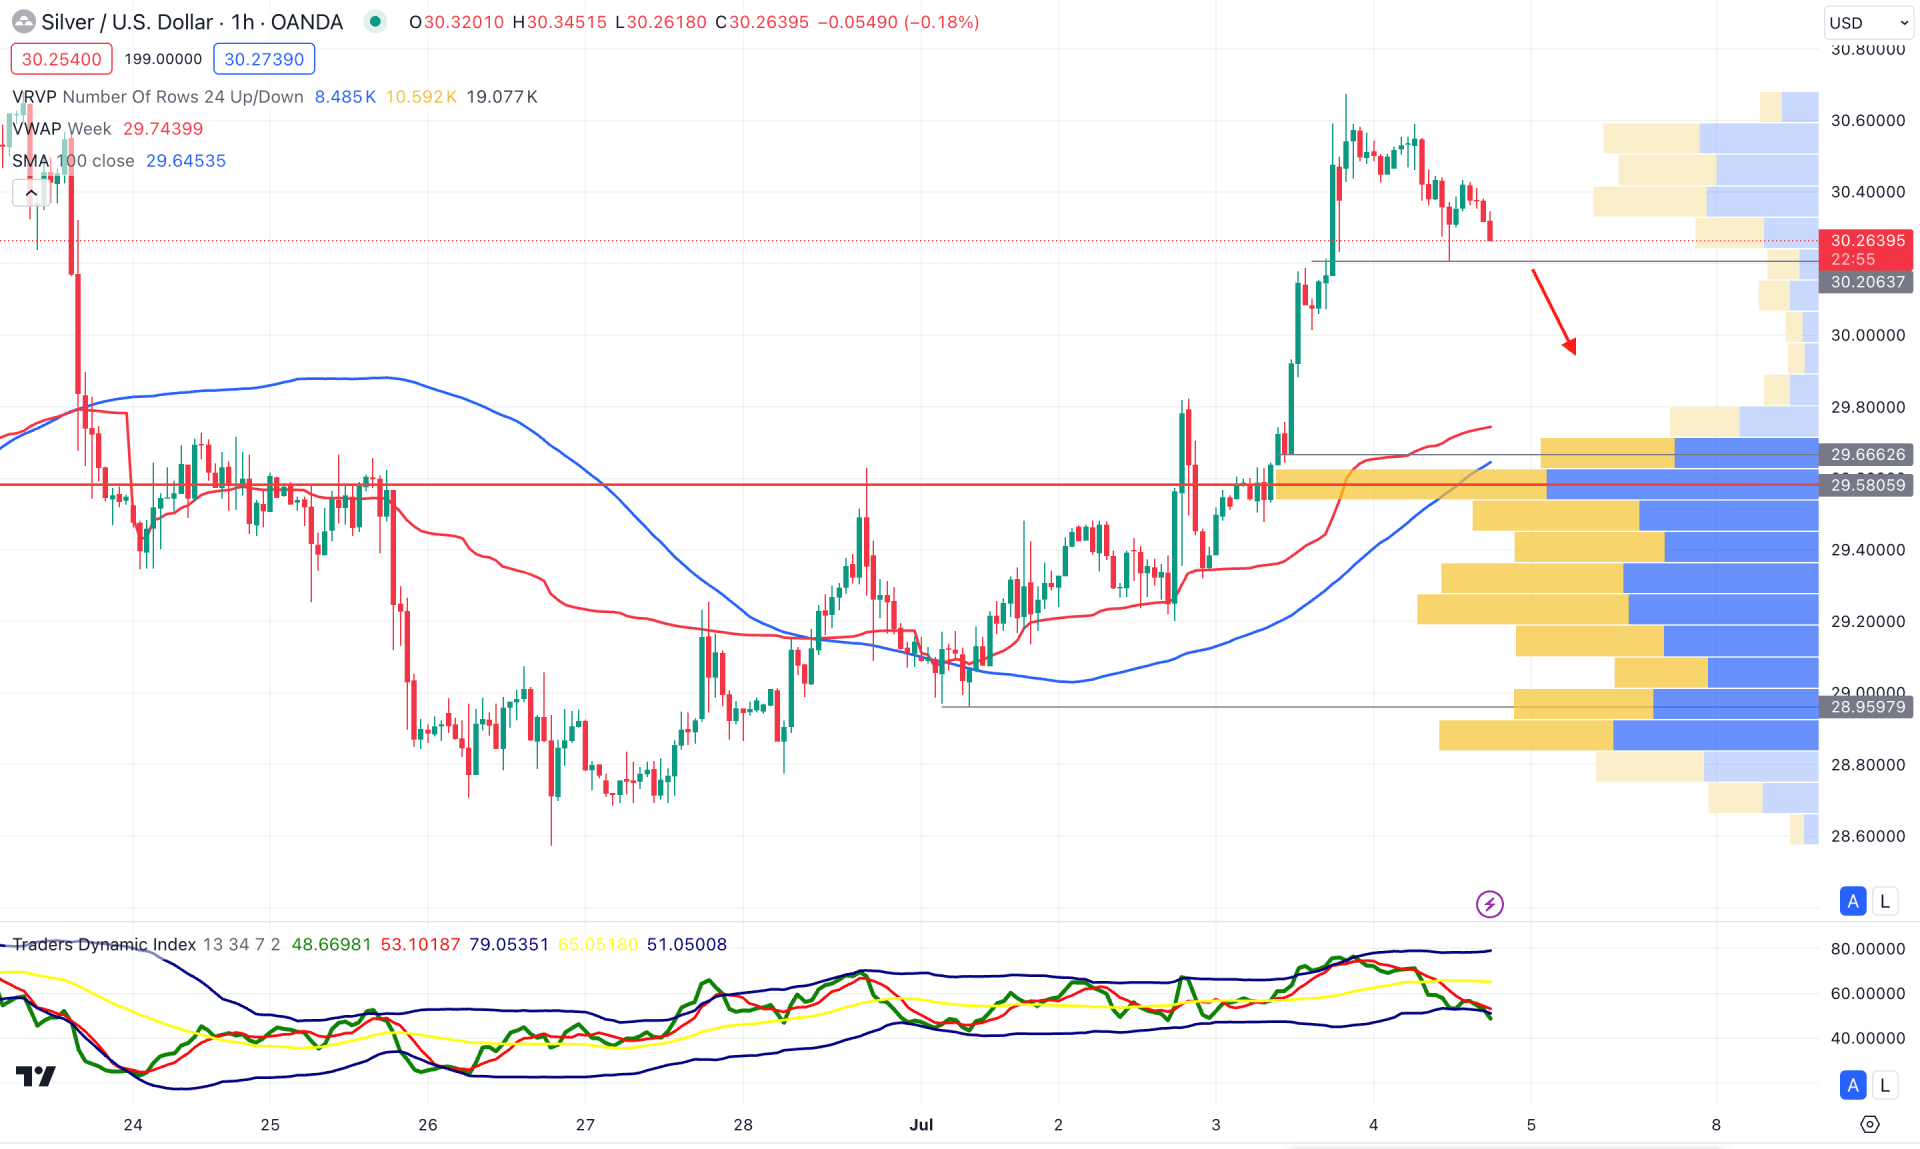
In the hourly time frame, the cent price trades higher from the 100 Simple Moving Average level, suggesting an ongoing bullish pressure. Moreover, the price overextended from the visible range high volume line, suggesting a pending downward correction.
In the indicator window, the Traders Dynamic Index (TDI) reached the oversold zone, suggesting that the price might find a bottom.
Based on the hourly outlook, a bearish H1 candle below the 30.20 support line could initiate a broader correction toward the 100 SMA area. However, a bullish reversal from the 29.90 to 29.40 zone could resume the existing trend anytime.
Based on the current market structure, the XAGUSD can take the price higher from the valid channel breakout. In that case, a valid breakout should come with a daily close above the near-term resistance level.


