
Published: February 29th, 2024
Silver (XAGUSD) trades at the crucial low with a corrective momentum, where the PCE data worked as a bullish factor for this instrument.
The primary drivers of growth in government social benefits were increased social security benefits, adjusted for cost of living by 3.2 percent, and other government social benefits, which were notably propelled by an increase in enrollments under the Affordable Care Act. In contrast, the primary driver of the rise in personal income from assets was an escalation in personal dividend income, as supported by information extracted from the financial statements of the companies. Besides, the unemployment claim shows a negative sentiment by coming at 215K, up from 202K in the previous week.
Rate-cutting measures by the Federal Reserve are improbable to be considered if inflation continues. This would enhance the appeal of the US Dollar and bond yields, given that a resolute stance by the Federal Reserve tends to attract greater foreign capital inflows.
Despite a potential downgrade in the inflation report, market expectations regarding rate cuts at the policy meetings in March and May are not expected to increase substantially. Before contemplating a change in monetary policy, Fed officials require positive inflation data that persists for several months.
Consequently, a solitary decline in inflation figures would not be adequate to compel policymakers to modify their stringent policy position promptly.
Let’s see the future price projection of this instrument from the XAGUSD technical analysis:
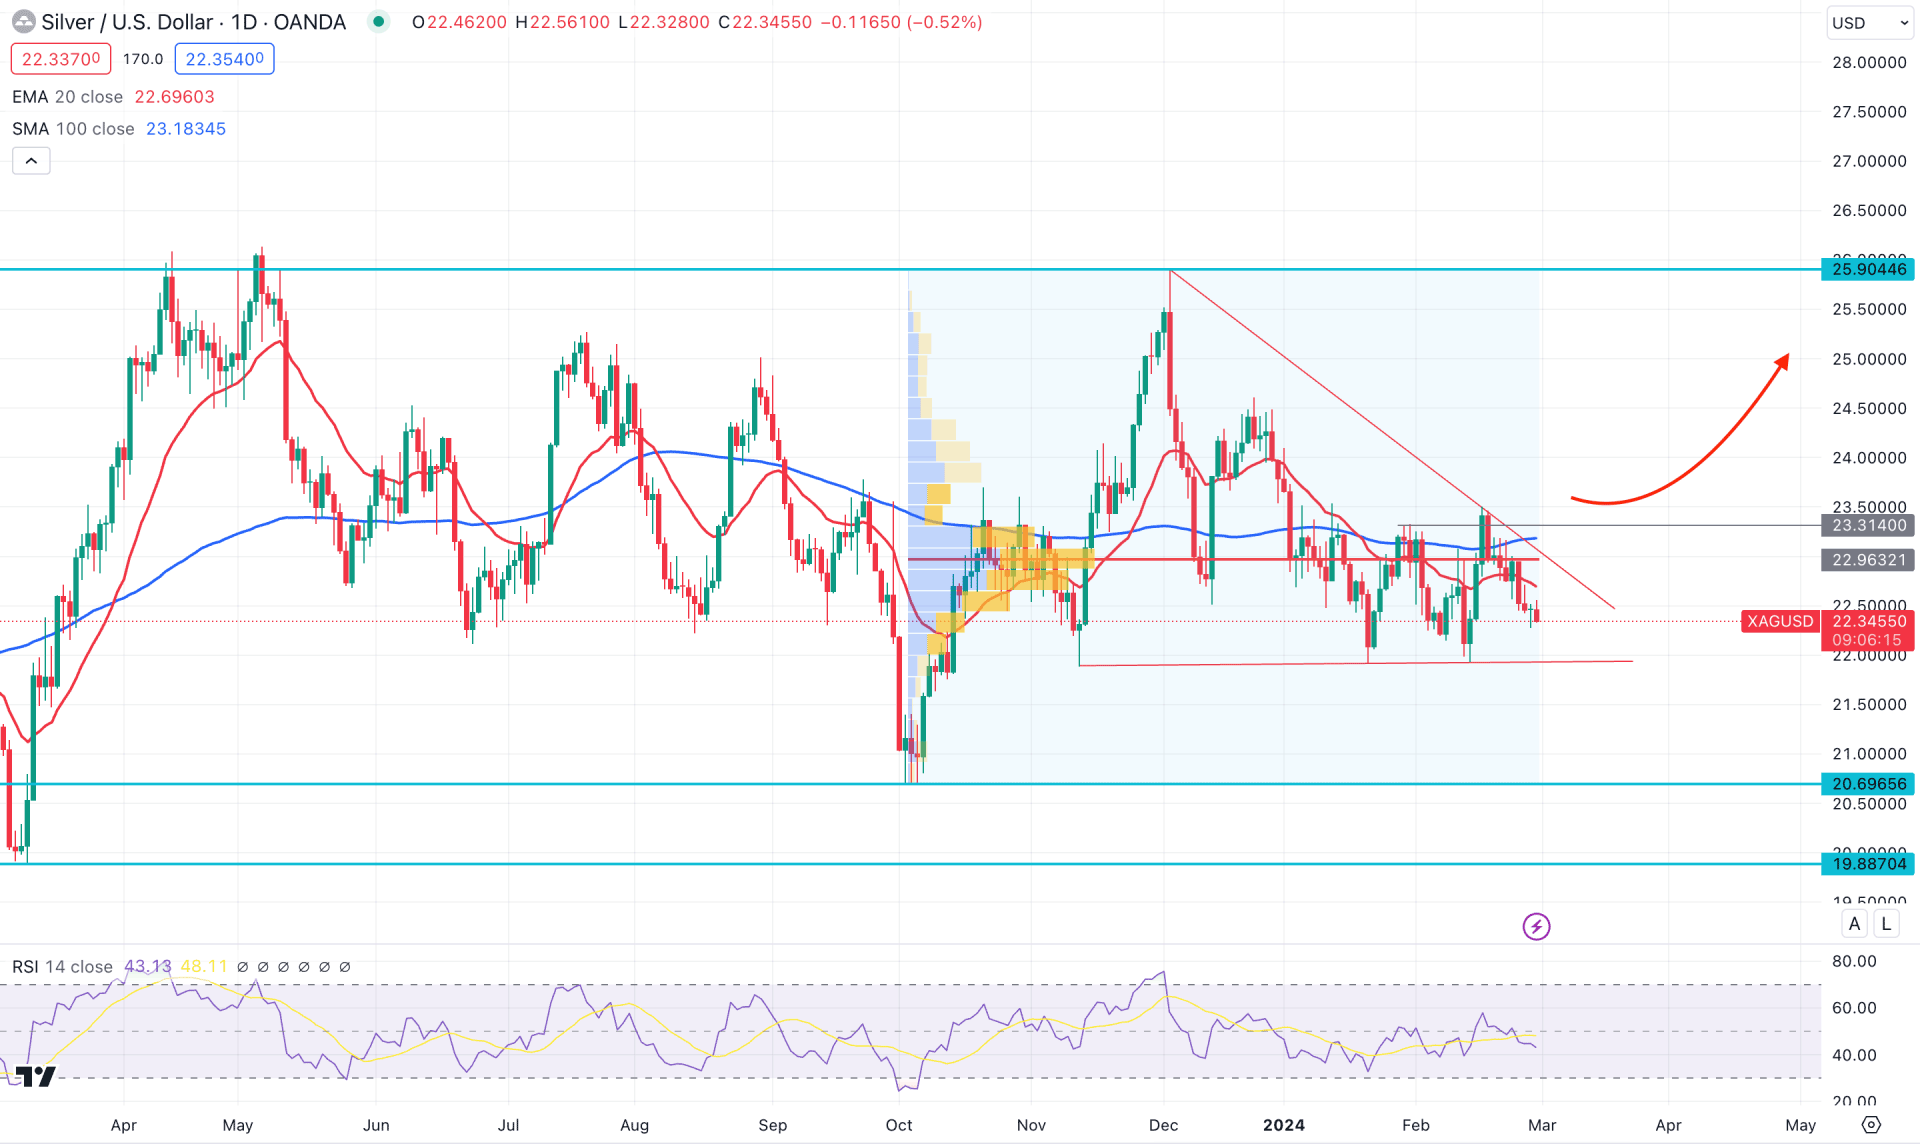
In the daily chart of XAGUSD, the ongoing price action is extremely corrective, as the recent dynamic 20-day EMA is flat within a range-bound market. In this condition, the ideal trading approach is to wait for a valid breakout with sufficient correction before anticipating a stable trend.
In the higher timeframe, the current monthly candle trades bearish, followed by a bearish close in January, which could indicate solid sellers' presence in the market, after a successful close in February. The weekly price suggests a possible inverse Head and Shoulders formation, where the neckline is present at the 25.90 level. In that case, a successful breakout above this level could indicate a strong bullish recovery with a trend trading opportunity.
The most active level since 3 October 2023 is at 22.96 level, which is above the current price. Therefore, a bullish breakout with a stable market above this crucial line is needed before anticipating a bull run.
The 100-day Simple Moving Average is above the current price with a sideways movement, while the current RSI is below the 50.00 line. Moreover, the ongoing consolidation took the price within a symmetrical triangle formation, where a bullish breakout with a valid daily close above the triangle resistance could be a long opportunity.
Based on the daily outlook of XAGUSD, the long-term sideways market needs a breakout, where the symmetrical triangle resistance could be a price level to look at. A daily candle above the 23.31 static level could be a high probable long opportunity in this pair, targeting the 25.00 psychological level.
On the other hand, a bearish break, followed by the dynamic 20-day EMA carry, could be a short opportunity. In that case, a daily close below the 21.90 level might lower the price towards the 20.69 support level.
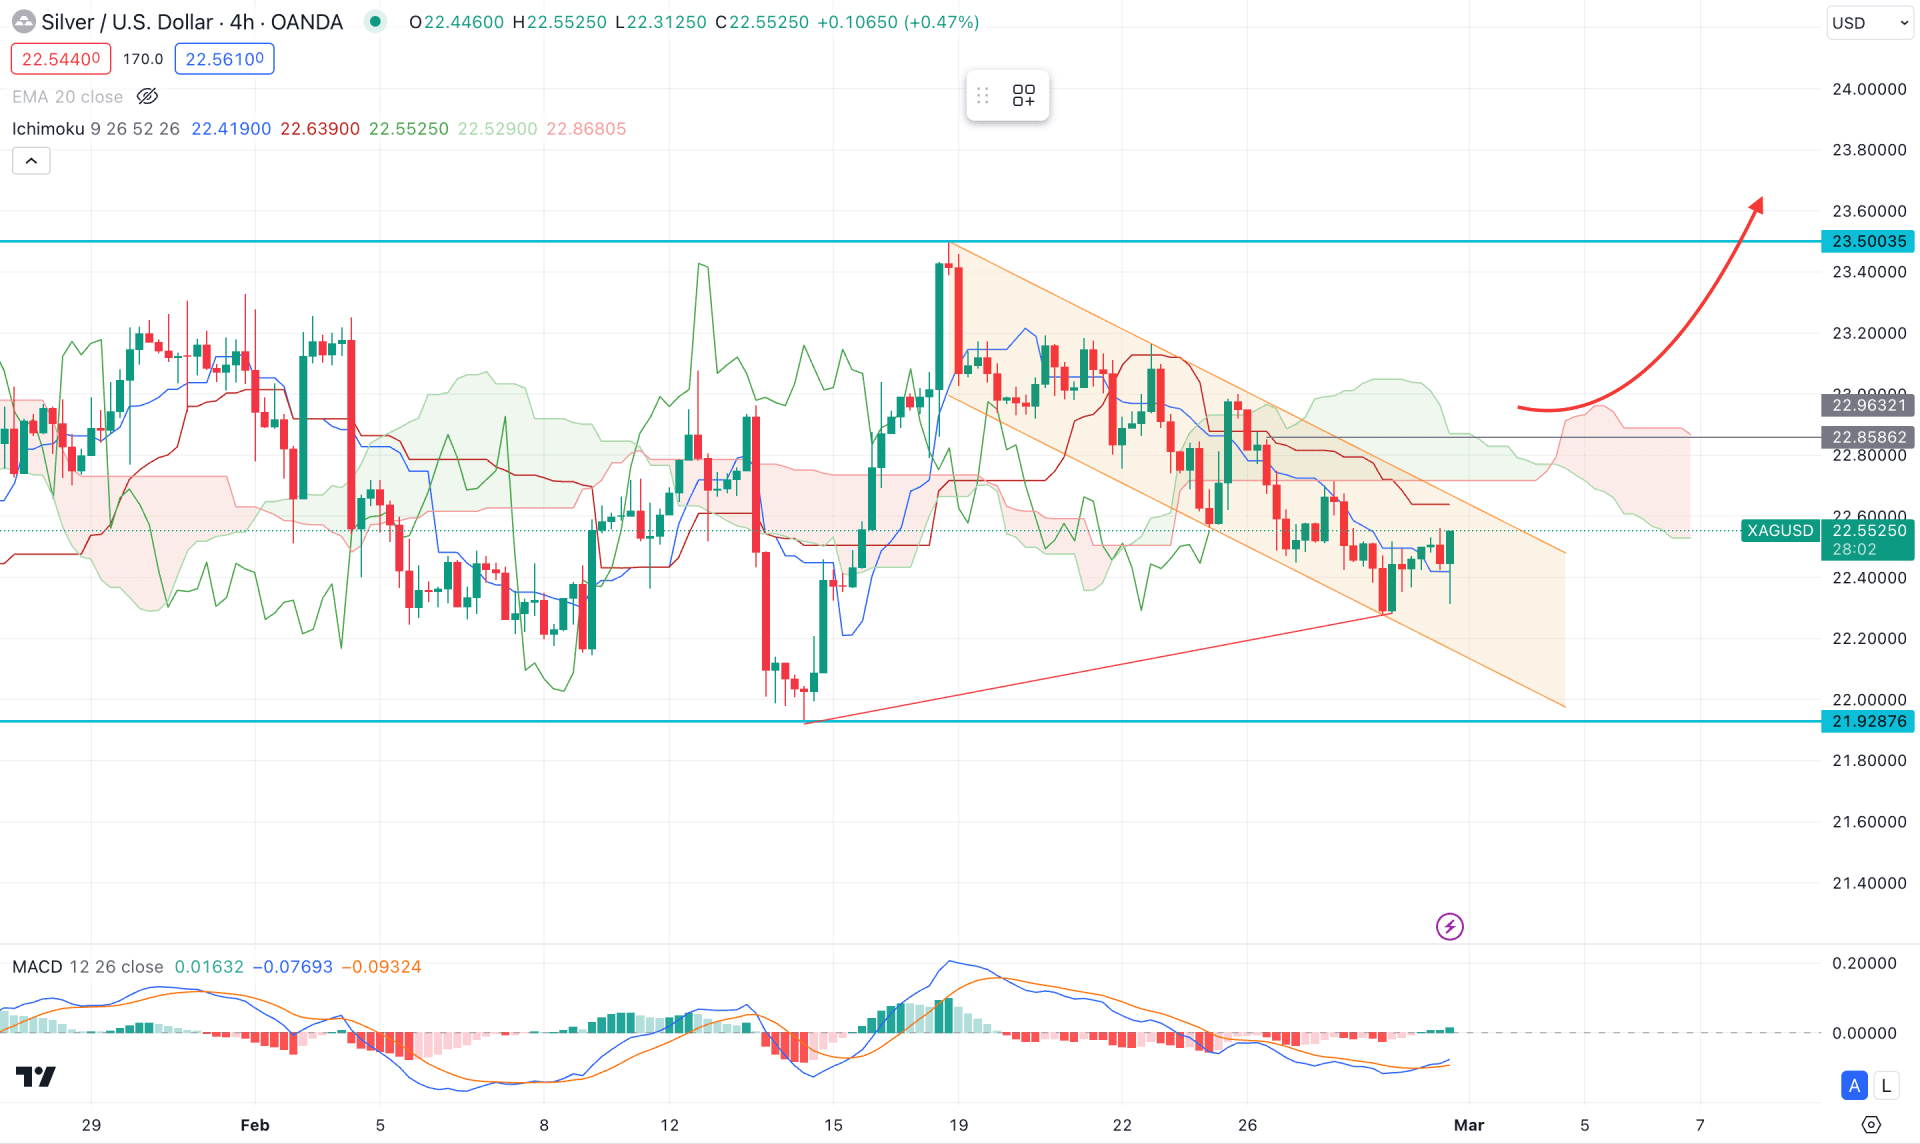
In the XAGUSD H4 chart, the recent price shows a mixed sentiment, where an ascending channel formation is visible. Moreover, the current price hovers below the dynamic Ichimoku Cloud zone, where the Senkou Span A is below the Senkou Span B in the future cloud.
In the secondary indicator window, a strong divergence is visible with the MACD Signal line, which failed to follow the price swing.
In this context, a valid channel breakout with an H4 close above the Kumo Cloud could be a potential long opportunity in this pair. On the other hand, the ongoing bearish continuation with a bearish rejection from the dynamic Kijun Sen level could be a strong bearish opportunity, targeting the 21.80 support line.
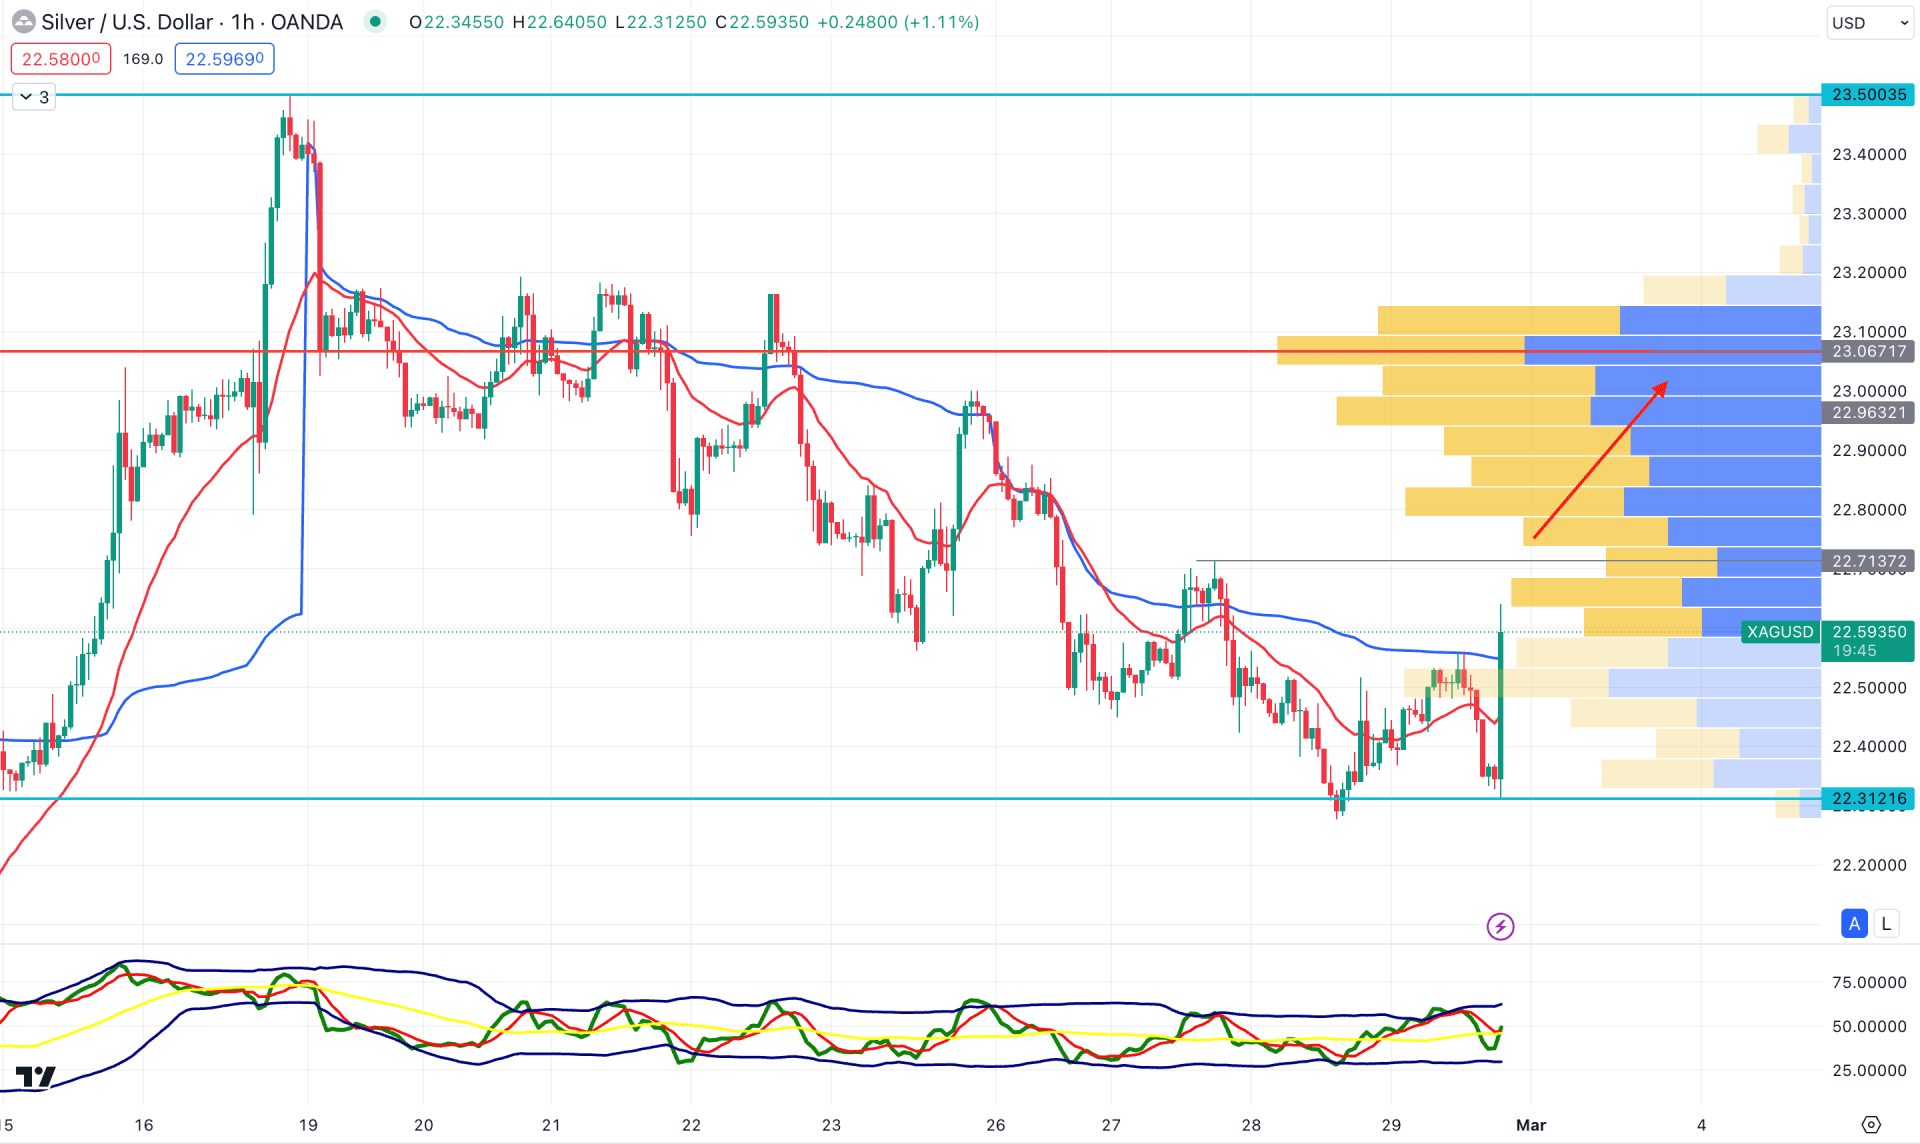
In the hourly chart, the recent price trades were bullish, followed by the economic releases, which made an hourly close above the dynamic 20 EMA line. However, the visible range high volume level is at 23.08 level, which is way above the current price. As the current price remains below the critical high volume level, we may expect a downside continuation at any time.
Based on this outlook, the ongoing buying pressure may extend above the 22.71 level but a bullish recovery above the 23.06 is needed before anticipating a long-term bullish trend.
Based on the current market outlook, XAGUSD is more likely to extend the bullish pressure in the coming days. However, the long-term bullish trend has not formed, which needs a valid recovery above the critical near-term resistance.


