Published: August 20th, 2020
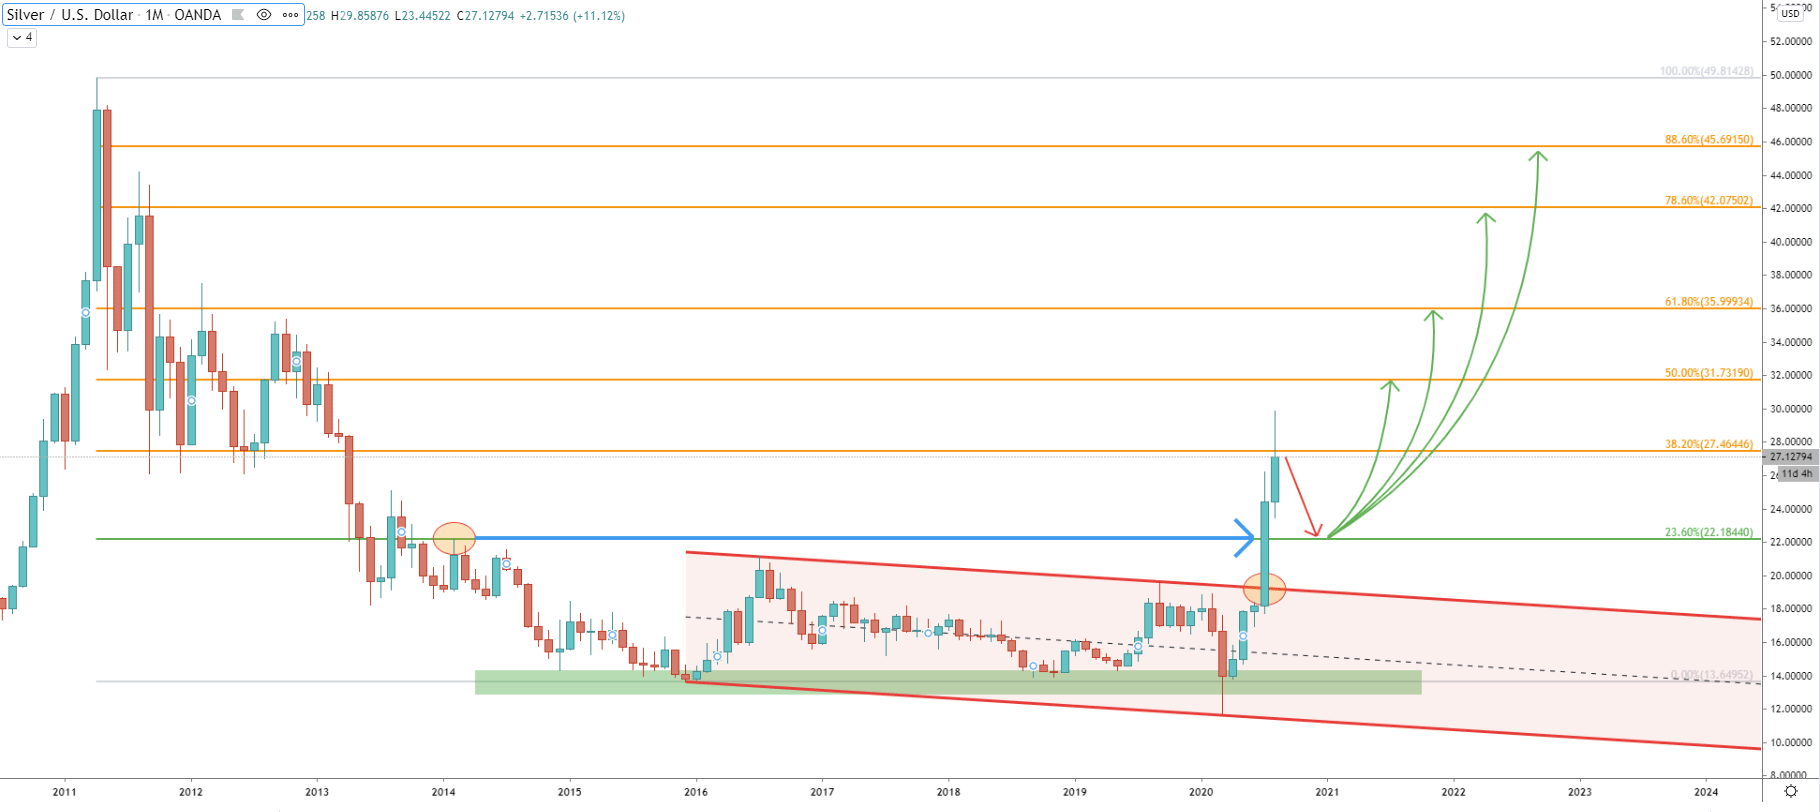
For over 4 years Silver price was struggling to make any substantial gains and it has been bouncing off the $13 support area multiple times. XAG/USD has been trading within the descending channel up until it broke above, which occurred just last month. The buying volume has been enormous and during the past 5 months, the price has risen from the $17.00, up to $29.85, which was the high produced on August 7.
This was a 116% rise in a matter of months, which emphasizes a great demand for precious metals in general and Silver in particular as an asset of safe-haven. Investors are likely to continue diversifying between Gold, Silver, etc in order to protect their purchasing power. This, in the long run, should result in a massive price increase in these assets. In regards to the XAG, the price can be expected to rise further, to test one of the Fibonacci retracement levels as can be seen on the Monthly chart.
However, right now Silver approached, and so far rejected the 38.2% Fibs at $27.46, which might lead to a correctional move to the downside. XAG/USD can test the 23.6% Fibonacci support at $22.18 before/if the price will continue to rise. This level acted as the resistance previously, back in February 2014, and now might act as the support, where long term buying opportunity can be presented.
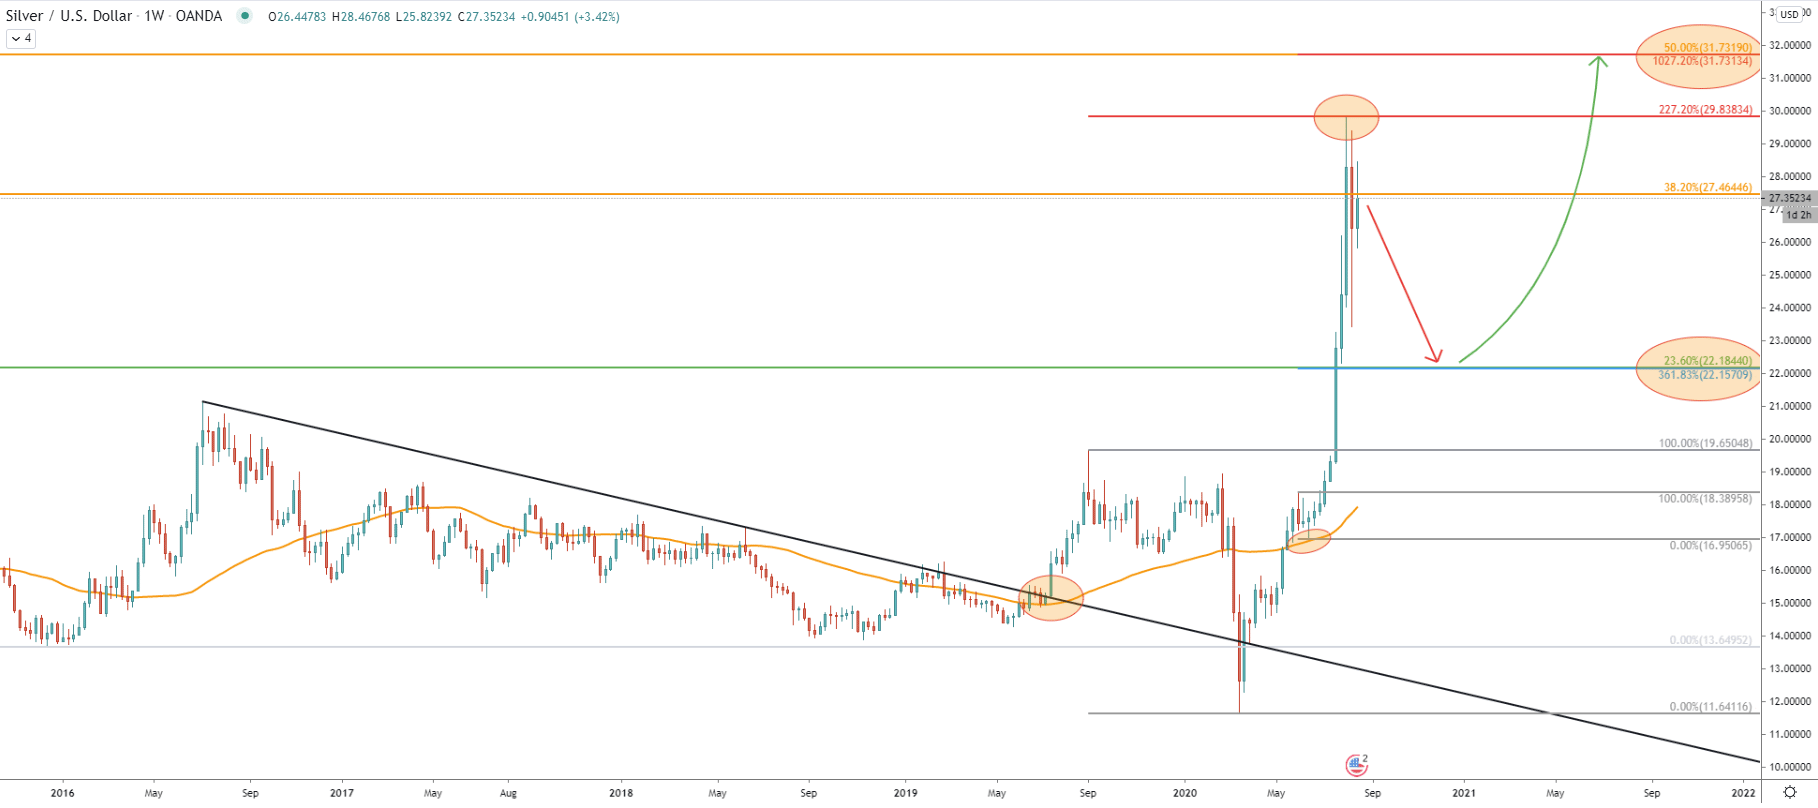
On the Weekly chart, Fibs were applied to the corrective wave down after price broke above the uptrend trendline. It shows that 227.2% Fibonacci retracement level has been acting as the resistance and was rejected cleanly when priced topped out. This is one of the first indications that the correction down is on its way.
Another Fibs was applied to the correctional wave down when Silver rejected the 50 Simple Moving Average back in June 2020. The 361.8% Fibs corresponds to 23.6% as per the Monthly chart, which is the expected target of the incoming correctional move down. But also, the 1027.2% retracement corresponds to the 50% Fibs as per the Monthly chart, making a $31.73 level even stronger resistance for the ongoing long term uptrend.
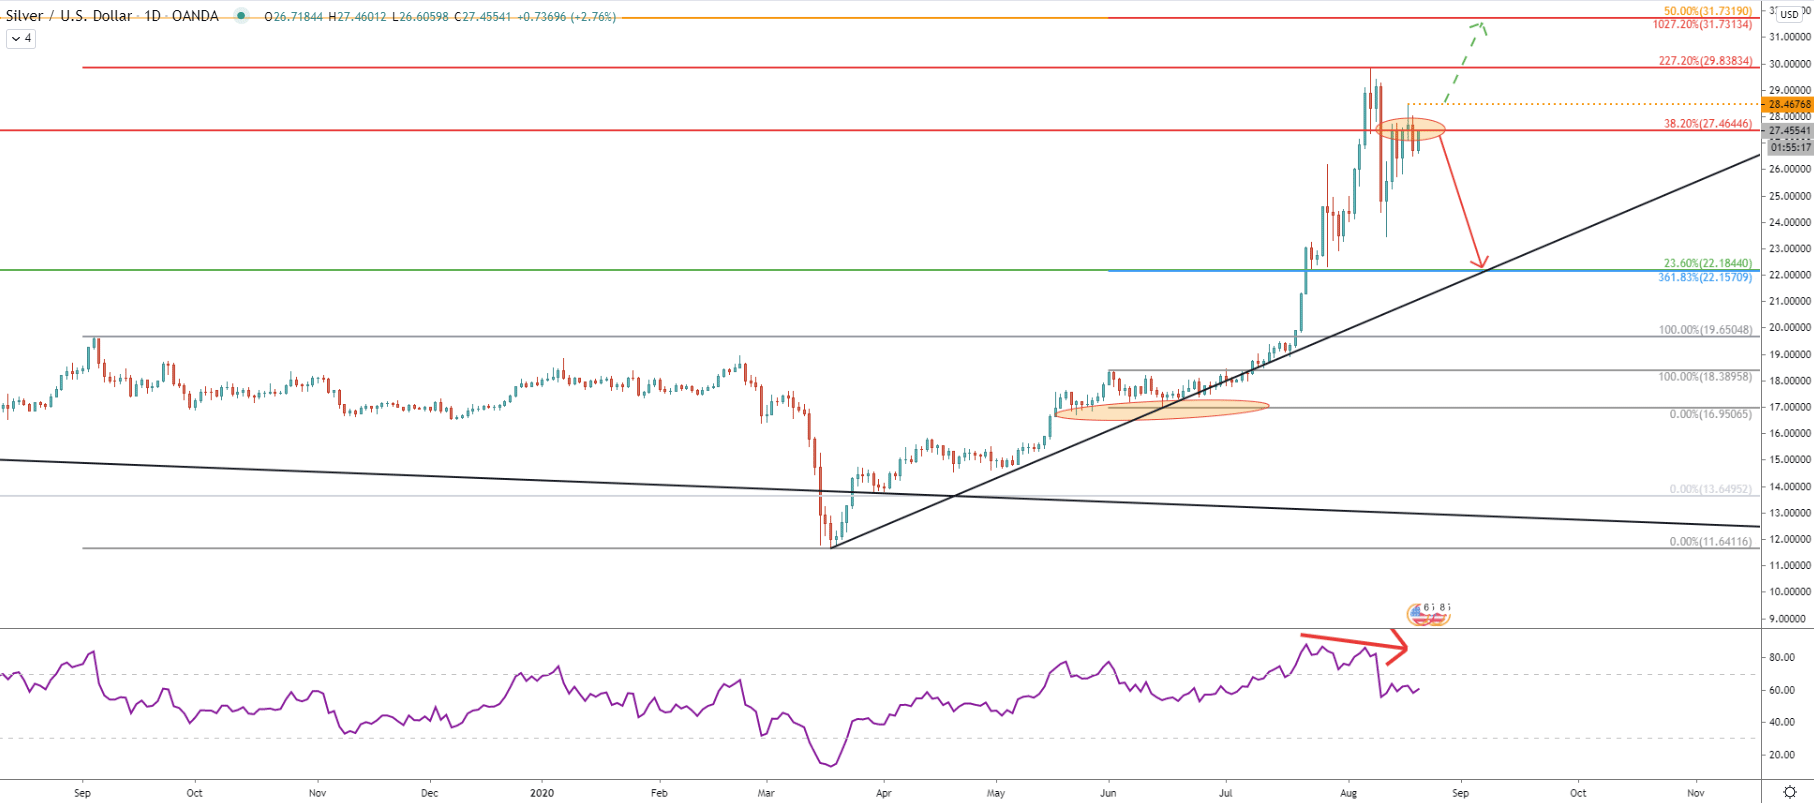
Moving on to the most-watched timeframe, the price has reached the top at $29.83 while the RSI oscillator formed a bearish divergence, suggesting a downside move. If we look at the 38.2% Fibs from the Monthly chart, currently this resistance level is being rejected. Price attempted to break below $27.46, although produced spike higher testing $28.46 and closed below the Fibonacci resistance. Therefore, as long as Daily close remains below the $28.46, the price of Silver will continue trending down. Based on the $22.20 support and uptrend trendline crossing, the downside target could be reached by mid-September. This could be the perfect timing for long term buyers and investors to buy Silver at a much cheaper price. But XAG can also move up and if there will be the daily close above the $28.46, the uptrend is highly likely to continue, at least towards the $31.73 resistance.
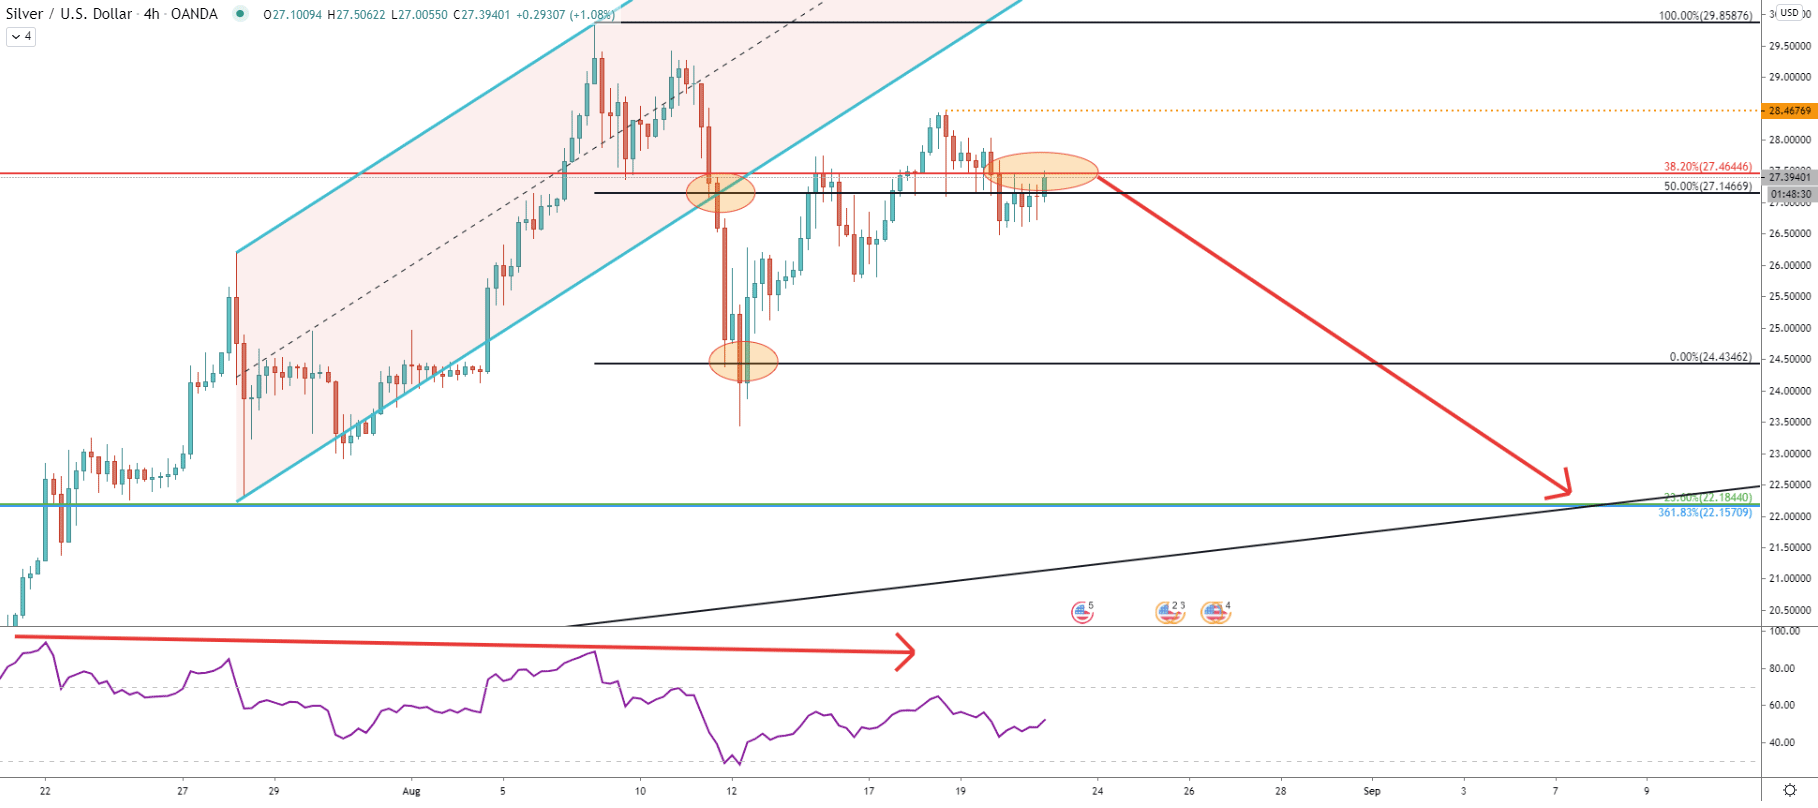
Silver broke below the ascending channel after the RSI formed a bearish divergence on the 4h timeframe. Fibonacci, applied to the channel breakout point shows that the final downside target at $24.43 has been broken, which opens doors for more decline. Downside pressure is likely to remain very high as long as the price stays near $27.46 resistance, which is being rejected as we write this analysis.
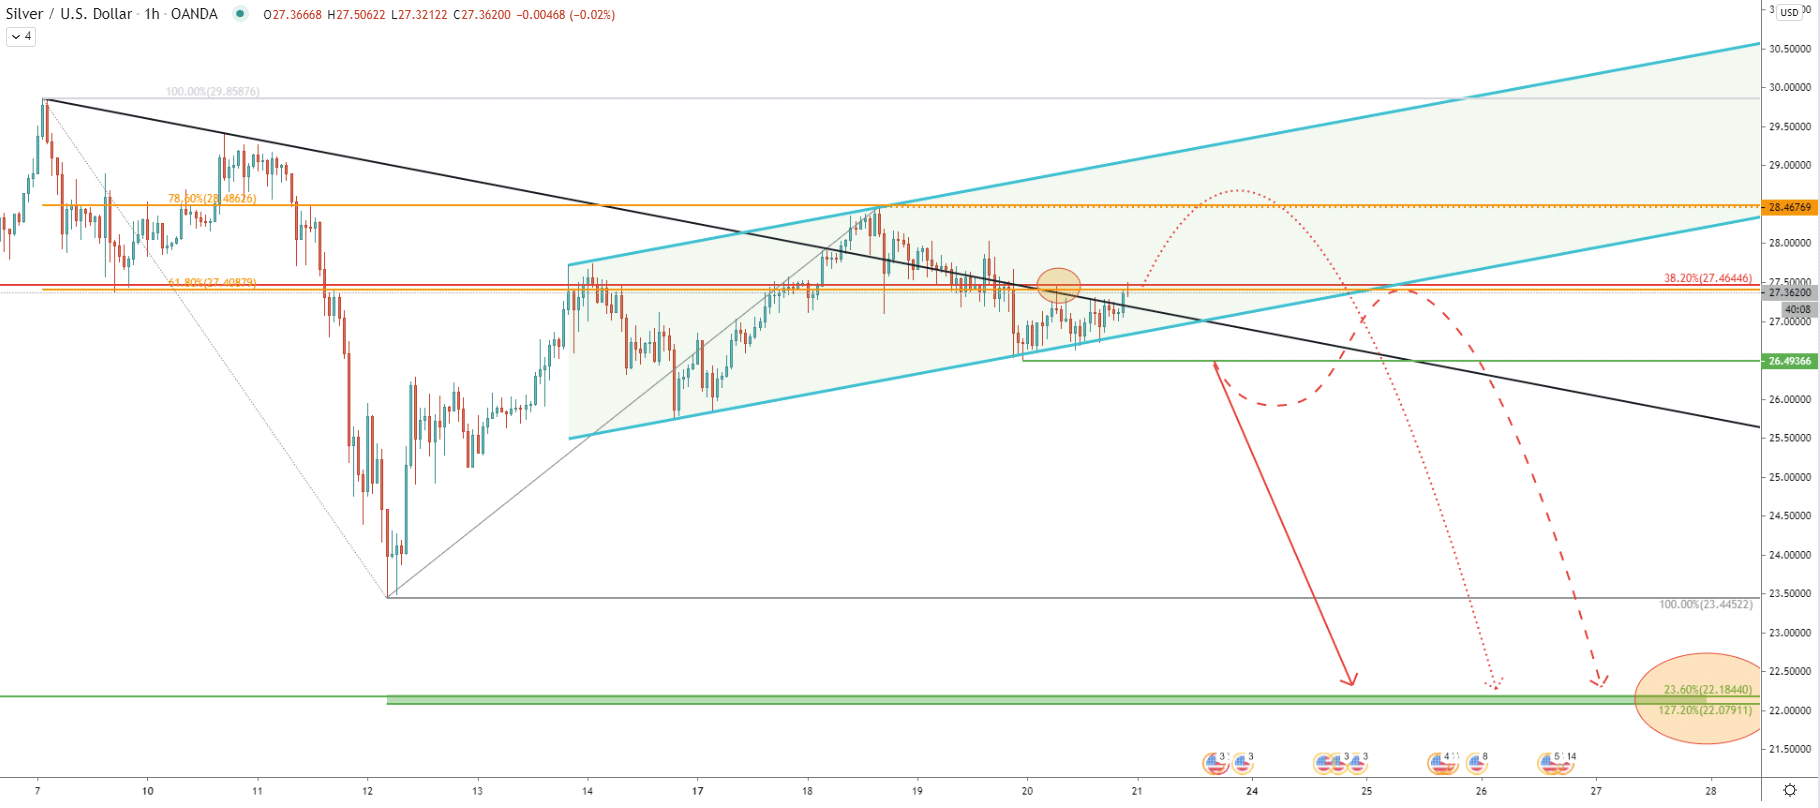
On the hourly chart, price is trading near the $27.46 resistance, which is now confirmed by two Fibonacci retracement levels. First is the 38.2% Fibs as per the Monthly chart, and second is the 61.8% Fibs applied to the corrective move down after Silver topped out. Right now price has stuck between the resistance and the $26.49 support, which is the low produced when XAG/USD rejected the lower trendline of the ascending channel.
There must be a breakout, either to the upside or to the downside in order to predict further price action with greater confidence. But upon the break above the resistance, Silver can be aiming towards the 78.6% Fibonacci resistance at $28.46, to produce a double top. On the other hand, Daily break and close below the $26.49, could be treated as a confirmation of the increased selling pressure, suggesting further price decline. The previously mentioned support area near $22.2 is confirmed now by two Fibs here. First is the 23.6% retracement level as per the Monthly chart, and the second is 127.2% retracement level of the Fibs applied to the corrective move up where 78.6% resistance was rejected.
Gold and Silver are in great demand, considering the ongoing global financial crisis. Over the long term, the price of Silver can double, triple, or even quadruple. Nonetheless, on the smaller timescale, XAG/USD could be correcting down to the mean, which might take a month or so. Perhaps only then, the best buying opportunity will present itself.
As per the Monthly chart, the nearest Fibonacci support level is located at the $22.20 area. This level is confirmed by other Fibonacci retracement indicators as well as the long term uptrend trendline. It could be that this support level will be tested sometime in September this year.
The probability of an uptrend remains extremely high. But it should be confirmed only after Daily close above the $28.46 resistance level. In this case, Silver is highly likely to continue trending up, with the nearest upside target at $31.73
Support: 26.49, 23.44, 22.22
Resistance: 28.46, 31.73, 36.00, 42.00, 45.69


