
Published: May 7th, 2025
Strong merchant base growth is helping Shopify, and first-quarter numbers will probably show this trend. Shopify handled a total Gross Merchandise Volume (GMV) of $1 trillion in the final quarter of 2024. In the fourth quarter of 2025, GMV grew 25.7% over time due to significant international growth, strong point of sale increases. It is anticipated that the same reasons drove the GMV gain in the quarter that will be reported.
In the quarter that will be reported, Shopify is anticipated to have benefited from the growing use of Shop Pay. New features like Shopify Balance for Plus, immediate payments, and flexible payment choices in Shopify Credit are anticipated to enhance cash flow management and encourage more merchants to use Shopify products.
The first-quarter membership solutions sales consensus is $621 million, representing a 21.5% year-over-year increase. At $1.71 billion, the Zacks Consensus Estimate for Merchant Systems indicates a 26.7% annual growth rate.
Shares of Shopify have performed better than those of its industry competitors, such as Alphabet GOOGL, Eventbrite EB, and The Trade Desk TTD. However, the shares of Alphabet, Eventbrite, and The Trade Desk fell 13.3%, 36%, and 52.8%, respectively, thus far this year.
Given its rising partner base and expanding merchant base, Shopify has bright future potential. The company continues to grow quickly in Europe and Japan and today holds 12% of the U.S. e-commerce market. North America continues to lag behind international growth, which is indicative of Shopify's growing global footprint.
Let's see the future price direction from the SHOP technical analysis:
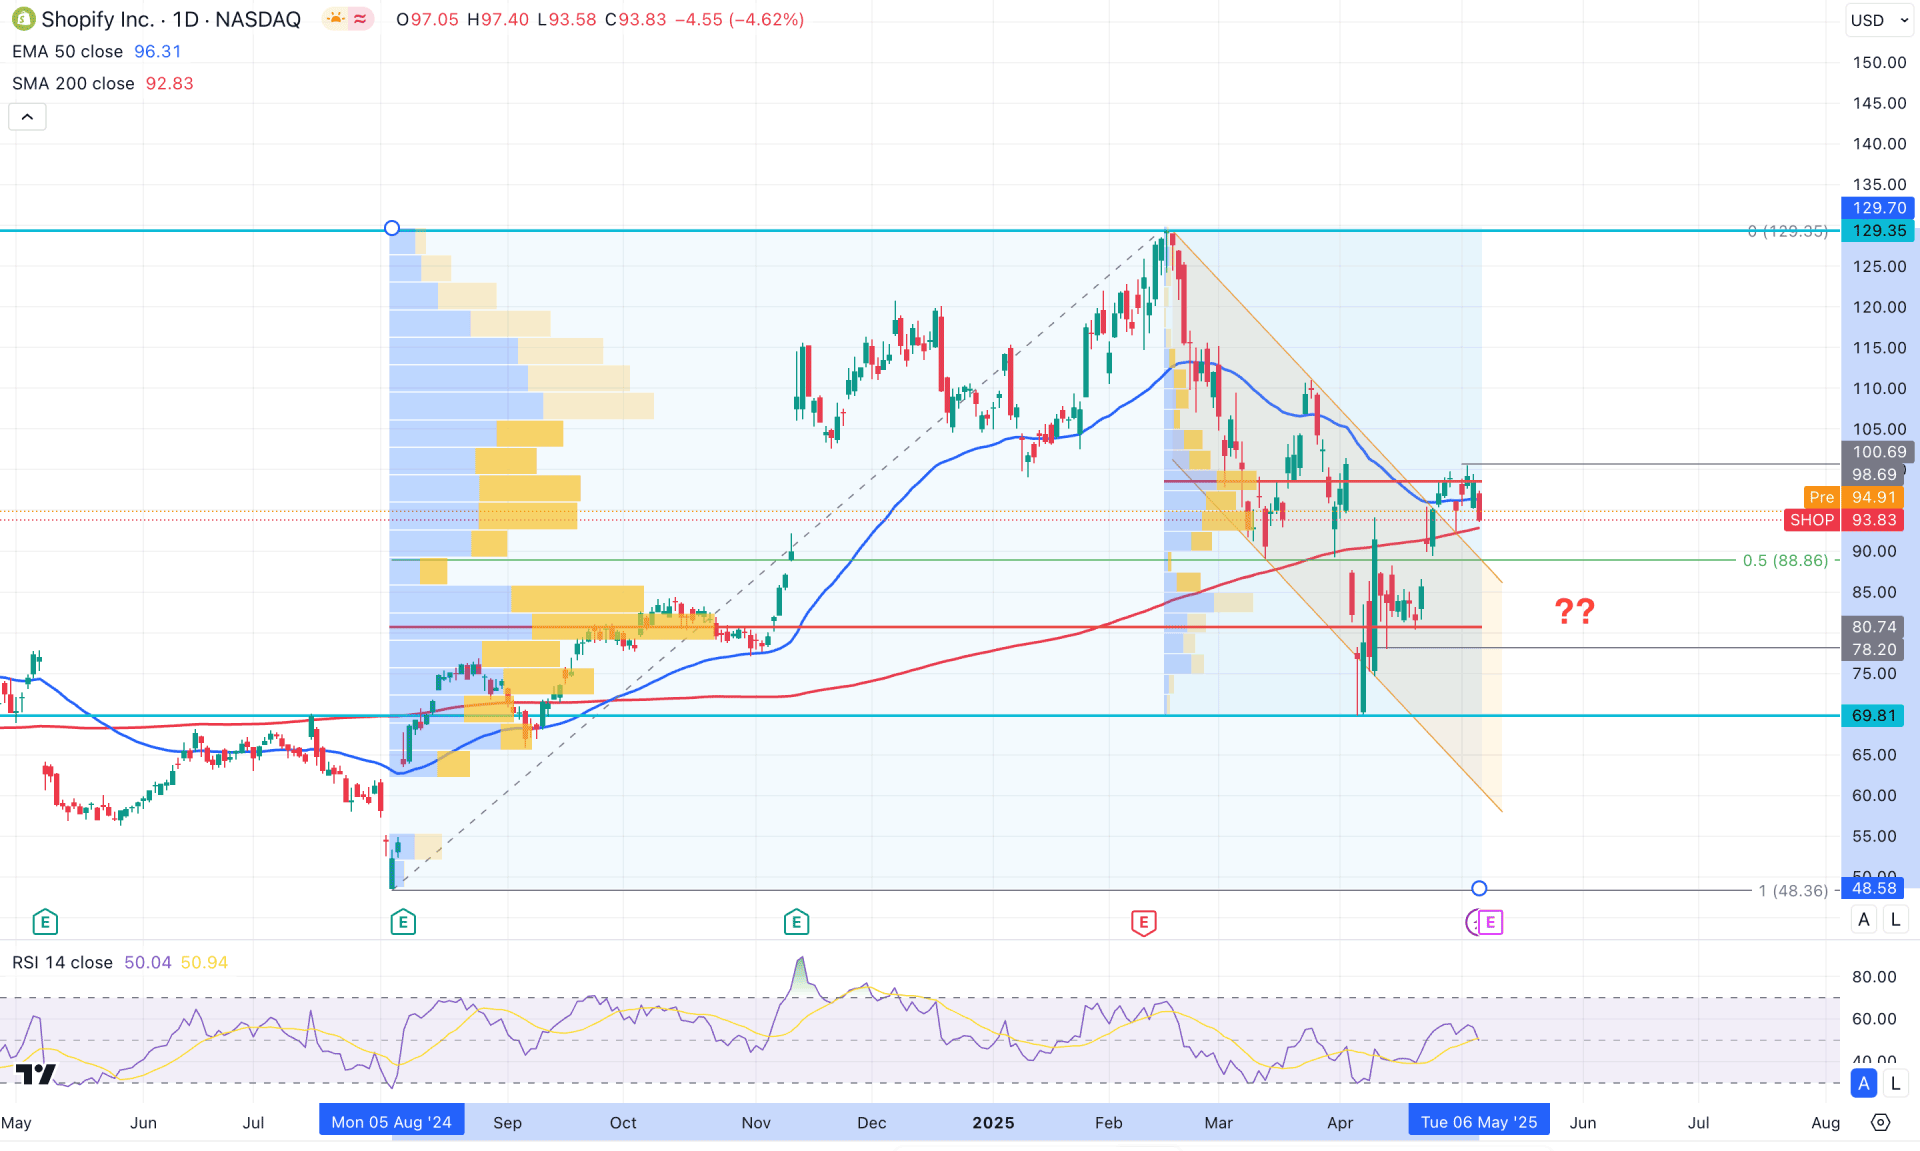
In the daily chart of Shopify, a strong bullish momentum is visible, as the price has shown consecutive higher highs, indicating stable strength. In this context, the primary objective would be to look for long trade opportunities until at least two new swing lows are formed.
In the broader context, the most recent monthly candle closed as a hammer candlestick, signaling the elimination of sellers from the market. Although this is a primary bullish signal, further confirmation may come once the price breaks above the 101.55 monthly resistance. Additionally, a decent bullish recovery is visible on the weekly timeframe, and a new swing high formation could validate a potential "V-shaped" recovery.
In terms of volume structure, the highest activity level from August 2024 is at the 80.74 level, which lies below the current price. Another significant volume level from the February 2025 peak is at 98.69, just above the current price. Overall, the volume profile presents mixed sentiment, but a recovery above the 100.00 psychological level could validate a potential long opportunity.
On the main price chart, a descending channel breakout is visible. The current price is consolidating sideways above the channel resistance. So far, no significant bearish recovery has been observed following the breakout, but further signals are needed to confirm a potential bull run.
The dynamic 200-day SMA and 50-day EMA are both below the current price and converging, indicating a confluence of buying pressure. Additionally, a potential double-bottom formation is visible in the Relative Strength Index (RSI), which is hovering sideways above the 50.00 level.
Based on the daily market outlook, some bearish correction is still possible as the price moves sideways above the channel resistance. However, a strong bullish breakout with a daily candle closing above the 100.69 swing high could present an aggressive long opportunity, targeting the 120.00 level.
On the other hand, a downside retracement followed by a bullish rejection from the 85.00–75.00 zone could offer another long opportunity, especially if the market holds above the 50-day EMA.
An alternative trading approach would be to look for a bearish daily candle closing below the 78.00 level, with consolidation beneath it. In that case, bearish momentum could extend, and the price may revisit the $50.00 psychological level before forming a potential rebound.
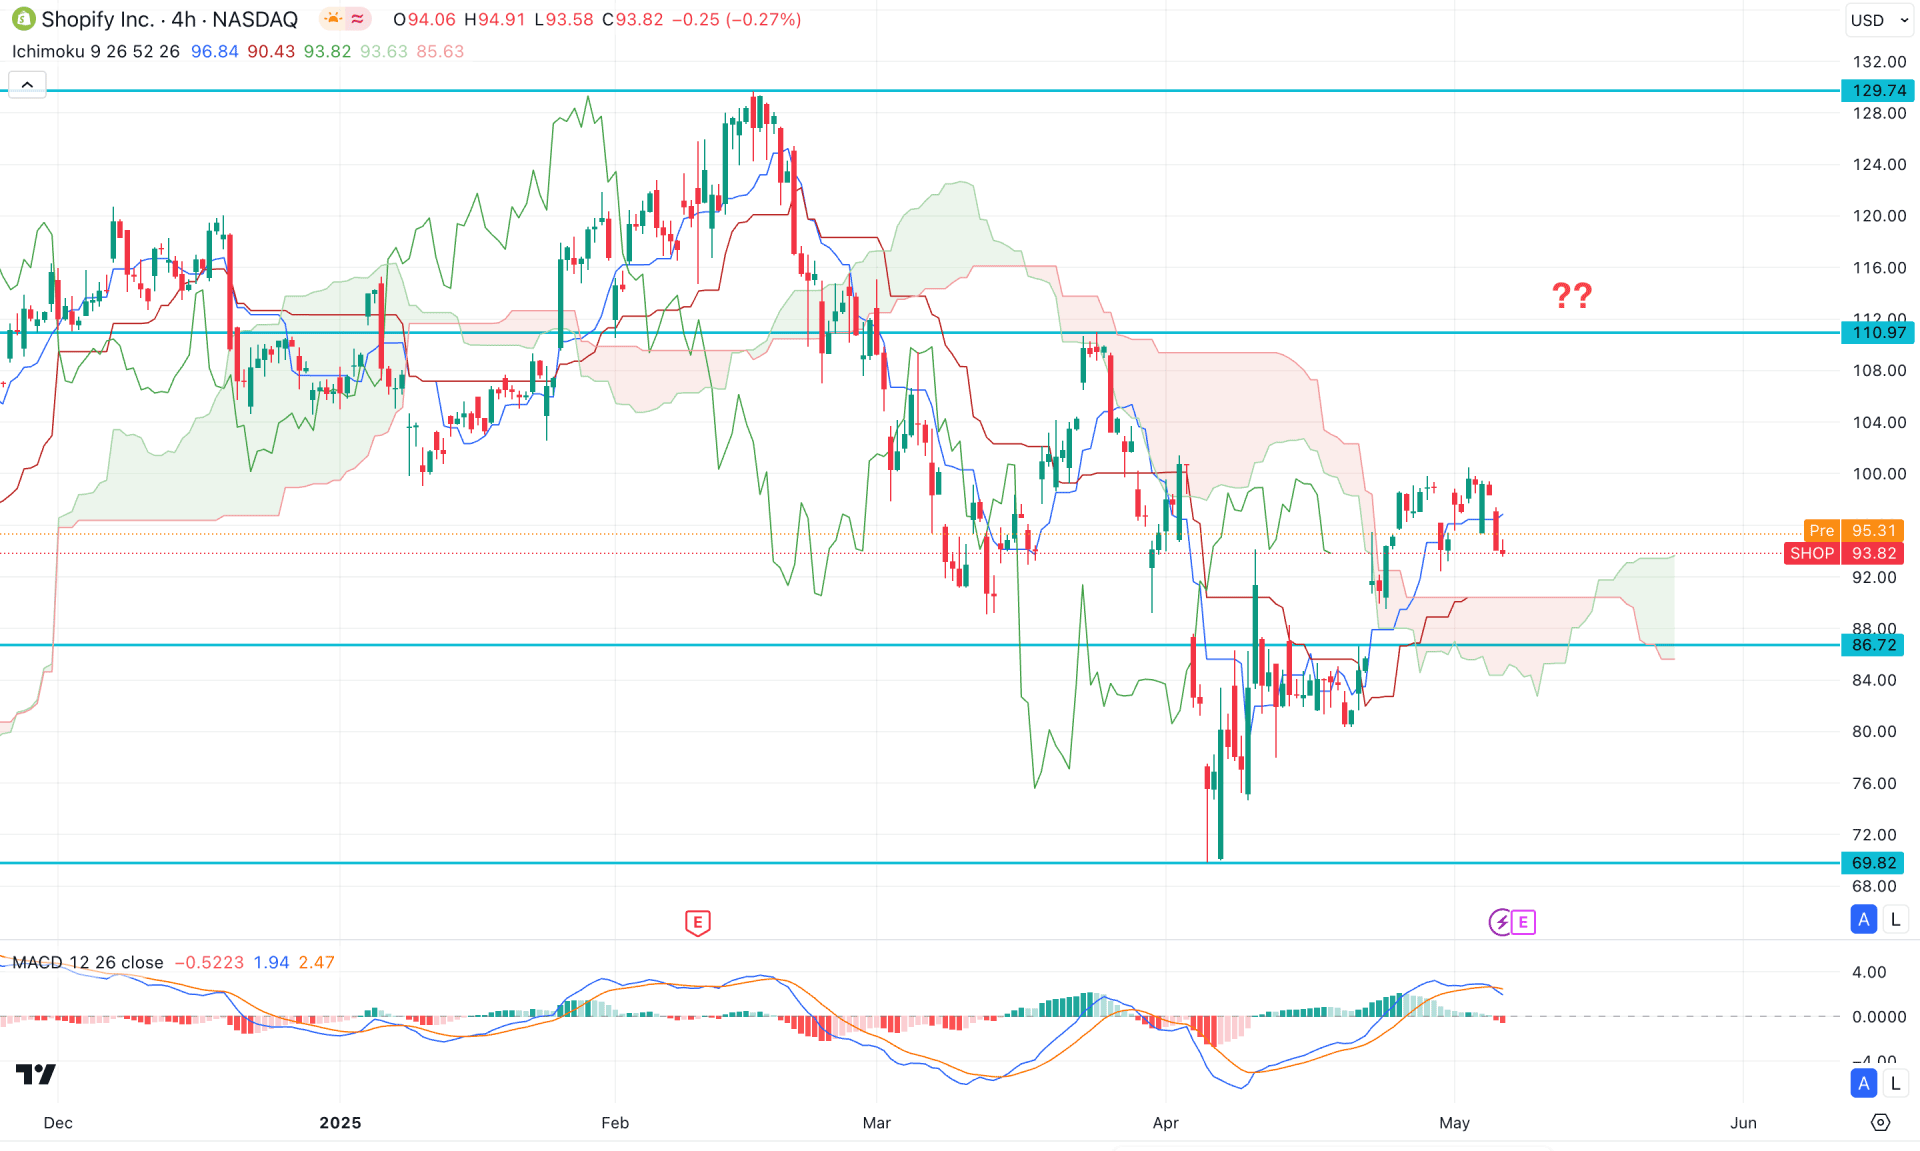
On the four-hour timeframe, market momentum is bullish even though the most recent price is above the cloud support. The future cloud has flipped position, signalling an early buy signal, while the Kijun-sen is below the current price. However, the most recent price action appears very corrective, suggesting that more confirmation is needed before anticipating a bullish continuation.
In the secondary indicator window, the MACD signal line has found a ceiling and formed a bearish crossover at the top. Meanwhile, the histogram remains bearish, as indicated by multiple red vertical bars.
Based on this outlook, more selling pressure might emerge. A bearish H4 candle below the 86.722 level could open a short opportunity targeting the 68.00 level.
On the other hand, a bullish scenario is possible as long as the price remains below the 110.97 resistance level. A bullish break above the 100.44 swing high could test the 110.97 resistance, and a breakout above this level with a strong bullish candle could validate a long-term bullish opportunity.
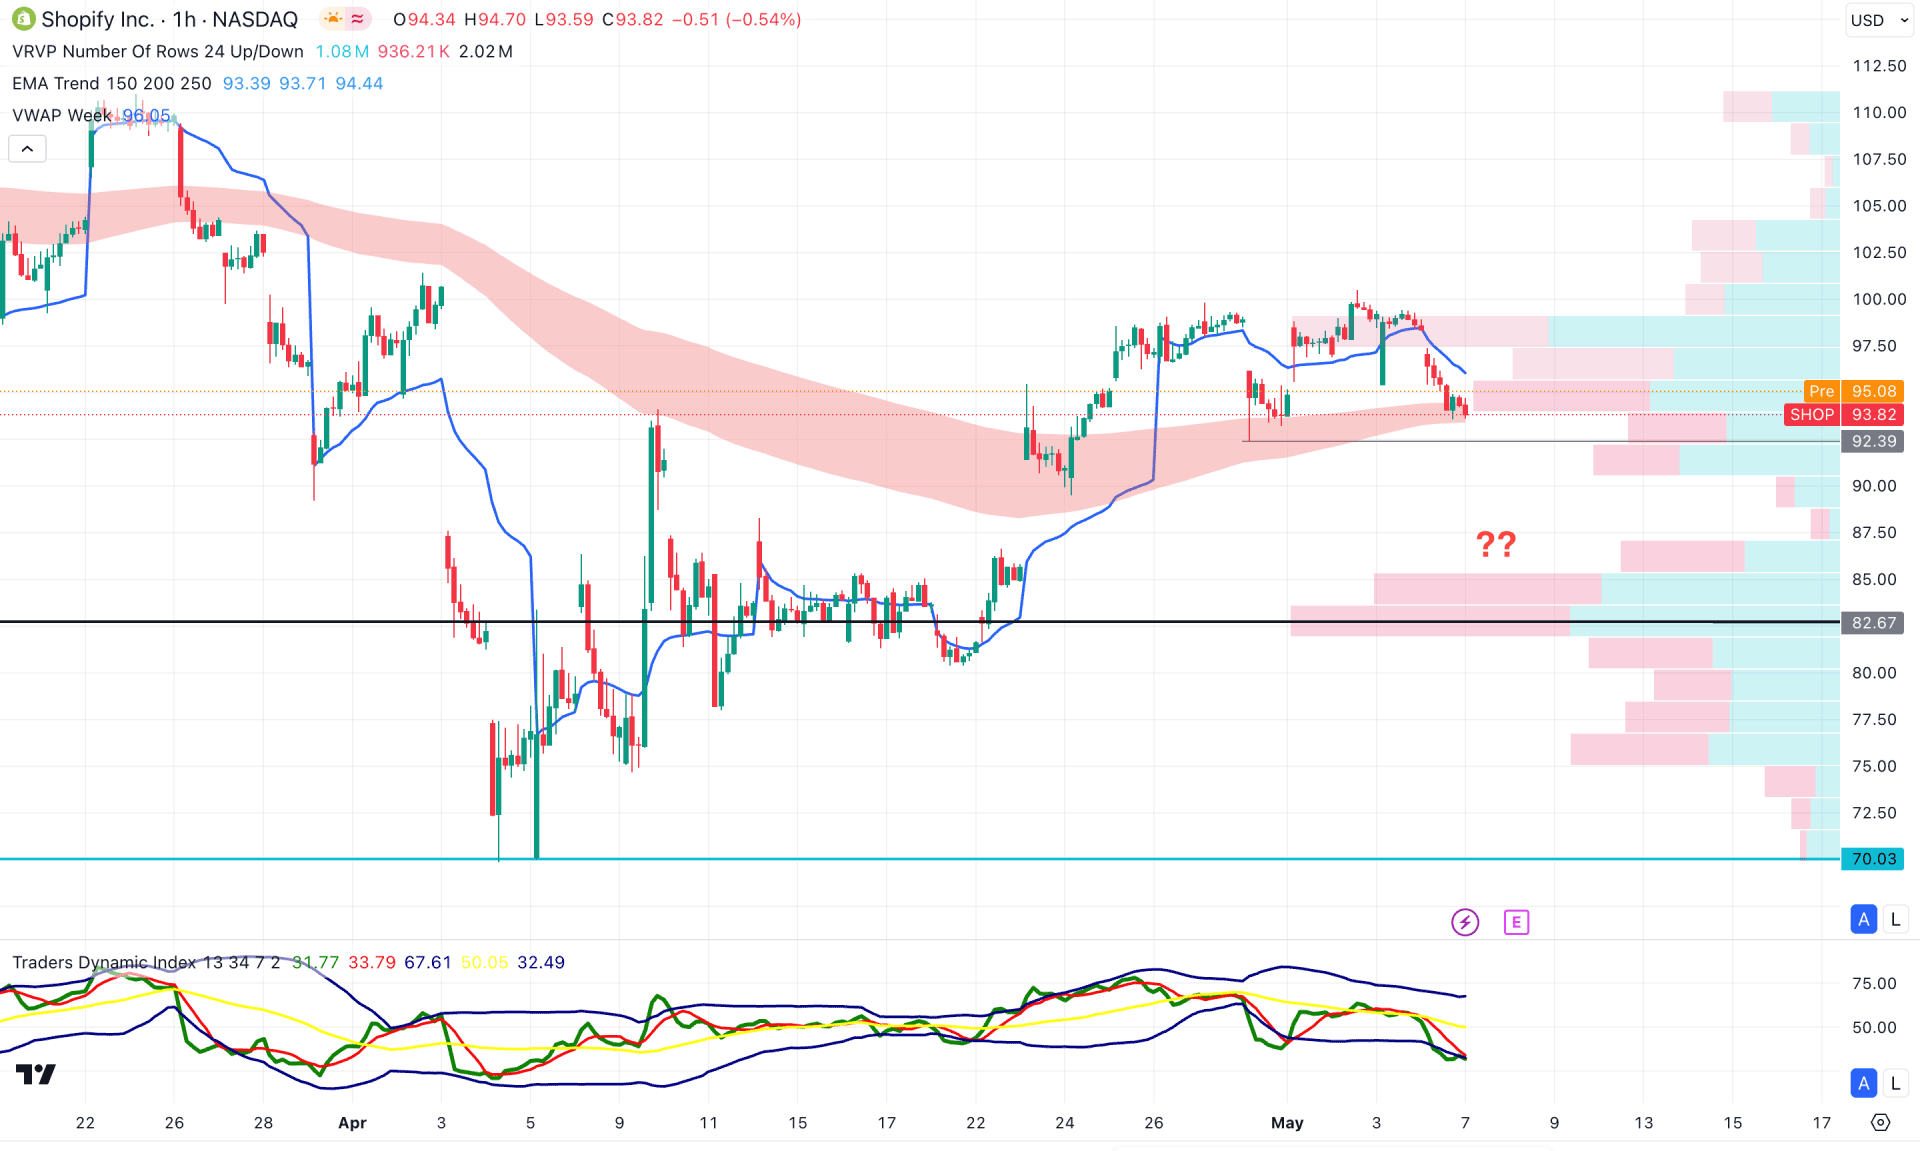
In the hourly time frame, the recent price trades at a corrective buying pressure as the visible range high volume line is below the current price. Moreover, the Moving Average wave is also below the current price, working as an immediate support.
In the secondary indicator window, the Traders Dynamic Index (TDI) remains at the lowest point in a month, suggesting lower trading activity.
Based on this outlook, the hourly chart shows more downside recovery, where a bearish H1 candle below the 92.39 level could extend the selling pressure. However, any potential bullish recovery from the 90.00 to 80.00 zone with an hourly candle above the VWAP could offer a long opportunity.
Based on the current market outlook, SHOP is more likely to offer a decent long opportunity in the coming days. As the intraday price is sideways, more downside pressure is still pending before forming a bullish signal.


