
Published: August 2nd, 2023
Shopify anticipates a comparable year-over-year revenue growth rate in the second quarter of 2023 compared to the first quarter. According to a prominent analyst, revenues are projected to reach $1.62 billion, representing a significant increase of 25.22 percent compared to the same quarter last year.
Estimations of earnings per share remain unchanged over the past 30 days at 6 cents. Shopify reported a loss of 3 cents per share for the same period in the prior year.
The forthcoming results for the second quarter of 2023 are anticipated to be impacted by the difficult macroeconomic environment, rising inflation, and increased interest expenses. Additionally, conservative consumer spending may have hindered the company's top-line expansion.
Shopify's strategic investments in cutting-edge e-commerce solutions are anticipated to drive the expansion of its merchant base despite these obstacles. Notably, the Point-of-Sale (POS) Pro solution has acquired popularity among prominent retailers and well-known brands, contributing to the anticipated top-line growth in the upcoming quarter.
In addition, Merchant Solutions revenues are anticipated to have increased by 31.1% year-over-year to $1.13 billion in the first quarter of 2023, driven by robust Gross Merchandise Volume (GMV).
Let’s see the upcoming price direction of this stock from the Shopify stock (SHOP) technical analysis:
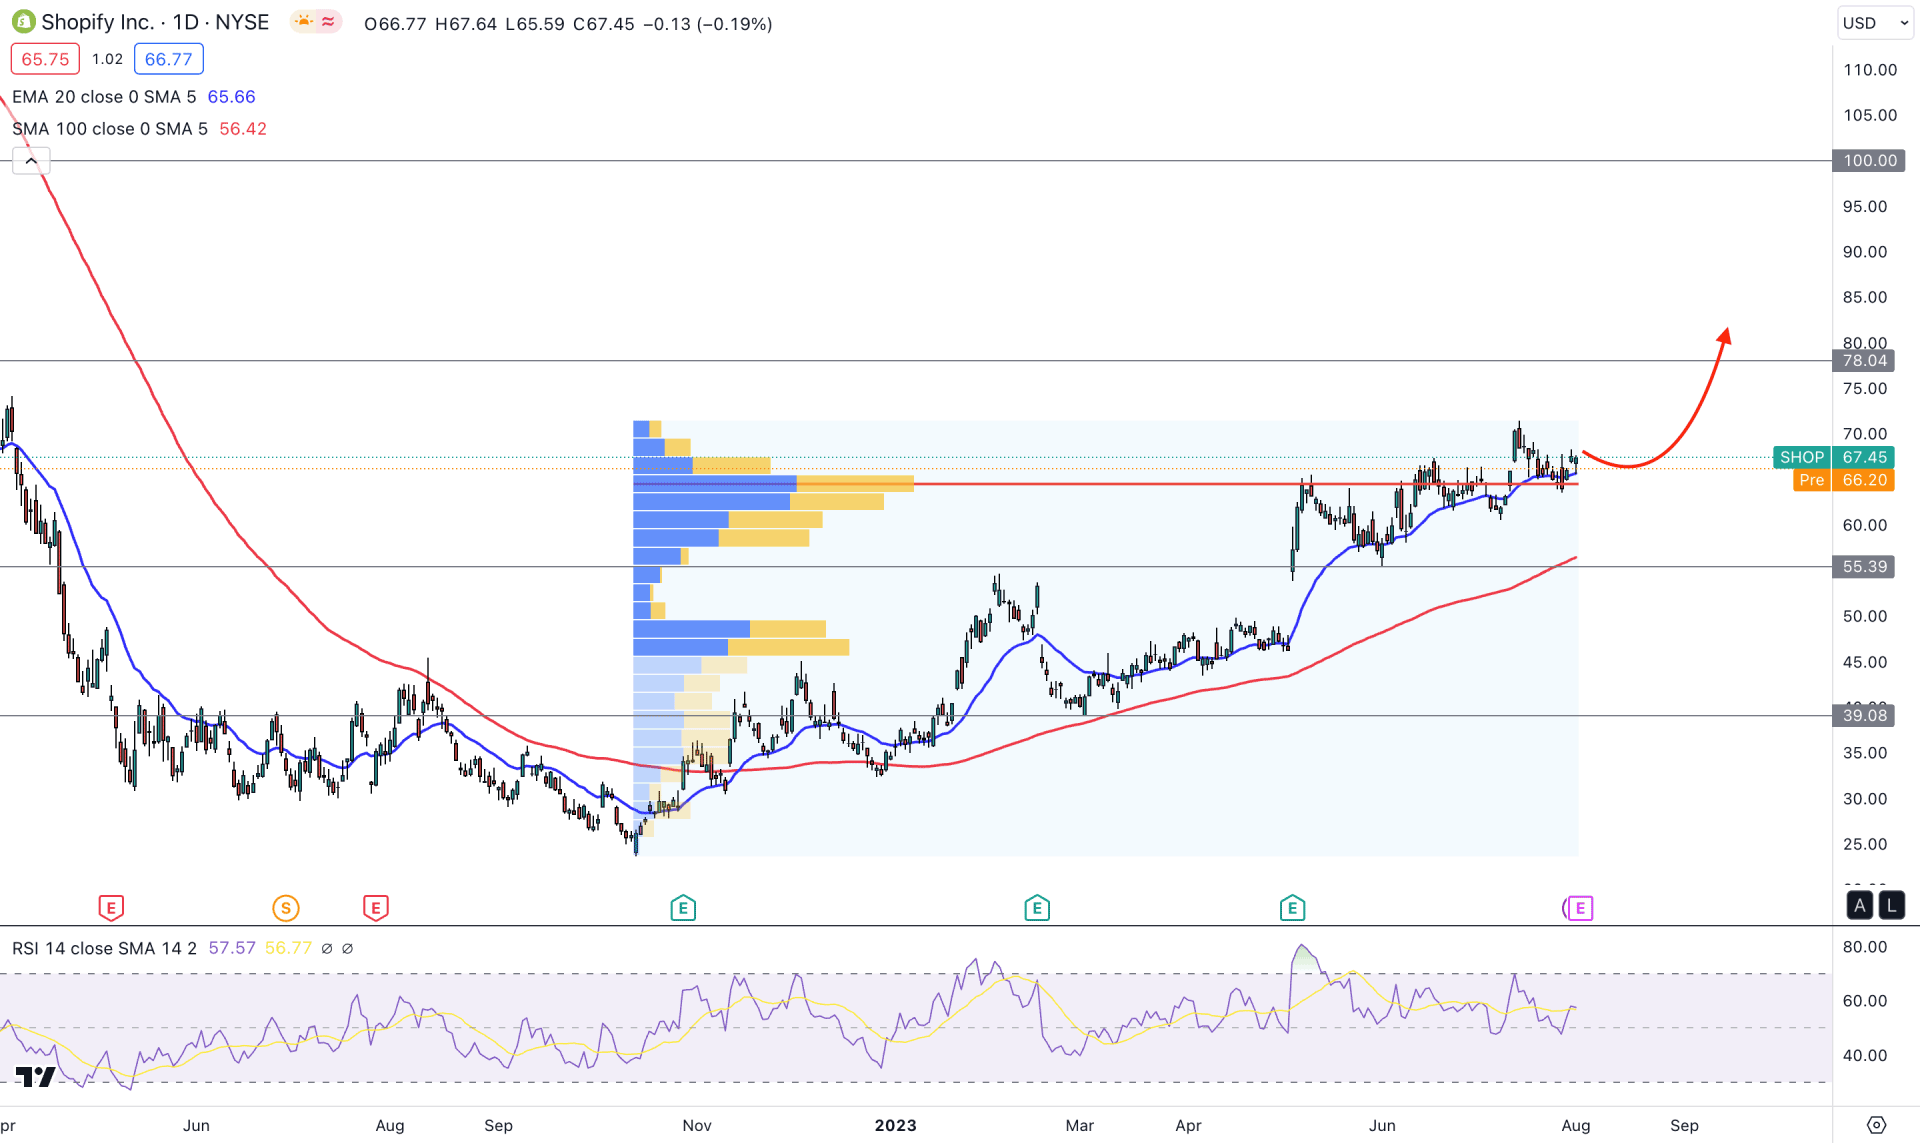
In the daily price of SHOP, a remarkable, bullish recovery is seen in the daily price, which came after a long bearish trend. In the current price structure, the 23.79 level could be a solid bottom from where the recent upward momentum has come. Therefore, the primary intention of this instrument is to look for long trades based on the U-shape recovery.
The buying momentum is potent in the higher timeframe price action as the latest monthly candle closed bullish with a new higher high formation. Also, the weekly price suggests a trend continuation opportunity where the recent candlesticks were corrective within a bullish trend.
In the fixed range volume structure, the highest trading volume level since 10 October 2022 is at 64.40 level, which is just below the current price. It is a sign that bulls are still interested in buying this stock, which could increase the bullish probability.
In the daily price, the 100-day Simple Moving Average is below the current price with an upward slope, which suggests that the medium-term outlook is bullish. The same structure is available for the 20-day Exponential Moving Average, which acts as a confluence support at the high-volume area.
The indicator window shows a corrective structure, where the current 14-period Relative Strength Index (RSI) shows a corrective momentum as it remains closer to the 50.00 area.
Based on the daily price outlook, the bullish possibility is potent, where a bullish rebound from the 20-day EMA could validate the buying possibility, targeting the 100.00 psychological level.
The alternative trading approach is to look for the price to come below the 55.39 level with a bearish D1 candle, which could lower the price toward the 39.00 area.
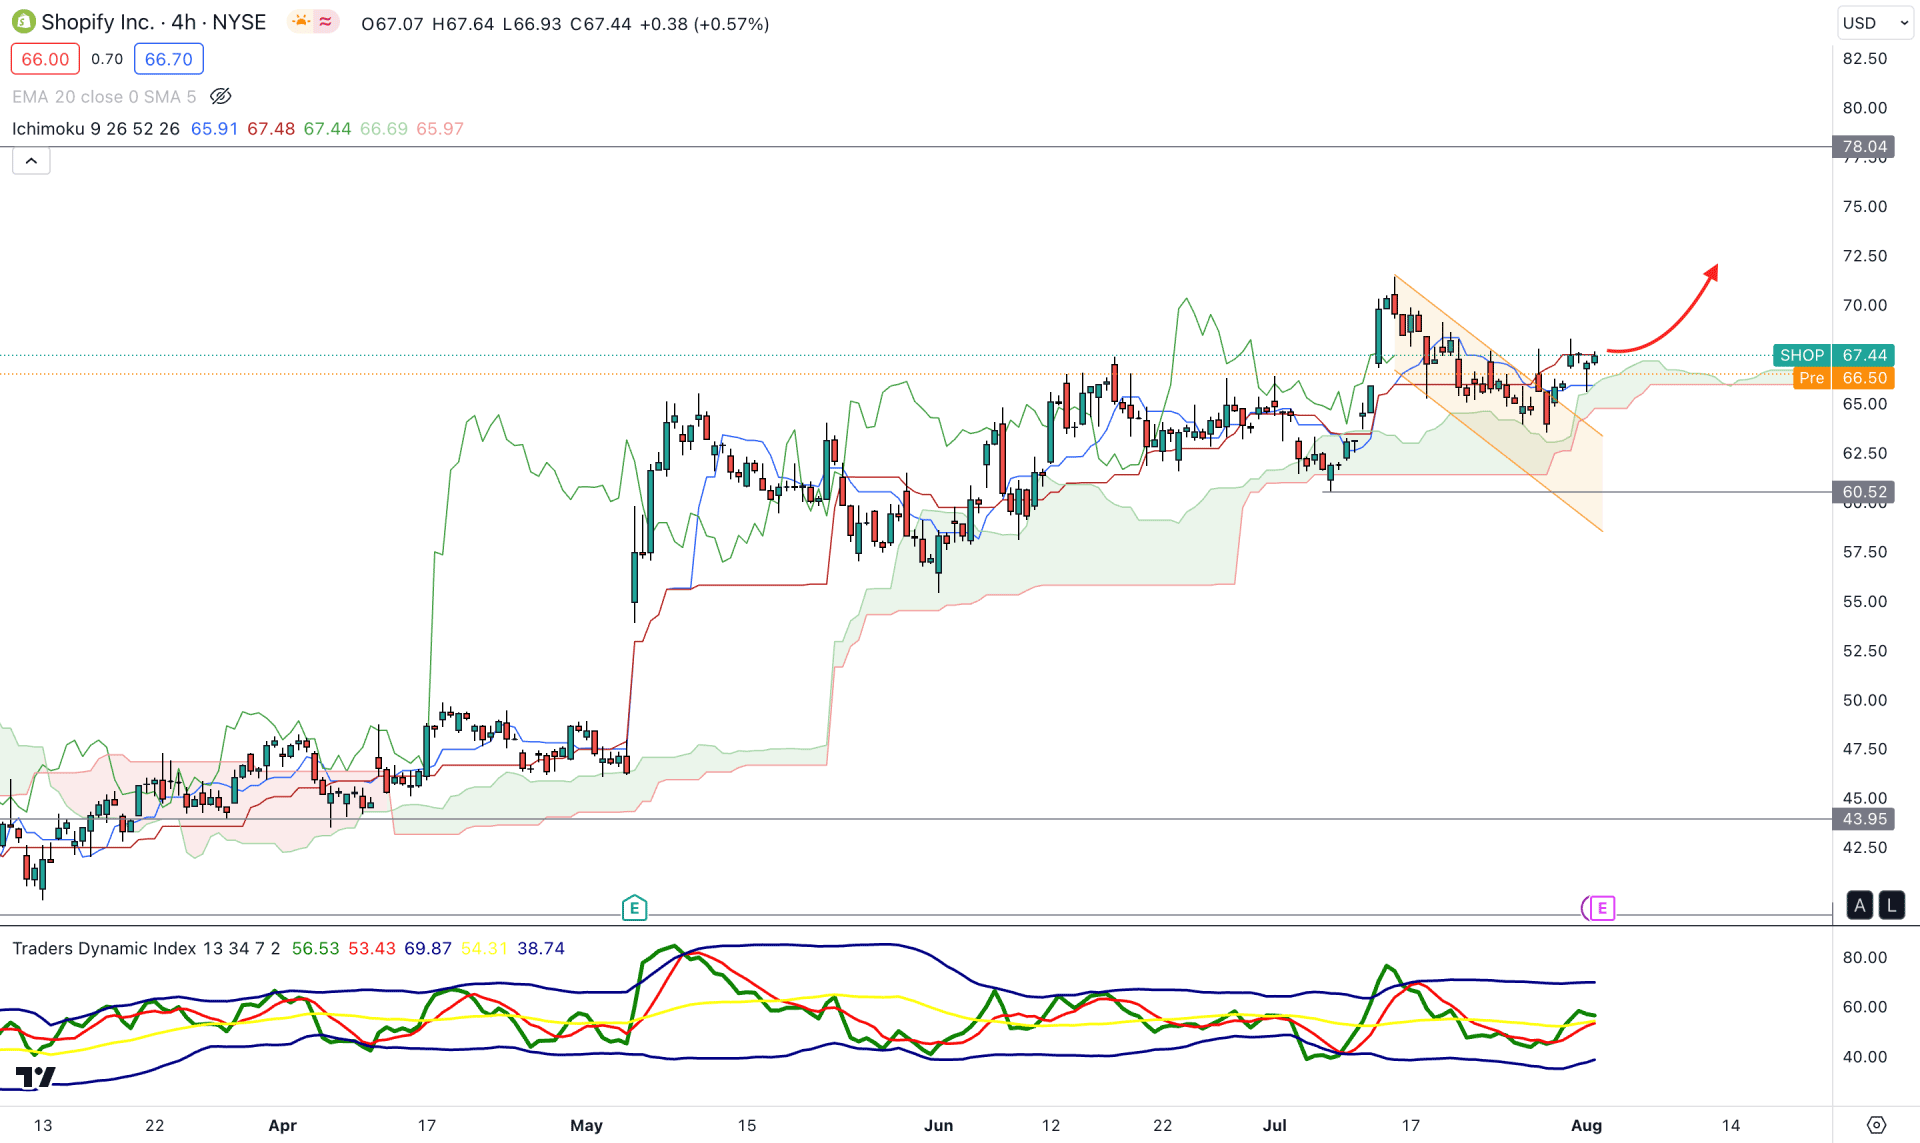
In the H4 timeframe, the current price trades higher with a descending channel breakout, while the broader market is above the Kumo Cloud zone. Moreover, the Senkou Span B is flat in the future cloud, while the Senkou Span A shows upward momentum.
In the indicator window, the current Traders Dynamic Index (TDI) shows a bullish momentum as the current TDI level is above the 50.00 line.
As per the H4 outlook, a new H4 candle above the dynamic Kijun Sen could offer a long opportunity in this stock, where the main aim is to test the 78.00 resistance level. However, the upward possibility is valid as long as the price trades above the cloud zone. A bearish pressure with an H4 close below the 60.52 level could lower the price toward the 44.00 level.
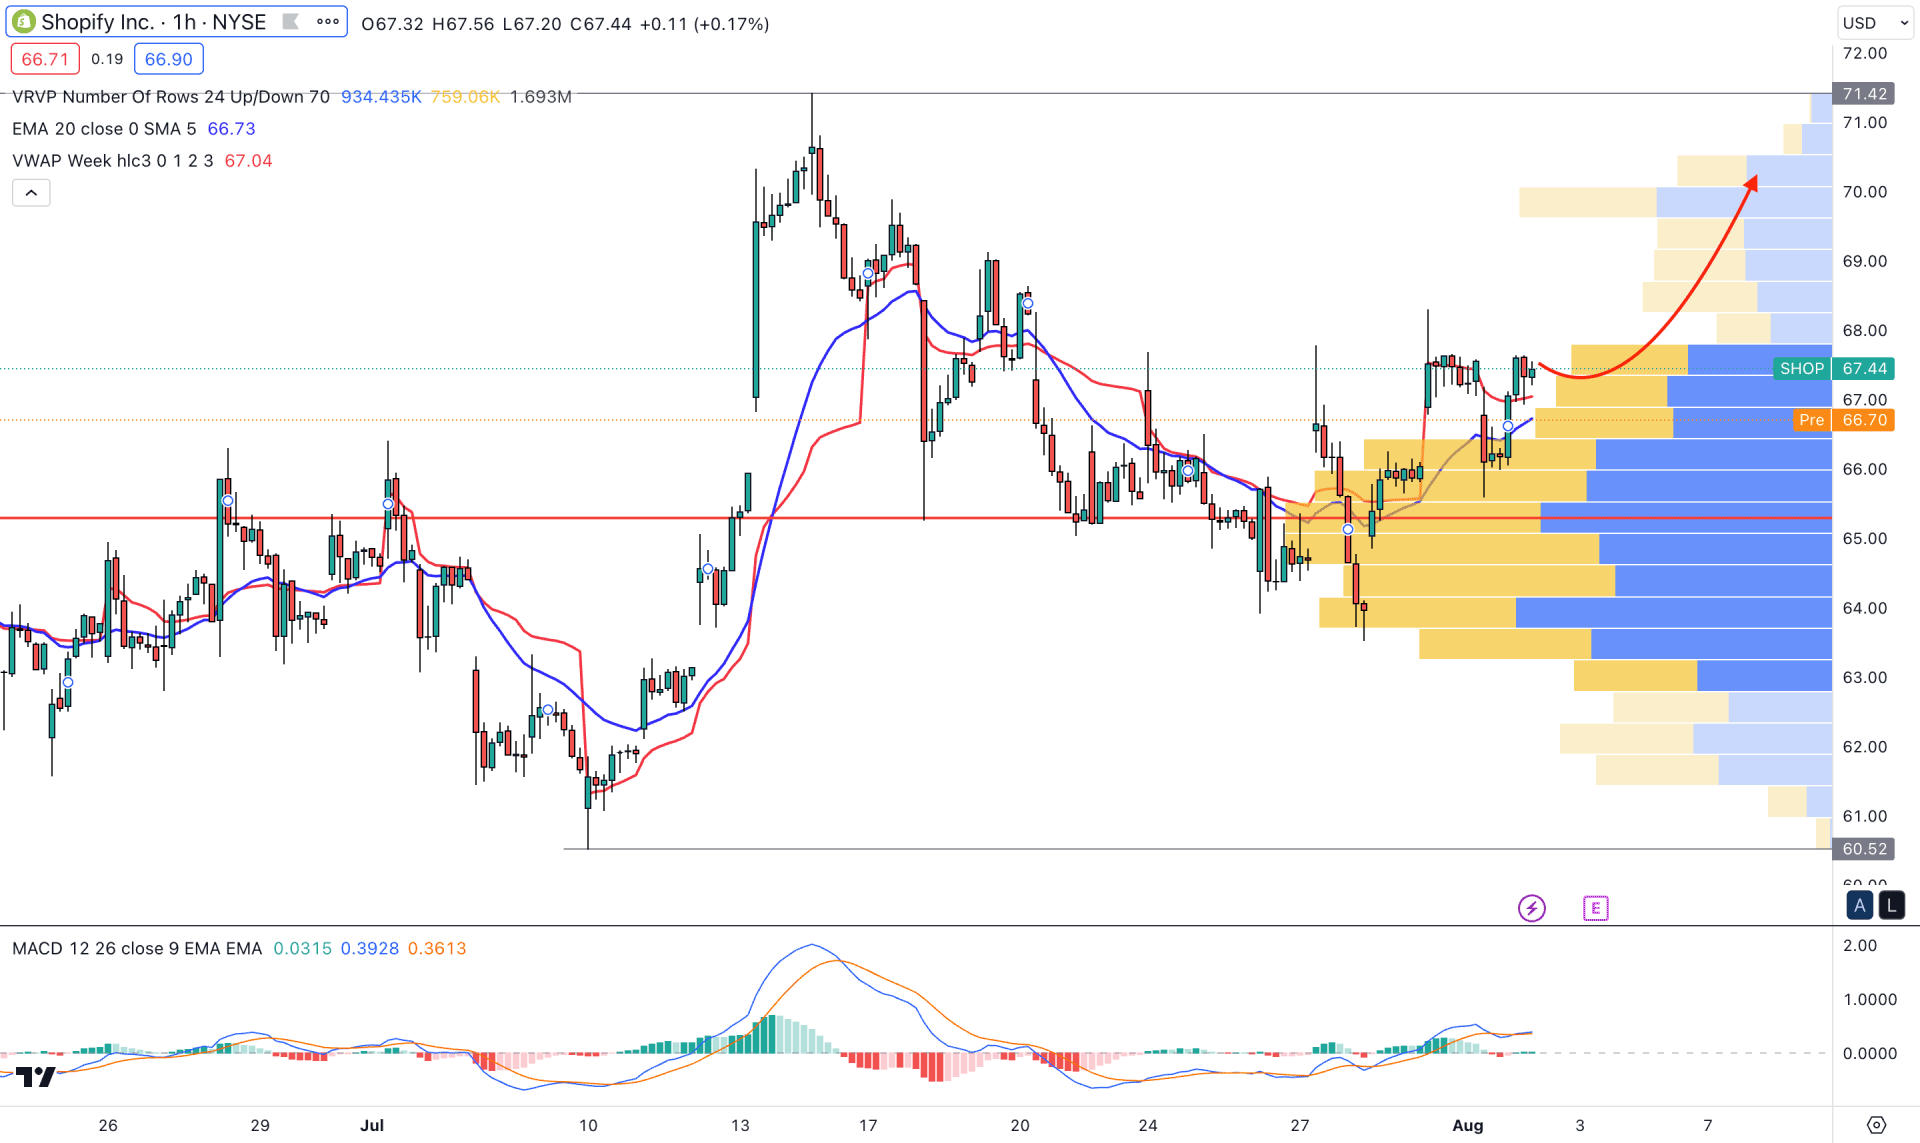
In the H1 price, the current price is trading above the visible range high volume level, while the dynamic 20 EMA is acting as immediate support. Also, the dynamic weekly VWAP is in line with the 20 EMA, which could work as a confluence support.
In the indicator window, the current MACD Histogram shows a neutral structure, while MACD EMA’s are at buyers side.
Based on the H1 structure, we may consider the buying pressure as solid in this pair, which could increase the price in the coming hours.
The alternative approach is to look for a short opportunity if the price comes below the visible range high volume level with impulsive pressure.
Based on the current multi-timeframe analysis, we may consider the bullish pressure potent for the SHOP. The primary intention for this stock would be to look for a long opportunity until the daily structure changes with a new lower low formation.


