
Published: February 20th, 2024
Shopify Stock (SHOP) experienced a 9.6% drop this week following the release of its fourth-quarter earnings report. While revenue grew a healthy 24% year-over-year, investors reacted negatively to the company's projection of higher operating expenses.
On the other hand, the company's core business remains strong, with continued top-line growth expected in the low 20% range for the first quarter of 2024. Additionally, Shopify's commitment to improving free cash flow margin and releasing innovative AI tools suggests a focus on long-term profitability and growth.
The recent dip might be attributed to high expectations after a strong year for Shopify stock, which climbed 54% in 2023. Sometimes, even solid growth companies can face a sell-off if their outlook falls short of lofty expectations.
It's important to consider the broader context. Shopify's international expansion is impressive, with a 35% increase in merchants outside North America joining the platform in 2023. This demonstrates the company's significant growth potential beyond its established markets.
While the short-term market reaction to Shopify's earnings was adverse, the company's strong fundamentals and ambitious plans suggest a bright future. The current dip could present a valuable entry point for investors with a long-term perspective.
Let’s see the upcoming price projection for this stock from the SHOP technical analysis:
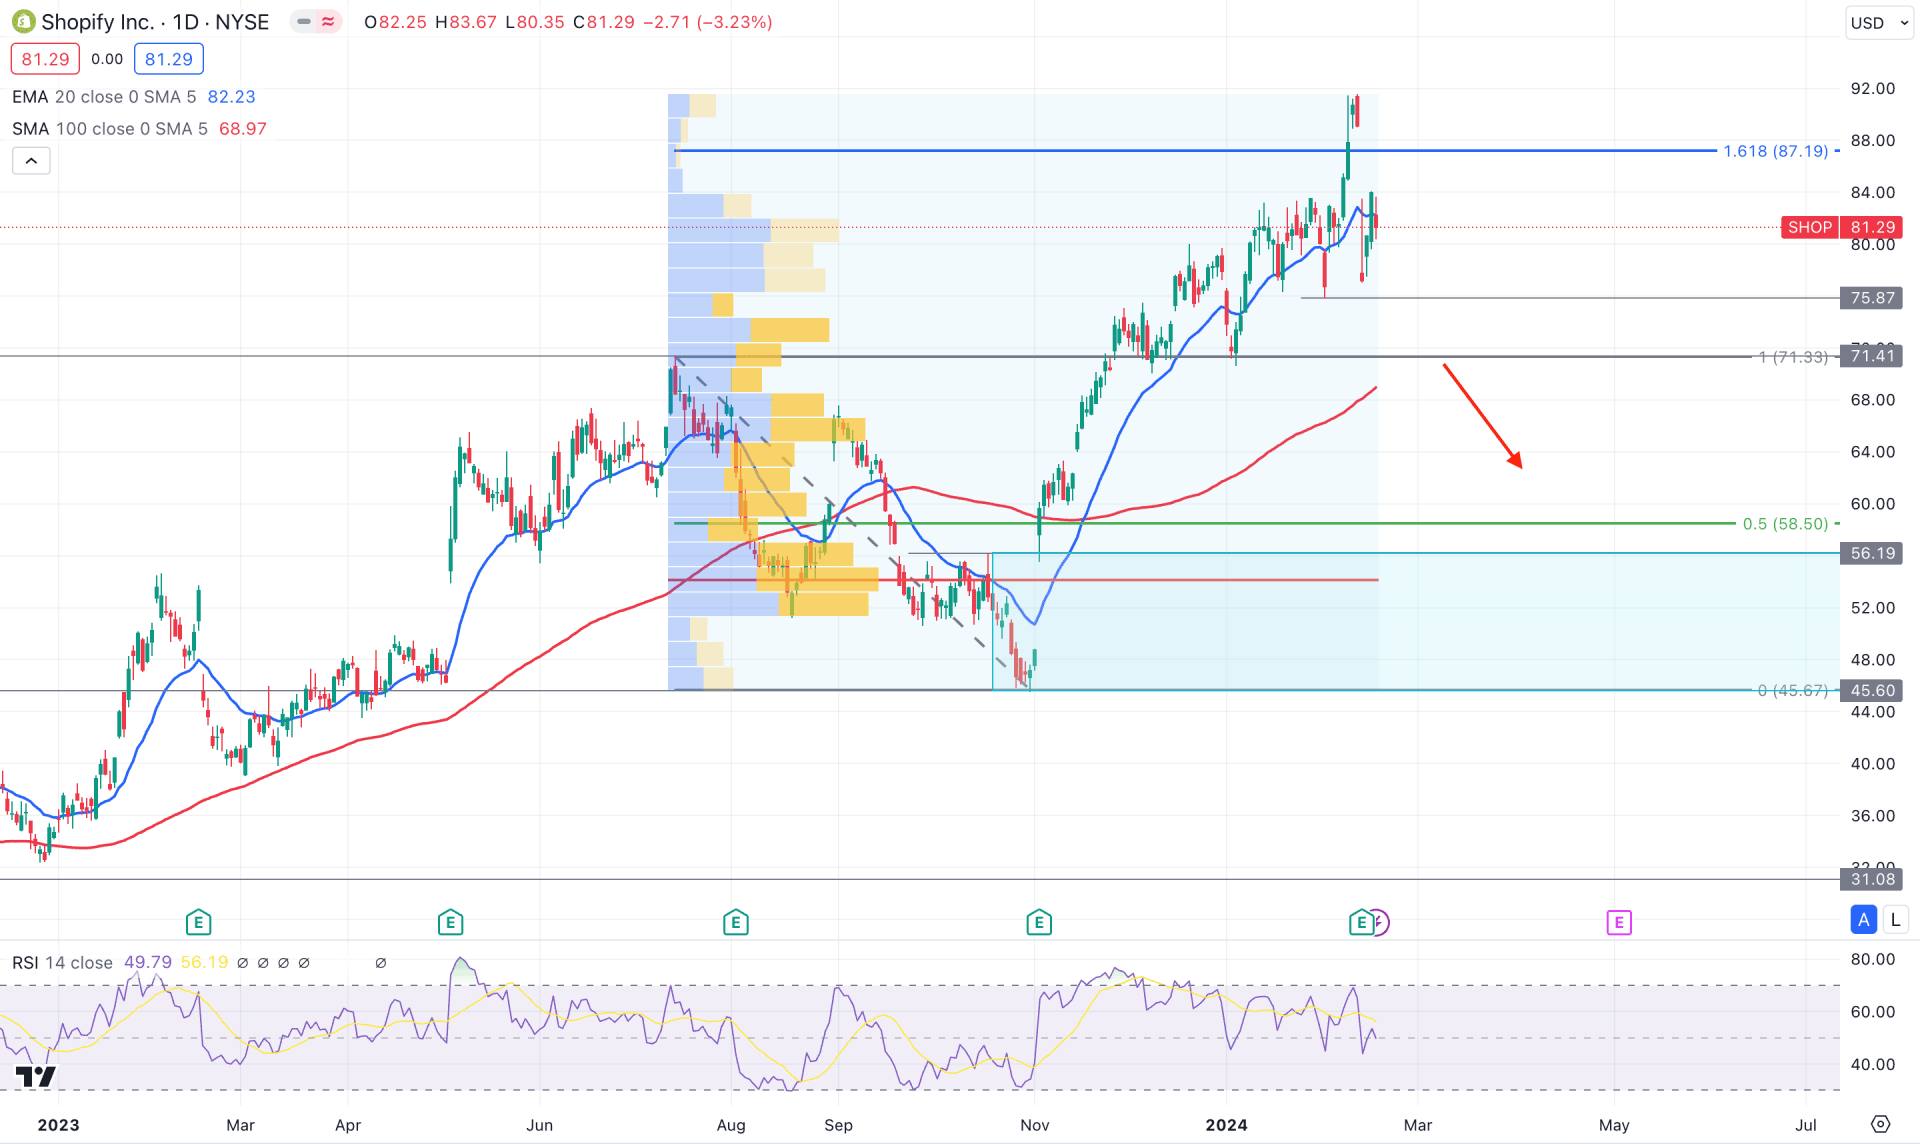
In the daily chart of SHOP, an ongoing bullish momentum is visible where the current price trades at the multi-year high. However, some reversal is possible as potential exhaustion is visible at the crucial Fibonacci Extension level.
In the monthly chart, recent candles show a bullish continuation as they made new highs for the last four months. However, the weekly price formed a bearish engulfing bar, showing sellers' presence in the market. In that case, a sufficient downside correction is pending, which needs a valid confirmation from the lower timeframe.
In the volume structure, the most active level since June 2023 is at 54.10 level, which is within the existing bullish order block. Investors might expect a downside correction in the coming days because the current price is overextended from the high volume level.
In the daily chart, the 100-day Simple Moving Average is below the 71.41 static support, indicating an active market buying pressure. Moreover, bearish exhaustion from the 91.67 high formed a daily close below the 20-day EMA level, which suggests a possible downside correction.
In the indicator window, the Relative Strength Index (RSI) suggests a bearish possibility as the recent line moved below the 50.00 neutral level. Moreover, the recent RSI line failed to follow the price swing, forming a potential divergence.
Based on the daily market outlook of SHOP, a potential bearish reversal is possible, following divergence and exhaustion at the top. In that case, a bearish daily close below the 71.41 static line could lower the price towards the 31.08 level.
On the other hand, a bullish trend continuation is possible, where a valid bullish reversal might come from the 58.50 to 45.60 area. In that case, a bullish trend might extend toward the 92.00 level.
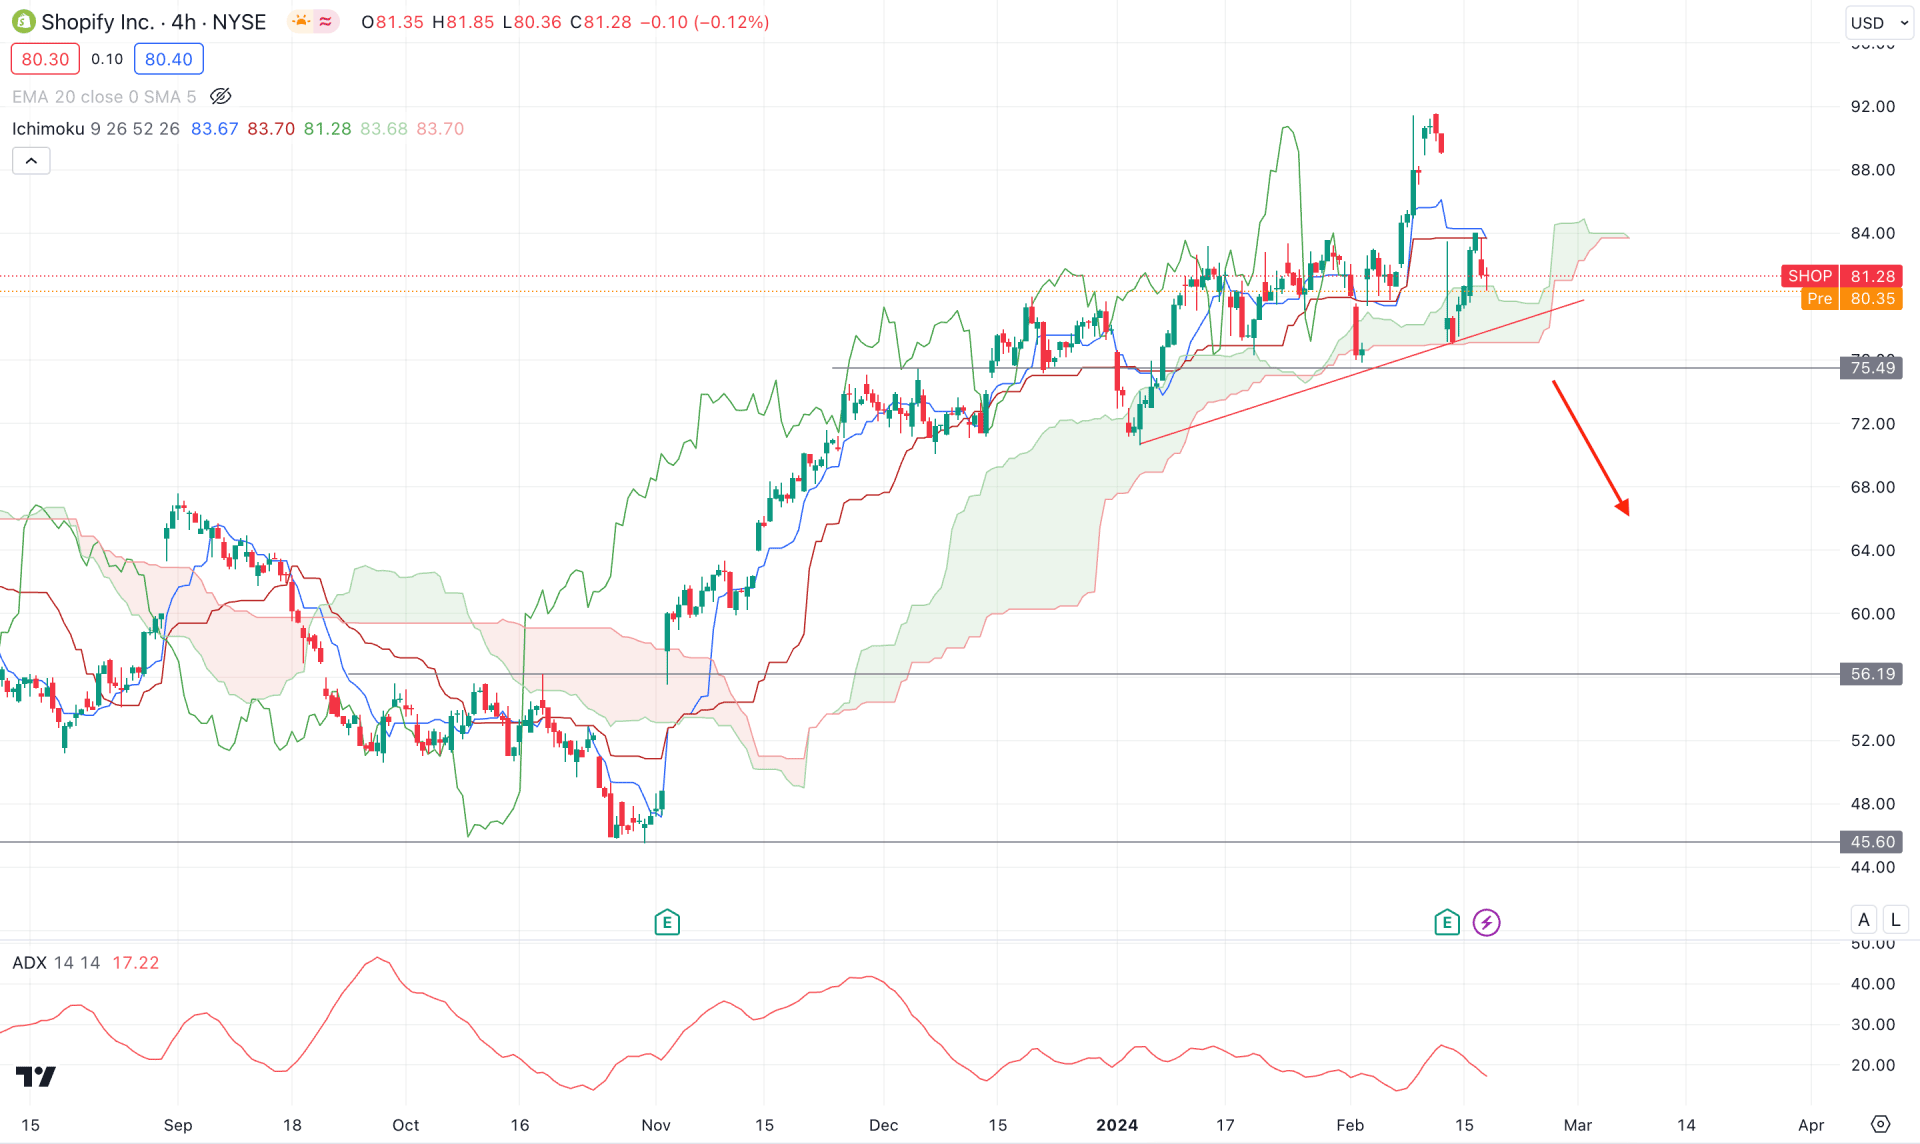
In the H4 timeframe, a bearish possibility is potent as the recent price shows extreme volatility above the Kumo cloud.
In the future cloud, the momentum is not solid as both lines are closer together, which indicates a possible reversal. Moreover, the Tenkan Sen and Kijun Sen lines are above the current price, working as a resistance.
Based on this outlook, a valid bearish breakout with an H4 close below the 75.49 static level could be a short opportunity, targeting the 52.00 level. In that case, a rebound in the ADX line above the 20.00 level could be a bearish confluence factor.
On the bullish side, an immediate buying pressure with an H4 candle above the 88.00 level could indicate a false downside pressure, which could increase the price toward the 92.00 level.

In the hourly chart, the overall market momentum is bearish as the recent visible range high volume level is above the current price. Moreover, the MACD Histogram has started to lose bullish momentum and reached the neutral level, which might work as a confluence of bearish factors.
Based on this outlook, a downside continuation with an H1 candle below the 77.00 level could extend the bearish pressure toward the 65.00 area.
On the other hand, a failure to take the price below the 78.00 level with an immediate recovery above the 85.48 level could open a long opportunity.
Based on the current multi-timeframe analysis, Shopify stock (SHOP) overextended the buying pressure in the daily chart, which needs a decent downside correction. Investors should closely monitor how the price reacts on the hourly chart before opening any short position.


