
Published: November 23rd, 2021
The recent collapse in the cryptocurrency market pushed Bitcoin, Ethreum, and other top-tiered cryptocurrencies to move down from their all-time high level. The selling pressure came from the divergent view on Democrats and Republics regarding altcoins. Following the sentiment, crypto market capitalization moved down from the all-time high level but remained above the $2.5 trillion level.
Shiba Inu came as a Dogecoin killer, and it tasted the feel of taking the market cap above the Dogecoin during the recent bullish surge in Siba Inu. However, the situation has changed now, but Shiba Inu holds its position among the world’s top 20 cryptocurrencies. Moreover, the recent concern about Shiba Inu developers to keep investors away from many scam products might win people’s hearts with a price appreciation.
Let’s see the upcoming price direction from the SHIB/USDT technical analysis:
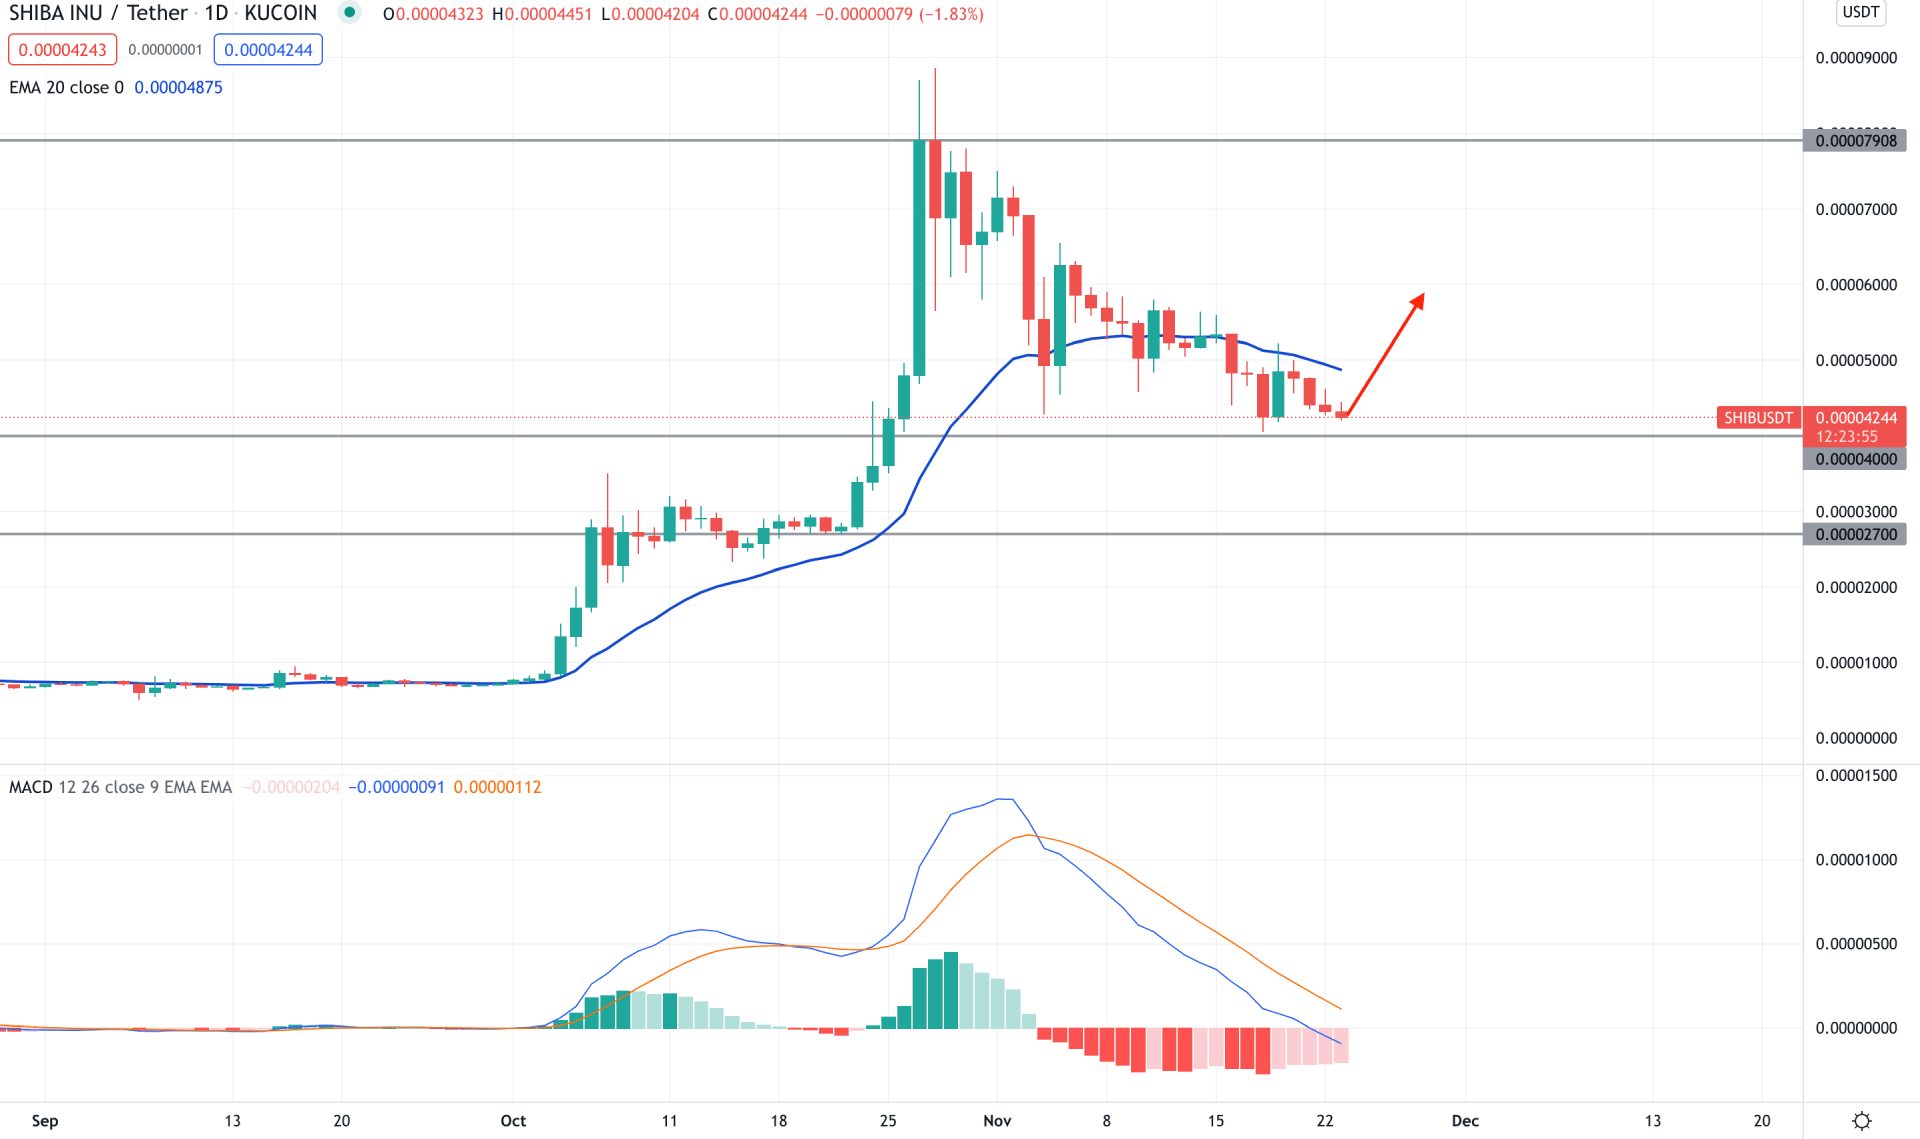
SHIB/USDT initiated the strong bullish movement at the start of October 2021 and reached the all-time high at 0.00008864 level. Later on, the price corrected lower towards the dynamic 20 EMA and tried to move up and failed. The most recent price is trading below the dynamic 20 EMA and becoming corrective.
In the indicator window, MACD Histogram is below the zero line and becoming corrective, which signifies that the current bearish pressure is weakening. However, in any crypto trading, the HODLing approach from a suitable price level is important. In this context, any bullish reversal from 0.0000400 with a daily candle above the dynamic 20 EMA would increase the bullish possibility in the coming days. On the other hand, investors should remain cautious if the price moves below the 0.0000400 level. In that case, it has a higher possibility of testing the 0.0000270 level before showing additional buying pressure.
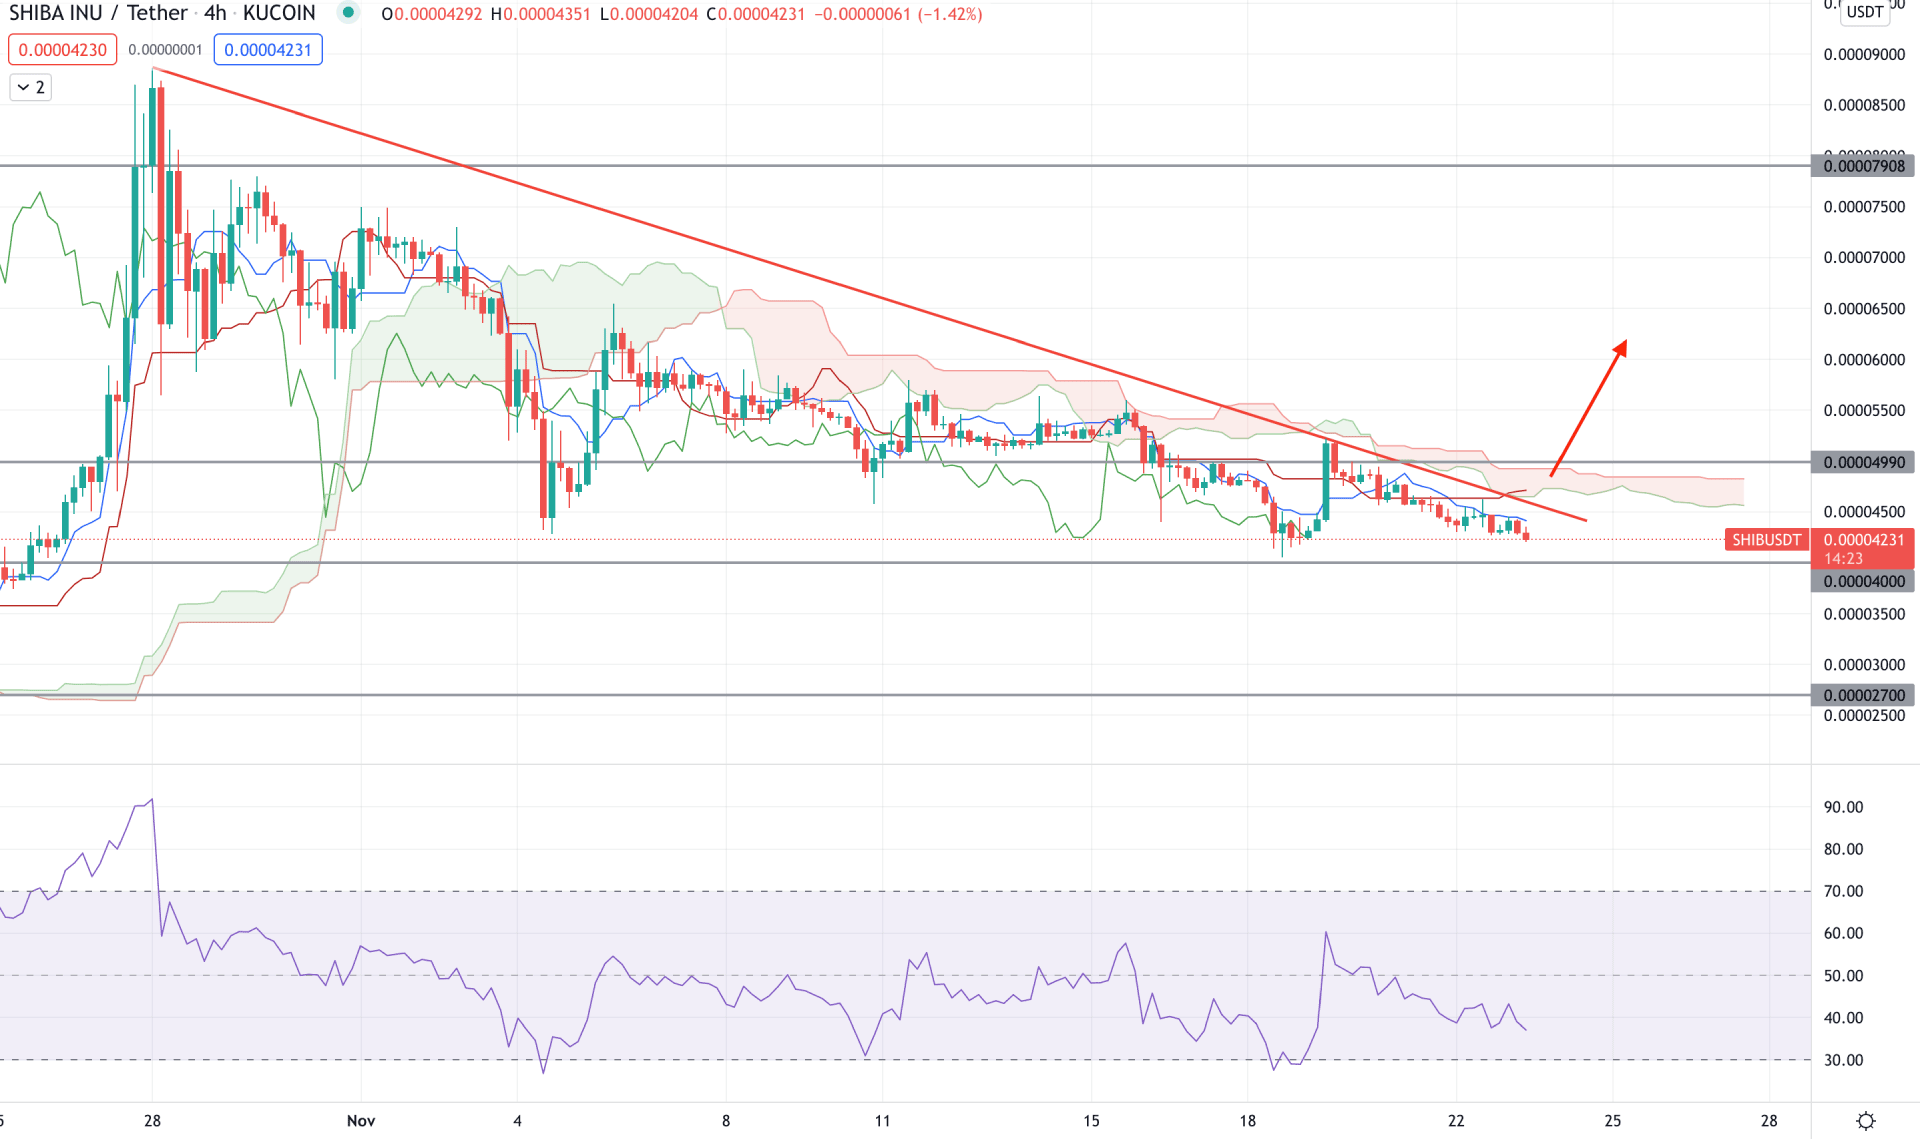
According to the Ichimoku Cloud, the H4 price is trading within a bearish correction where the current price moved below the 0.0000500 event level. Moreover, the Senkou Span A moved below the Senkou Span B in the future cloud where the Chikou Span is closer to the price. In that case, the bearish possibility might extend towards the 0.0000400 level in the coming days.
The above image shows how the price is trading below the dynamic Tenkan Sen and Kijun Sen, where the Tenkan Sen moved below the Kijun and worked as a minor resistance to the price. Meanwhile, the RSI is below the 50 levels and aiming lower towards the oversold 30 levels.
Based on the H4 context, the bearish possibility is valid if the dynamic Kijun Sen works as a minor resistance to the price. In that case, the price may move lower towards 0.0000270. On the other hand, a bullish H4 close above the 0.0000500 may alter the current market structure and initiate the bullish pressure towards the 0.0000790 areas.
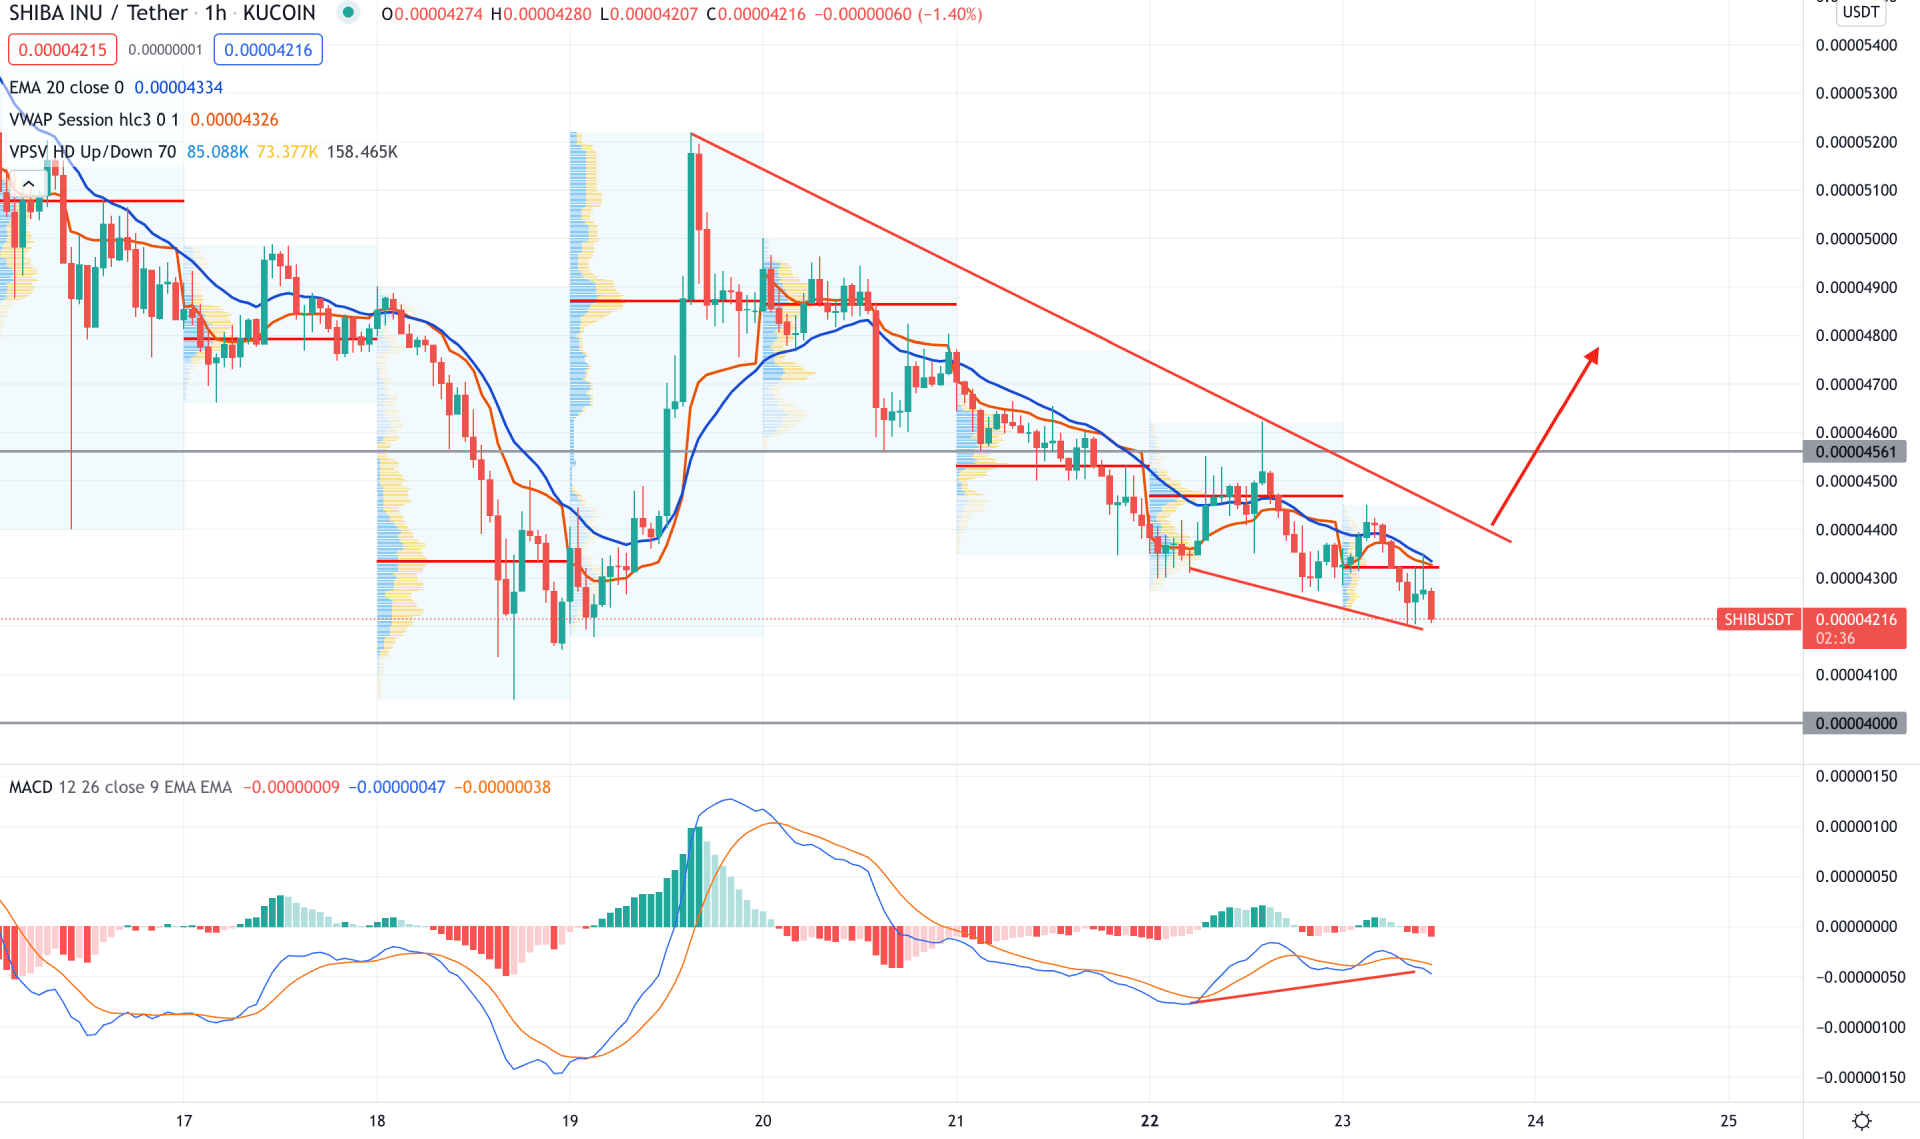
In the intraday chart, SHIB/USDT is trading within a corrective bearish movement where the most recent price moved below the dynamic Tenkan Sen and Kijun Sen. The intraday high volume levels keep moving lower, pushing bearish pressure to the price. On the other hand, the current bearish correction is within the recent bullish impulsive pressure initiated on 19 November. Therefore, investors should closely monitor how the price reacts on the 0.0000400 to 0.0000420 demand zone. Any bullish pressure with an H1 candle above the recent trendline resistance would increase in the coming hours.
The above image shows how the regular divergence formed in the MACD lines where the Histogram remained corrective. In this context, any bullish H1 candle above the dynamic 20 EMA would take the price higher towards the 0.0000500 level. On the other hand, a break below the 0.0000400 level may influence bulls to find another buying opportunity at the 0.0000270 level.
As per the current market condition, SHIB/USDT is more likely to move up if the price shows any bullish pressure from the 0.0000400 level. In that case, the price may move towards the 0.000700 level as the ultimate target. On the other hand, a break below the 0.0000400 level would increase the selling pressure towards 0.0000270.


