
Published: August 16th, 2022
According to a report from WhaleStats analysis, there was a massive 511% surge in the top 100 Shiba Inu holders in the previous week. As a result, the native token of Shiba Inu (SHIB) faced buying pressure, ranking among the top purchased tokens by whales.
As per the report, a whale named "BlueWhale0113," ranking 395th on the network, has bought $3,722,439 worth of 312,285,225,685 SHIB in the previous week. It is common for whales to buy such an amount at a discounted price, expecting price appreciation.
On the other hand, Shiba Inu revealed some developments where the historic alliance with the Third Floor (TFF) is remarkable. It is a clear sign that Shiba Inu is moving forward to the Metaverse, where the number of SHIB holders with more than $100,000 value has increased 142% recently.
Based on the recent price behavior, SHIB price has shown several developments where the recent Cup and Handle pattern breakout with a massive increase in volume is noticeable. Can the Bulls regain momentum? Let’s have a look at the future price direction for Shiba Inu from the SHIB/USDT Technical analysis.
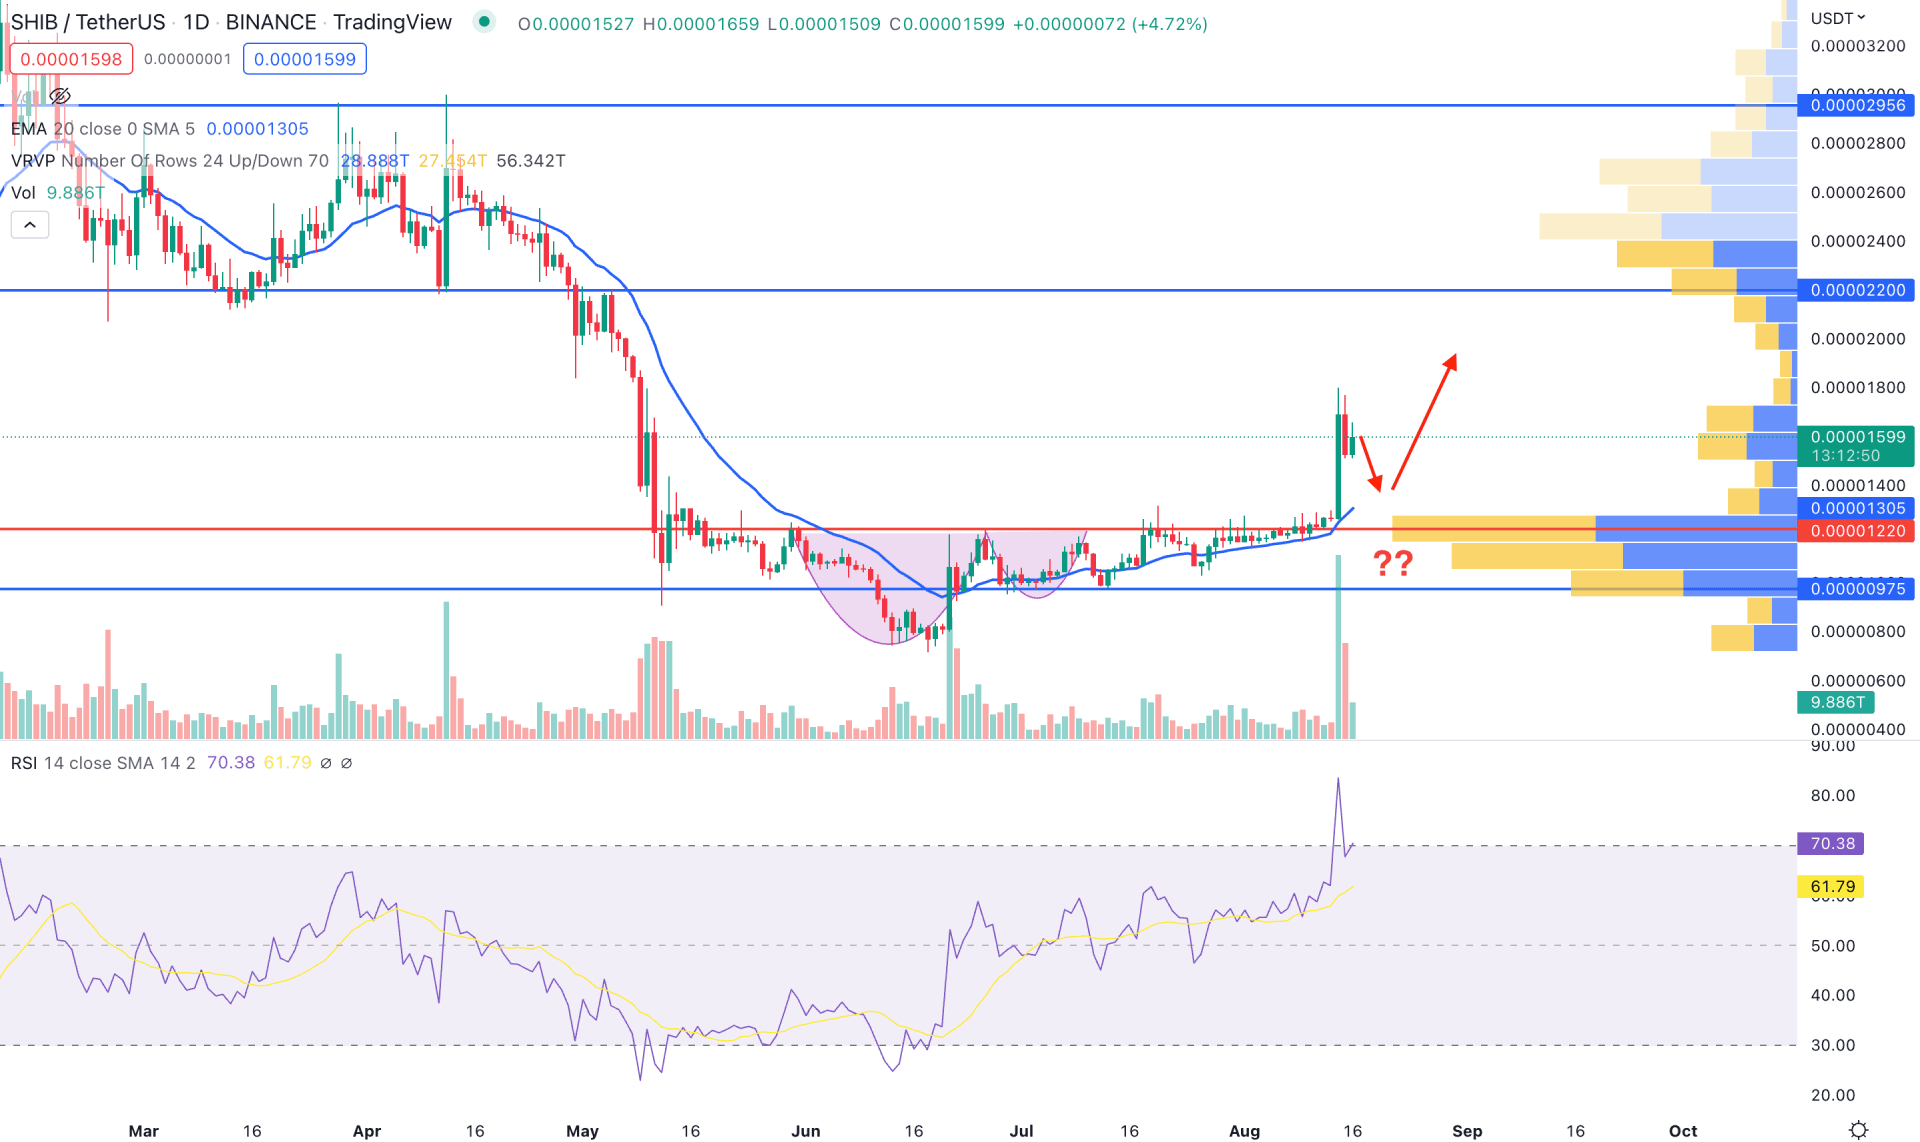
In the SHIB/USDT daily chart, the massive selling pressure is clearly visible from left to right, which became obsolete after making a bottom at 0.00000715 low. With no new swing low, the price became corrective and formed a U-pattern.
The buying pressure became noticeable once the price formed a Cup & Handle pattern and continued pushing higher with a 20-day EMA carry-out. Finally, a strong bullish breakout happened with the support from volume, where the highest trading volume level was marked at 0.00001220 level. As a result, the buying pressure may extend if bulls hold it above the 0.00001220 level on the daily timeframe.
The Relative Strength Index is also above the 70 level, signifying a strong buying pressure, while the dynamic 20-day EMA is working as an immediate support level. Based on the daily structure, a minor correction is pending, but any bullish rejection from 0.00001220 to 0.00001400 area could provide a bullish opportunity. In that case, the primary aim is to test the 0.00002200 resistance level before approaching the 0.00002956 level.
On the other hand, if a bearish daily candle appears below the 0.0000097 level, we may consider the bullish opportunity invalid. In that case, the selling pressure may extend toward the 0.00000400 level.
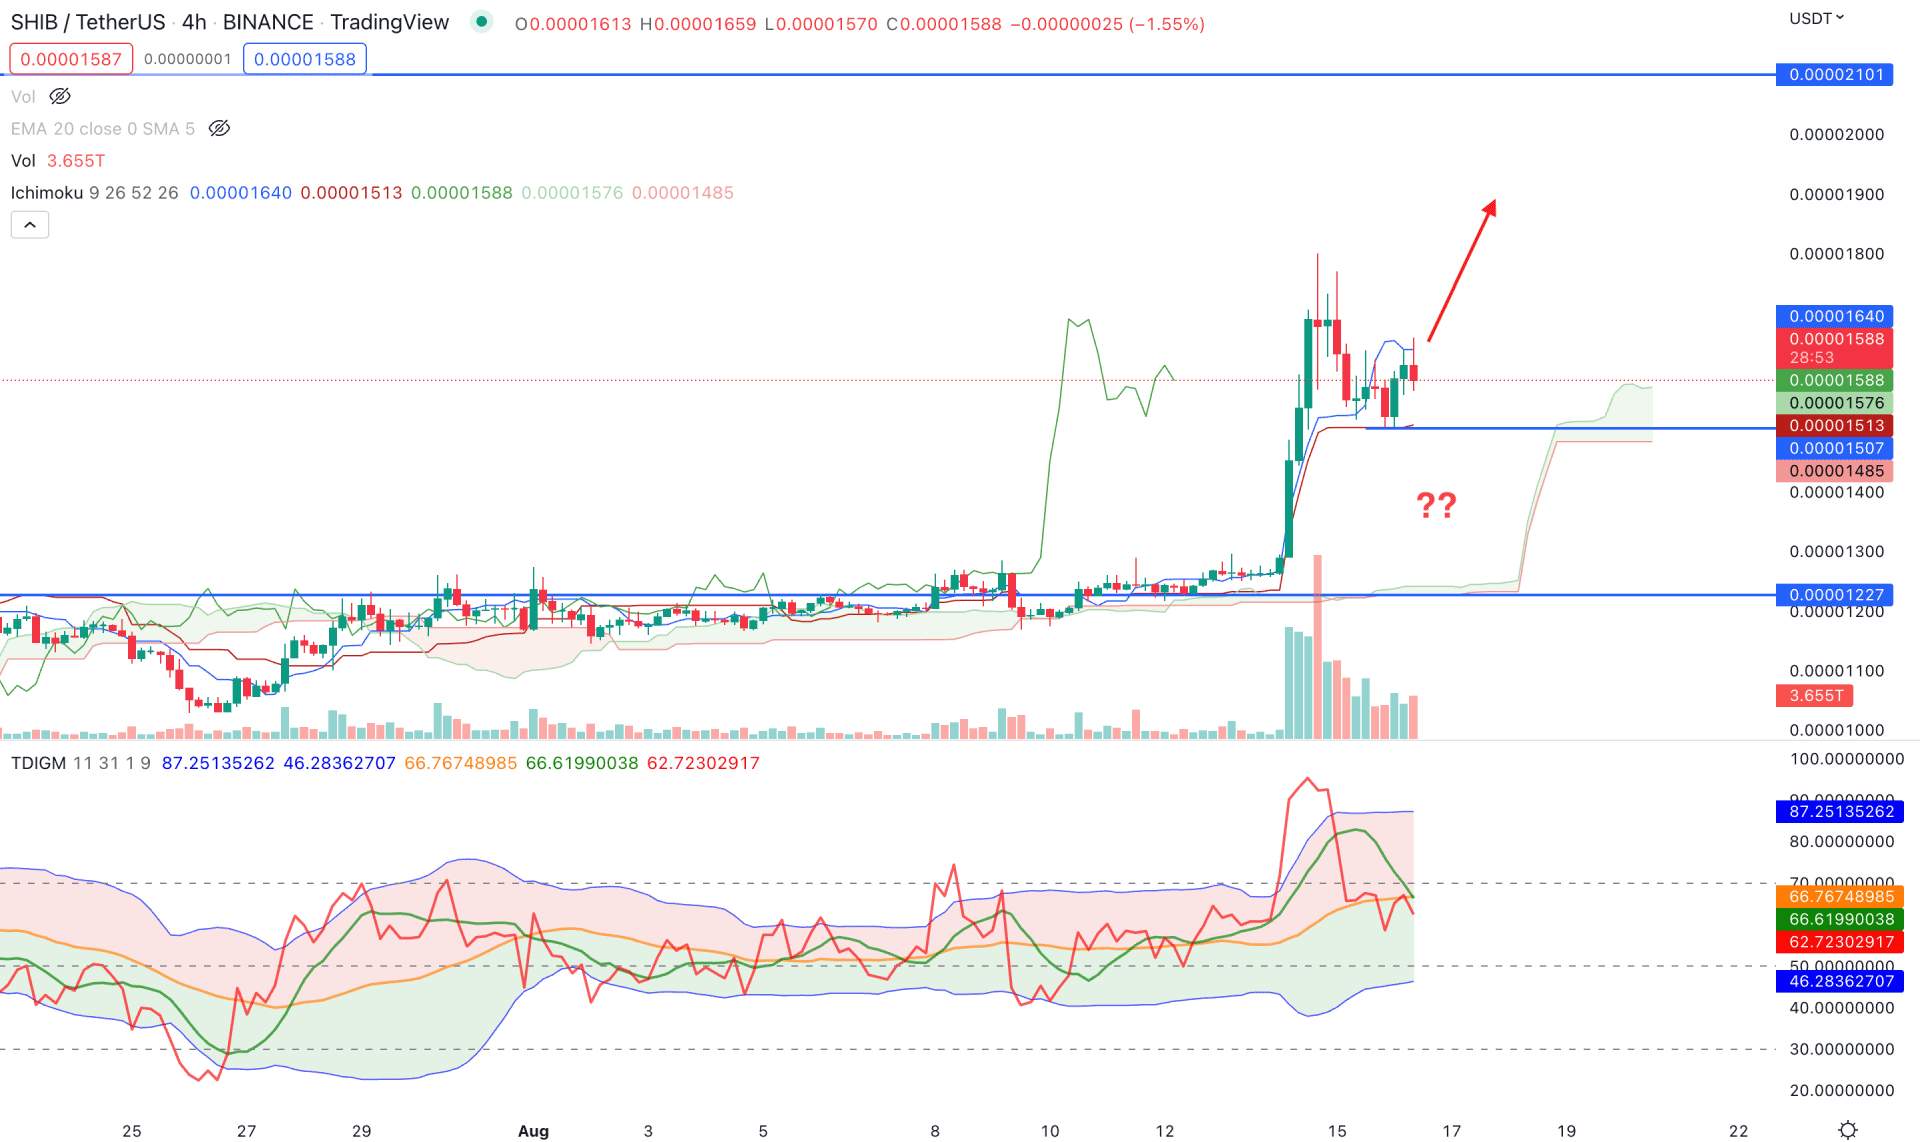
According to Ichimoku Cloud, the current price projection for this pair is bullish as a strong bullish breakout happened from the Kumo Cloud that closed the price above the dynamic Kijun Sen level. Moreover, the bullish breakout was supported by a strong volume, while the future cloud is bullish.
In the Traders Dynamic Indicator, the current TDI level is moving down from the overbought zone but remains above the 50% level. In that case, we can consider the buying pressure valid as long as the TDI level is above the 40% level.
A corrective price action is visible from a bearish H4 candle, formed below the dynamic Tenkan Sen. However, the price is still above the Kijun Sen level, from where bulls may continue pushing it higher.
Based on the H4 chart, investors should monitor how price trades at Tenkan Sen to Kijun Sen zone, from where a bullish rejection with an H4 candle above the Tenkan Sen level will open a bullish opportunity. On the other hand, the break below 0.00001227 will alter the current market structure and continue the bearish trend.
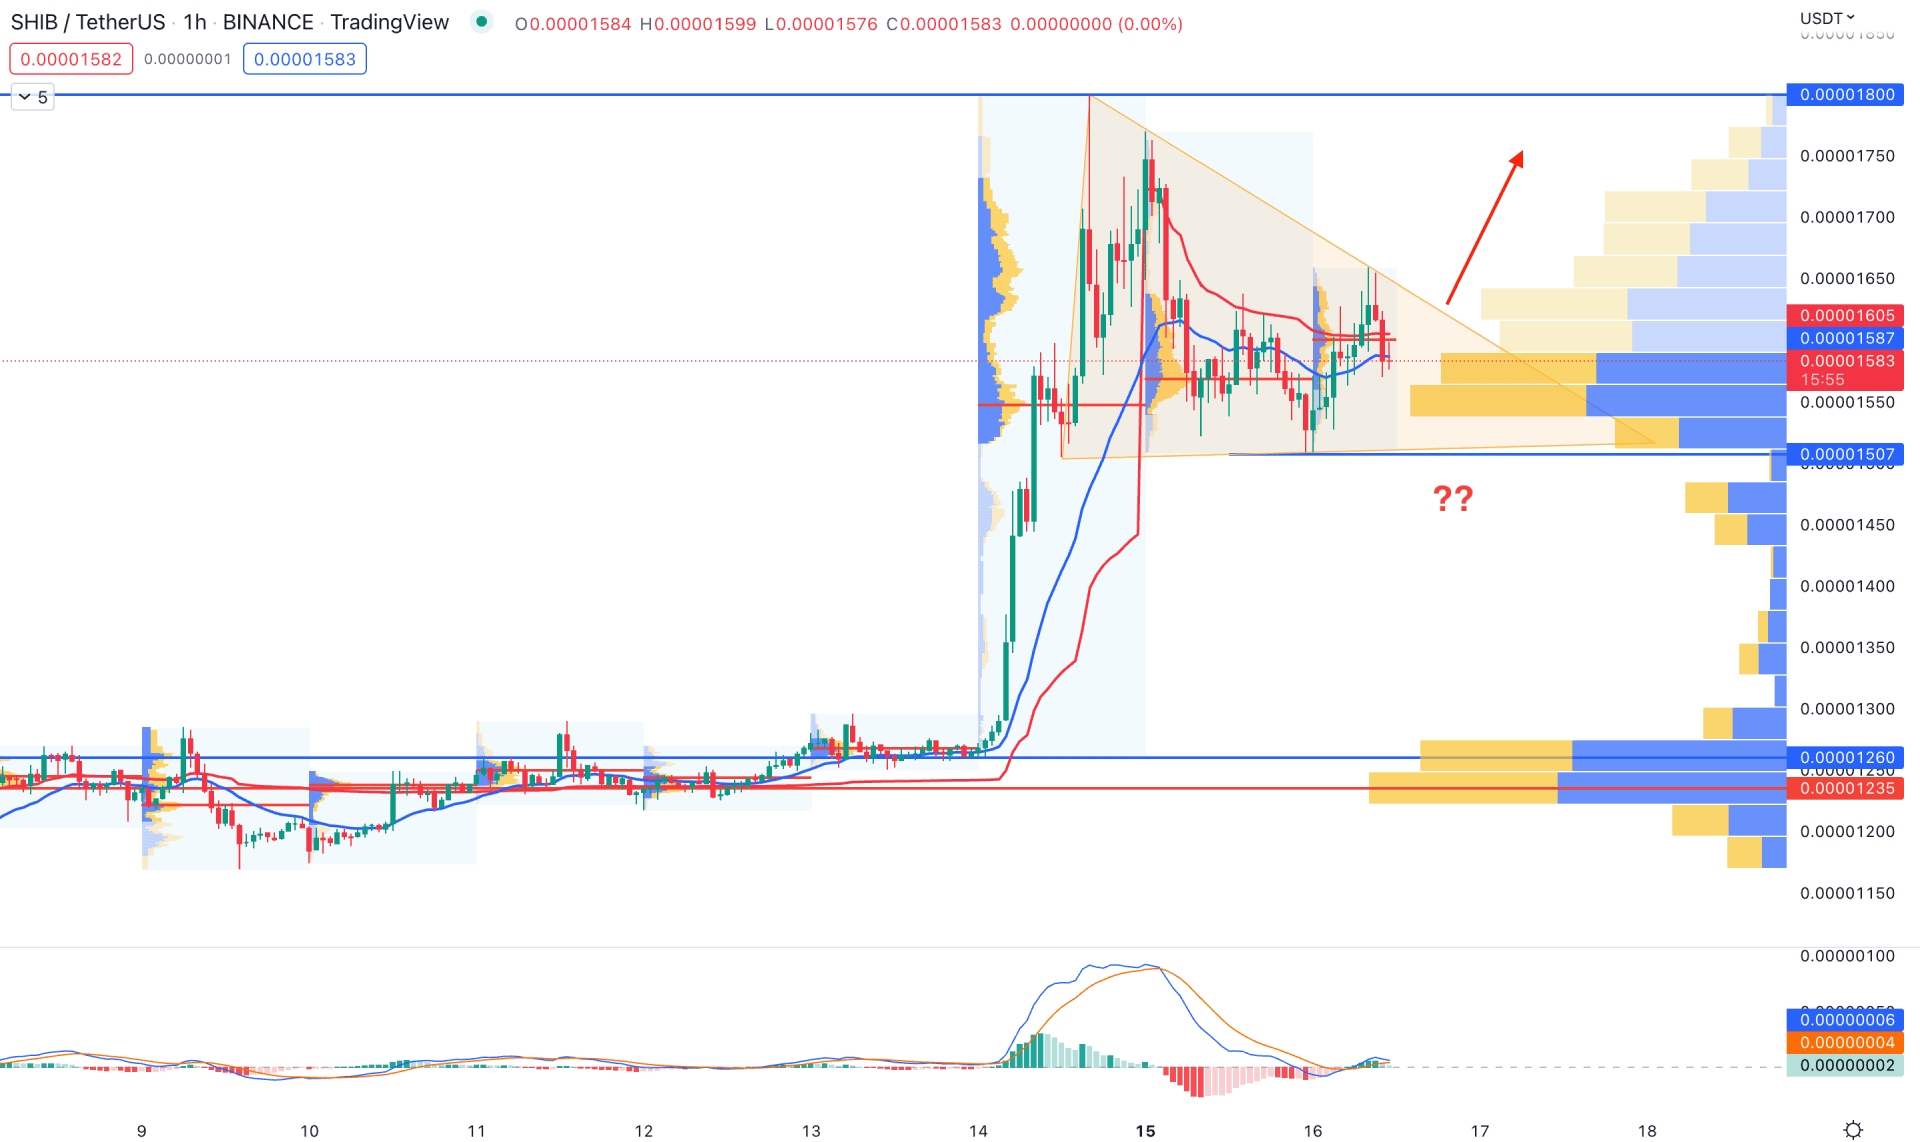
In the intraday chart, the H1 timeframe shows an extreme buying pressure initiated from the 0.00001235 high volume level that made a sharp 42% price surge. However, after testing the 0.00001800 swing high, the current price trades within a symmetrical triangle with a corrective momentum.
The corrective price action was extended from the bearish H1 close below the dynamic 20 EMA, increasing the possibility of testing the 0.00001500 support level. On the other hand, the MACD Histogram is still bullish while MACD EMA’s are approaching the neutral zone.
Based on the H1 chart, any bullish H1 close above the triangle resistance would open a bullish opportunity towards the 0.00001800 level. On the other hand, breaking below the 0.00001500 level with a strong bearish H1 close could extend the loss towards the 0.00001235 level.
Based on the current multi-timeframe analysis, SHIB/USDT is more likely to extend the buying pressure in the coming days. Investors should closely monitor intraday bullish price action formation before joining the long-term bullish trend.


