
Published: June 4th, 2025
The cloud-based IoT company Samsara (IOT) is scheduled to release its financial results on Thursday, June 5, 2025. Examining the stock's past performance in reaction to earnings releases can be quite instructive for event-driven traders. With a highest single-day beneficial return of 27.9% and a median gain of 14.7%, Samsara has experienced an upward one-day response 62% of the time following results announcement since 2022.
Based on current consensus forecasts, analysts predict $0.06 per share on $351 million in revenues. In comparison, last year's same quarter saw profits of $0.03 a share on $281 million in revenues.
According to fundamental analysis, Samsara now has a market value of $26 billion. The company's sales during the last 12 months have been $1.2 billion. However, throughout that period, it reported a $185 million operating expense and a $155 million net loss.
Let's see the upcoming price direction from the IOT technical analysis:
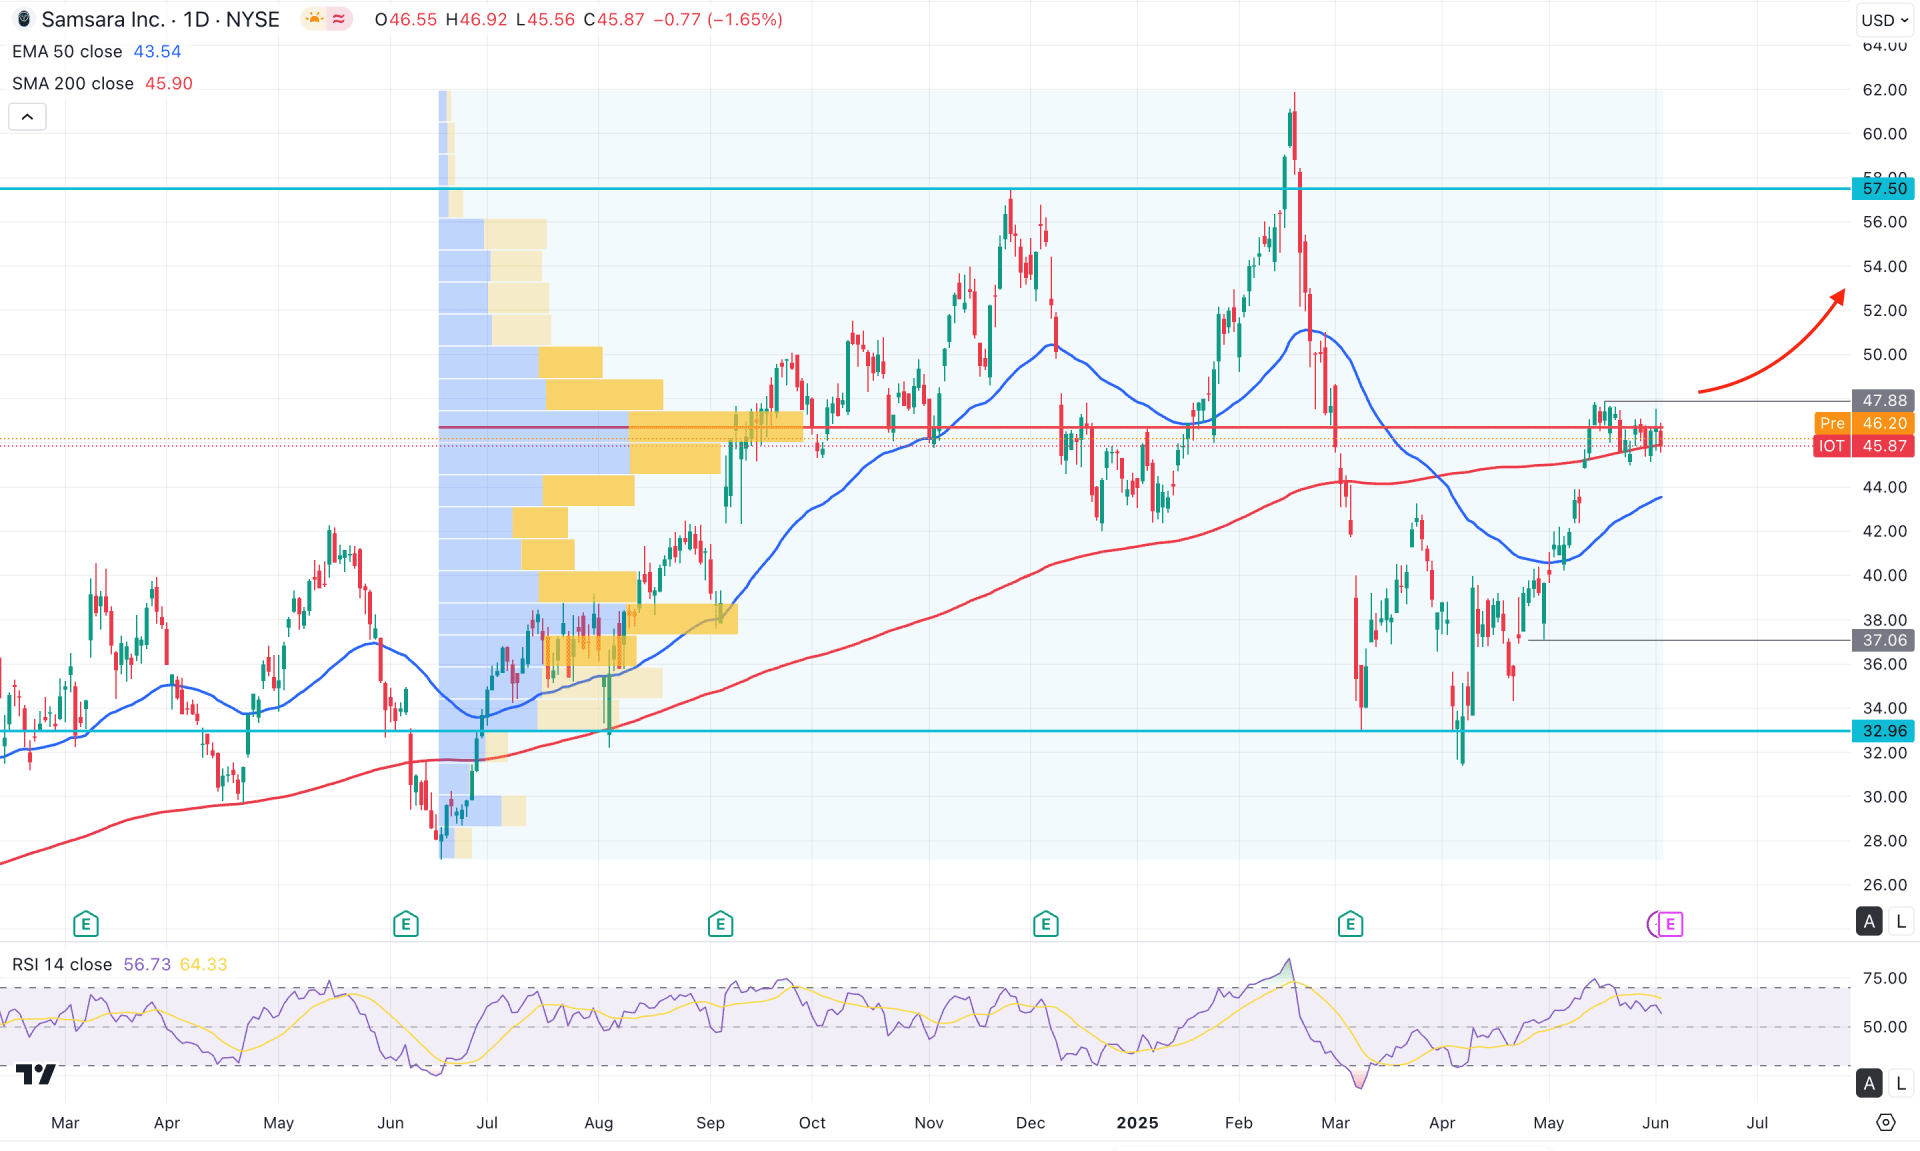
In the daily chart of IOT, the recent price is trading sideways, with key dynamic levels situated close to the current price. However, this sideways momentum follows a bullish recovery from the 31.51 low, which could be a crucial bullish signal.
On the higher timeframe, a bullish continuation is visible in the monthly chart, as the latest candle is moving higher following the formation of a bullish hammer. However, the 48.03 monthly high is still acting as resistance, some downside correction might occur. The weekly chart also shows sideways pressure, indicating the need for a clear breakout to establish the next directional move.
Based on the volume profile, the price is hovering near the high-volume node, suggesting a possible breakout. As the broader market trend is bullish, supported by a rising trendline, a breakout above the current zone could offer a strong long opportunity.
The dynamic indicators show mixed sentiment. The 200-day Simple Moving Average is located near the current price and acts as support. Additionally, the 50-day Exponential Moving Average reinforces the current range, increasing the likelihood of a bullish breakout.
In the secondary indicator window, the Relative Strength Index (RSI) has rebounded after reaching the overbought zone near 80.00 and is currently hovering below the 60.00 level. This suggests that the RSI may decline further toward the neutral 50.00 level, indicating the possibility of minor selling pressure.
Based on the daily market outlook, some downside correction may still be pending before a potential long opportunity arises. The 50-day EMA will be the first target for any downward move. However, a rebound from the 42.50 to 37.06 zone could present a conservative long entry, targeting the 57.50 level. Alternatively, a strong daily candle closing above the 48.50 level could signal an immediate long opportunity, with a target toward the 60.50 area.
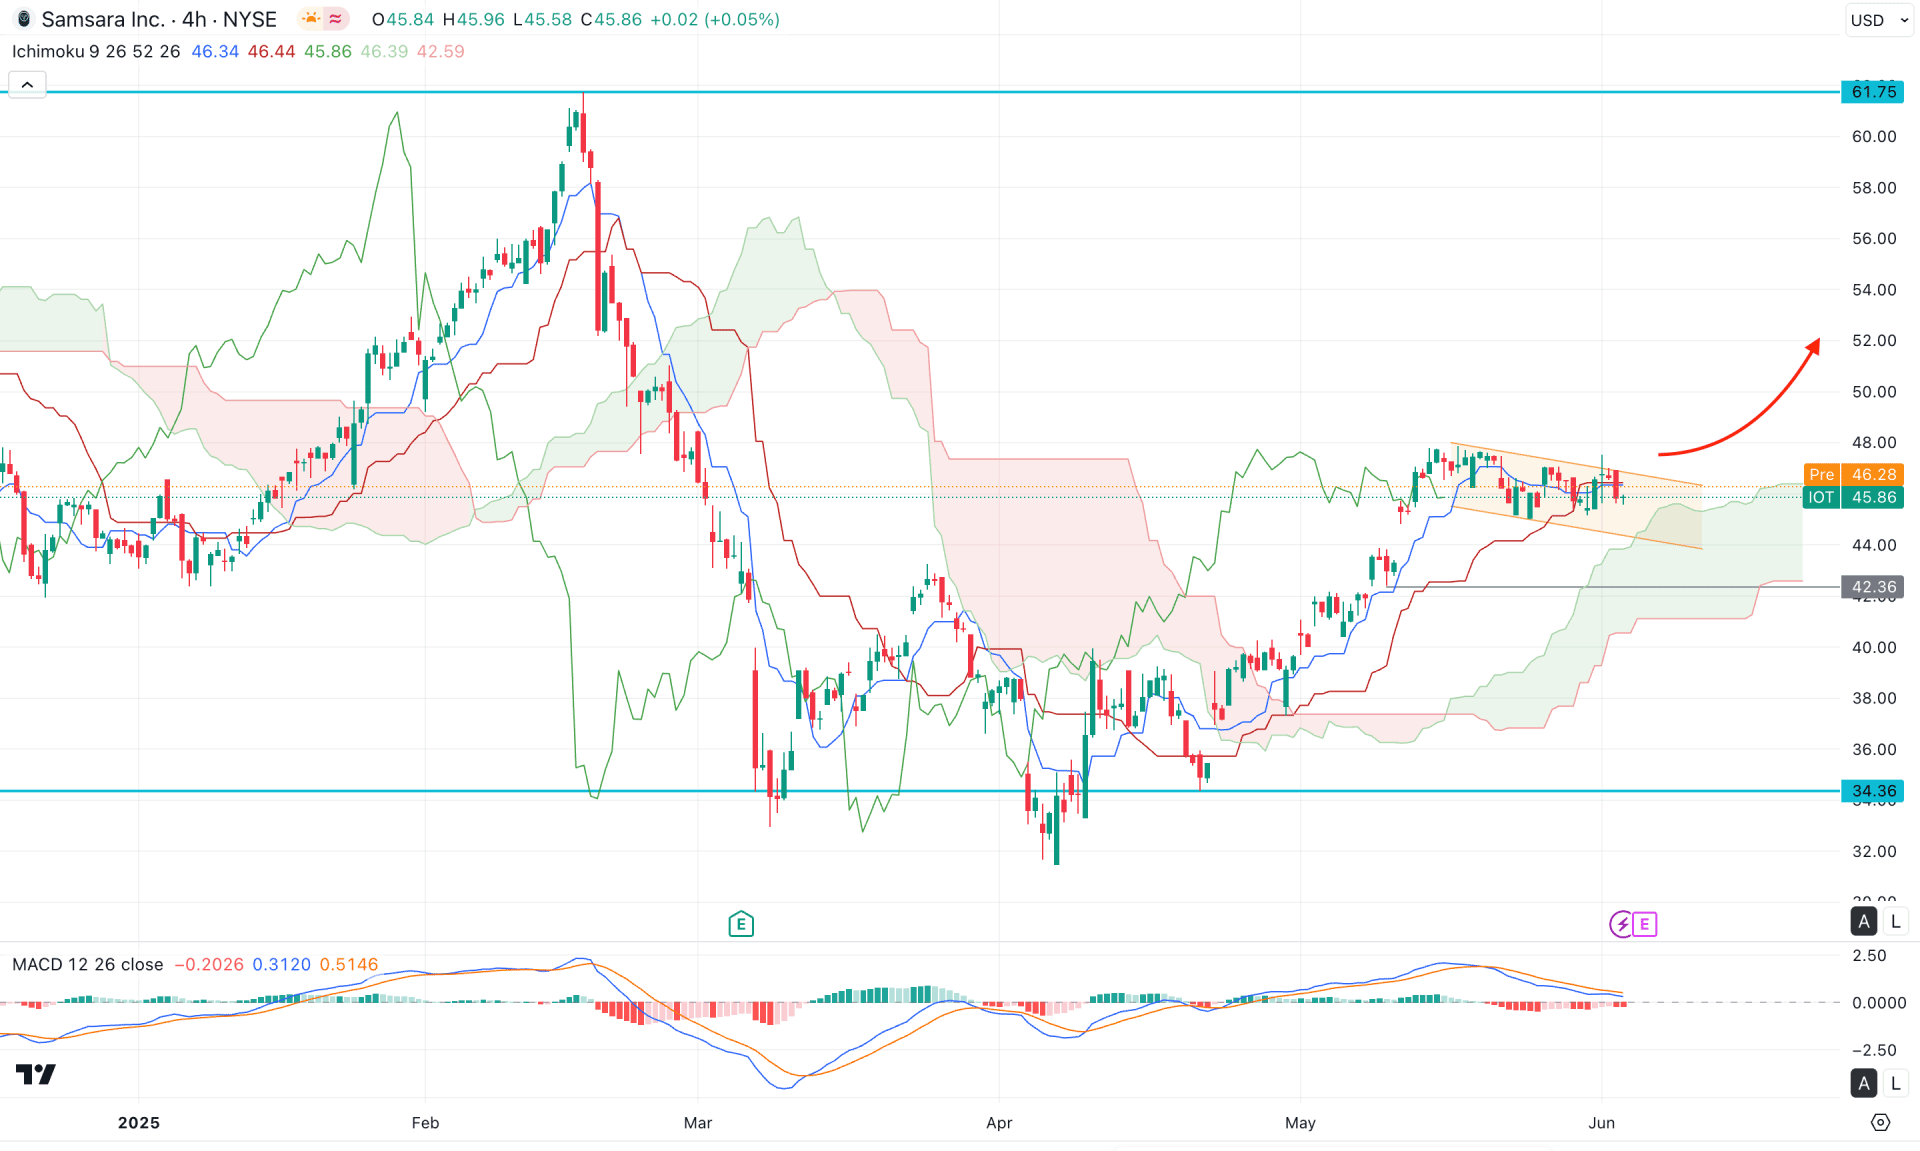
In the H4 timeframe, the recent price is trading sideways after reaching the peak above the Ichimoku kumo Cloud zone. Moreover, the Future Cloud looks positive to bulls as both lines are aiming higher.
In the secondary indicator window, the MACD Histogram reached the neutral point, while the Signal Line hovers above the positive zone.
Based on this outlook, the ongoing sideways pressure within the descending channel might find a path after having a bullish reversal above the cloud resistance. In that case, an H4 candle above the 48.00 high could be a potential long opportunity, aiming for the 61.75 resistance level.
The alternative trading approach is to find the price below the 42.36 support level, which might extend the selling pressure towards the 34.36 level.
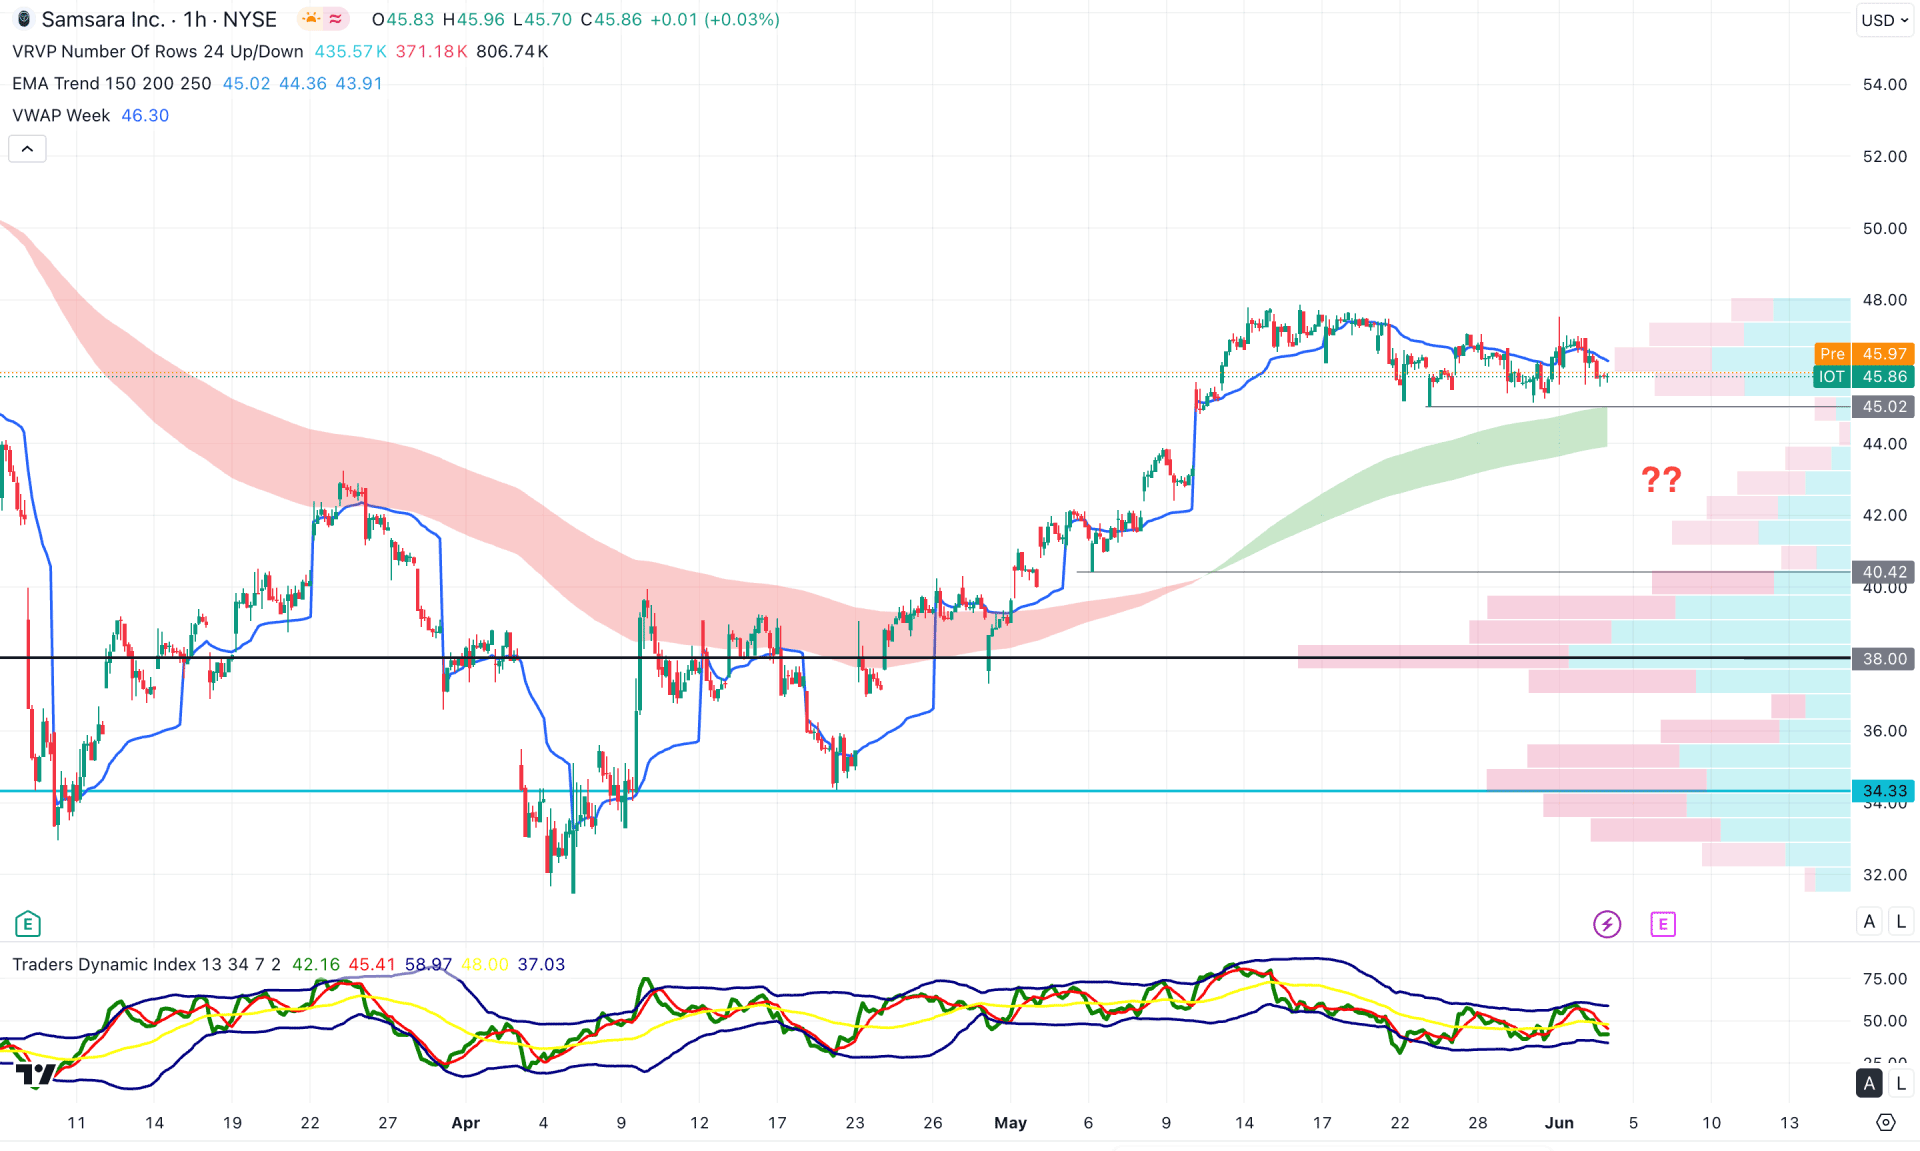
In the hourly chart of IOT, the recent price is trading sideways at the intraday peak, suggesting buyers' dominance in the market. Moreover, the Moving Average wave is below the current price, working as a confluence bullish pressure.
In the volume structure, the intraday high volume line is also below the current price, suggesting an ongoing buying pressure from institutions.
The upcoming earning report will be a crucial event to look at for this stock as a better-than-expected report could extent the intraday bullish pressure immediately after overcoming the 48.00 level.
On the other hand, a deeper correction is possible towards the 42.00 to 38.00 zone, but a selling pressure with a consolidation below the 38.00 level might lower the price in the coming hours.
Based on the current market outlook, IOT is more likely to extend the buying pressure after having a valid daily close above the 48.00 level. As analysts are optimistic about the upcoming earnings release, a better-than-expected report with validation from the price action could be a potential long opportunity.


