
Published: September 20th, 2023
In recent months, Salesforce, Inc. (NYSE: CRM) has been a focal point on the NYSE, with its stock price oscillating between $234 and $204 per share.
The central question is whether the current trading price of $215 accurately reflects the true value of this large-cap company or whether it is currently undervalued. We will analyze Salesforce's outlook and value based on its most recent financial data to determine this.
A valuation model estimates Salesforce's intrinsic value to be $351.97, which is significantly higher than the stock's current market price of $215. However, given the stock's volatility, it may experience additional price fluctuations in the future.
Salesforce's development prospects are promising. In the coming years, earnings are expected to double, indicating a promising future and stronger cash flows. However, CRM's undervaluation suggests that current shareholders may wish to increase their holdings, as the optimistic outlook has not been completely priced in.
Is it the right time to buy Salesforce stock? Let's see the upcoming price direction from the Salesforce Stock (CRM) technical analysis:
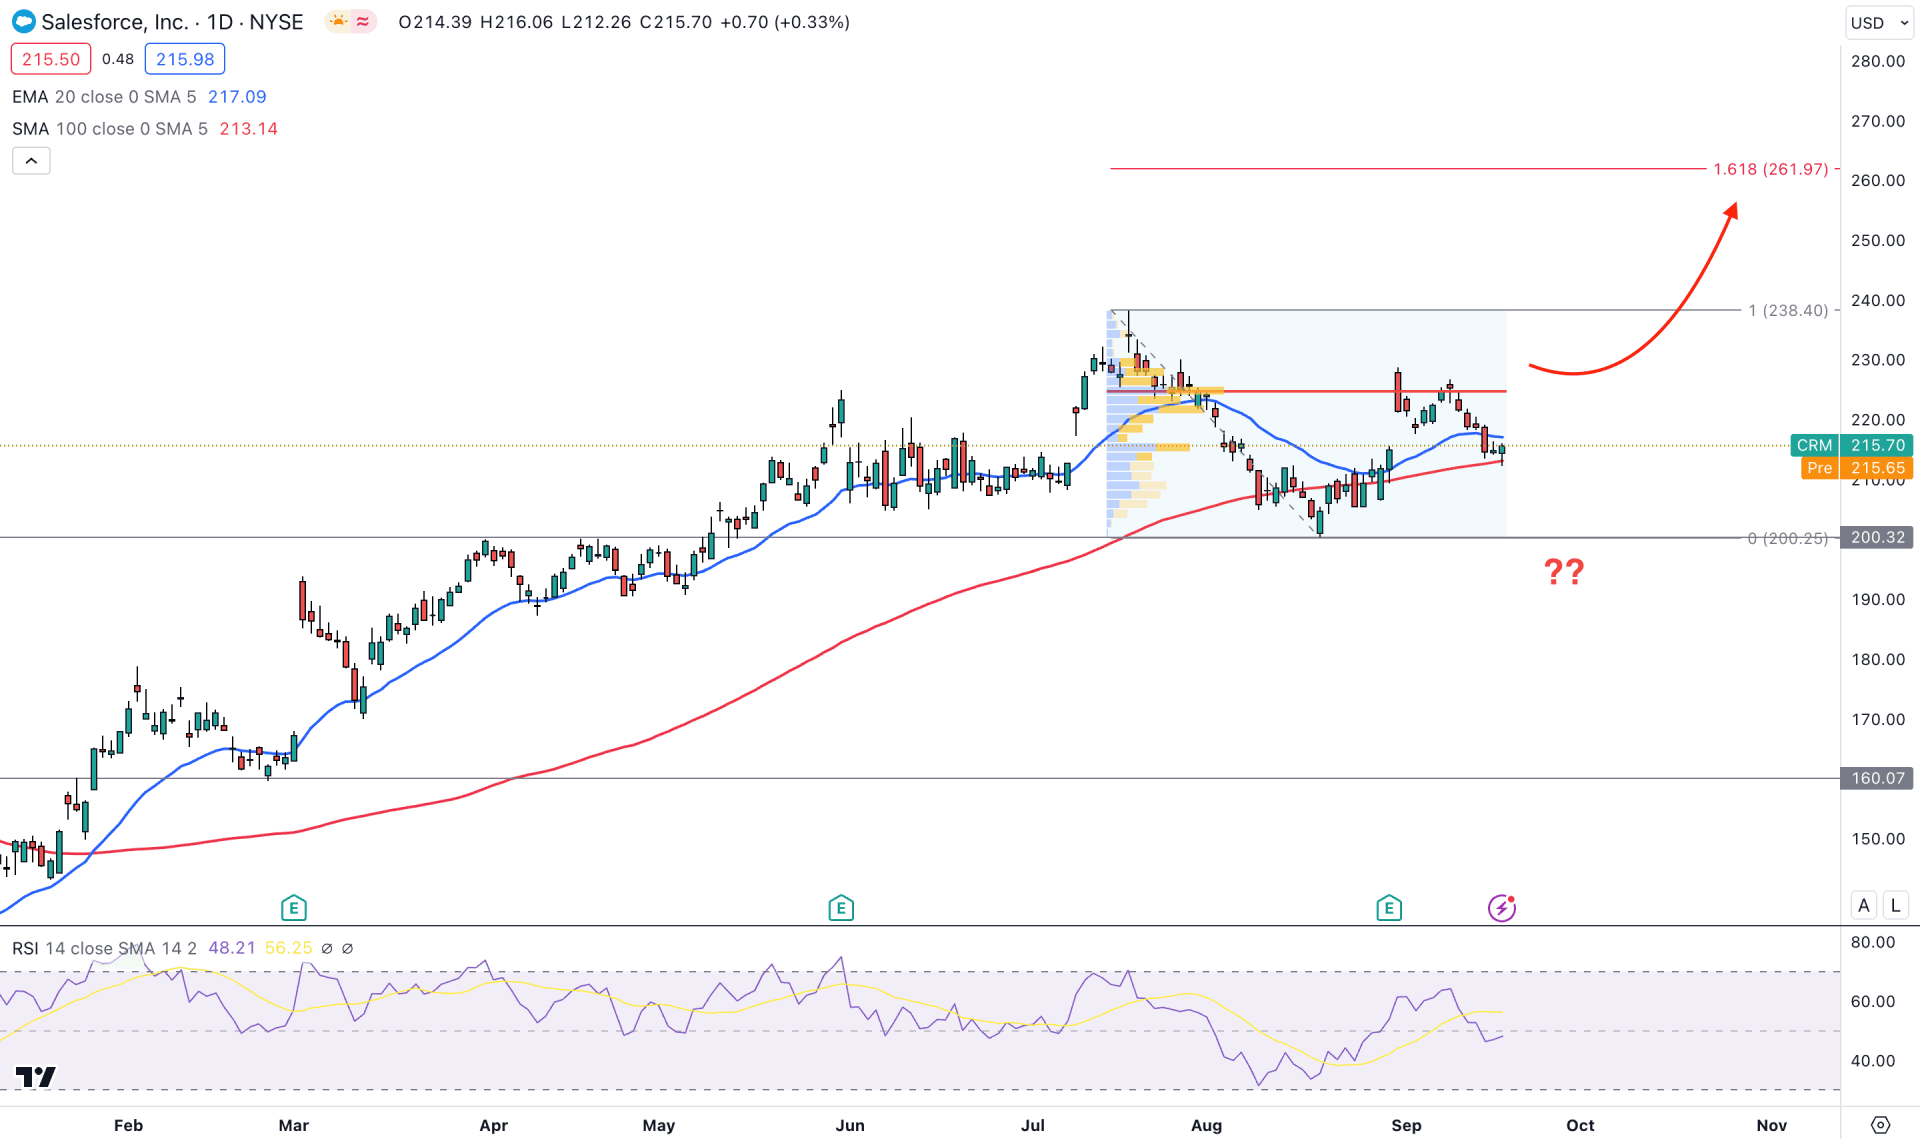
In the daily chart, the overall market momentum of CRM is strongly bullish, where any trend continuation strategy could work well.
In the higher timeframe, the broader view is bullish as a bullish fakey formation backs the current monthly candle. However, the recent weekly candle closed with a bearish engulfing bar, which could be a challenging factor for bulls. In that case, any long-term trend continuation needs a valid violation of the weekly engulfing bar, where a daily candle above the 225.93 level would be a conservative long signal.
In the volume structure, the largest activity level since 23 July is at 224.62 level, which is 4% above the current price. In this structure, a bullish trend continuation needs a stable market above the 225.00 level before approaching the 237.95 swing high.
In the daily chart, a deeper discount was initiated after the price moved below the 20-day EMA level. However, the 100-day SMA level is still intact, which could be a strong barrier for buyers. The corrective movement is also visible from the 14-day RSI level, which is at the 50.00 line.
Based on this outlook, investors might expect the bullish trend to continue after breaching the 228.72 near-term high. In that case, the upward pressure could extend towards the 237.96 and 261.24 levels, potential Fibonacci Extension levels from the 237.95- 200.32 zone.
On the bearish side, a deeper discount is possible if a strong bearish candle comes below the 100-day SMA level. In that case, downside pressure may extend toward the 160.00 psychological level.
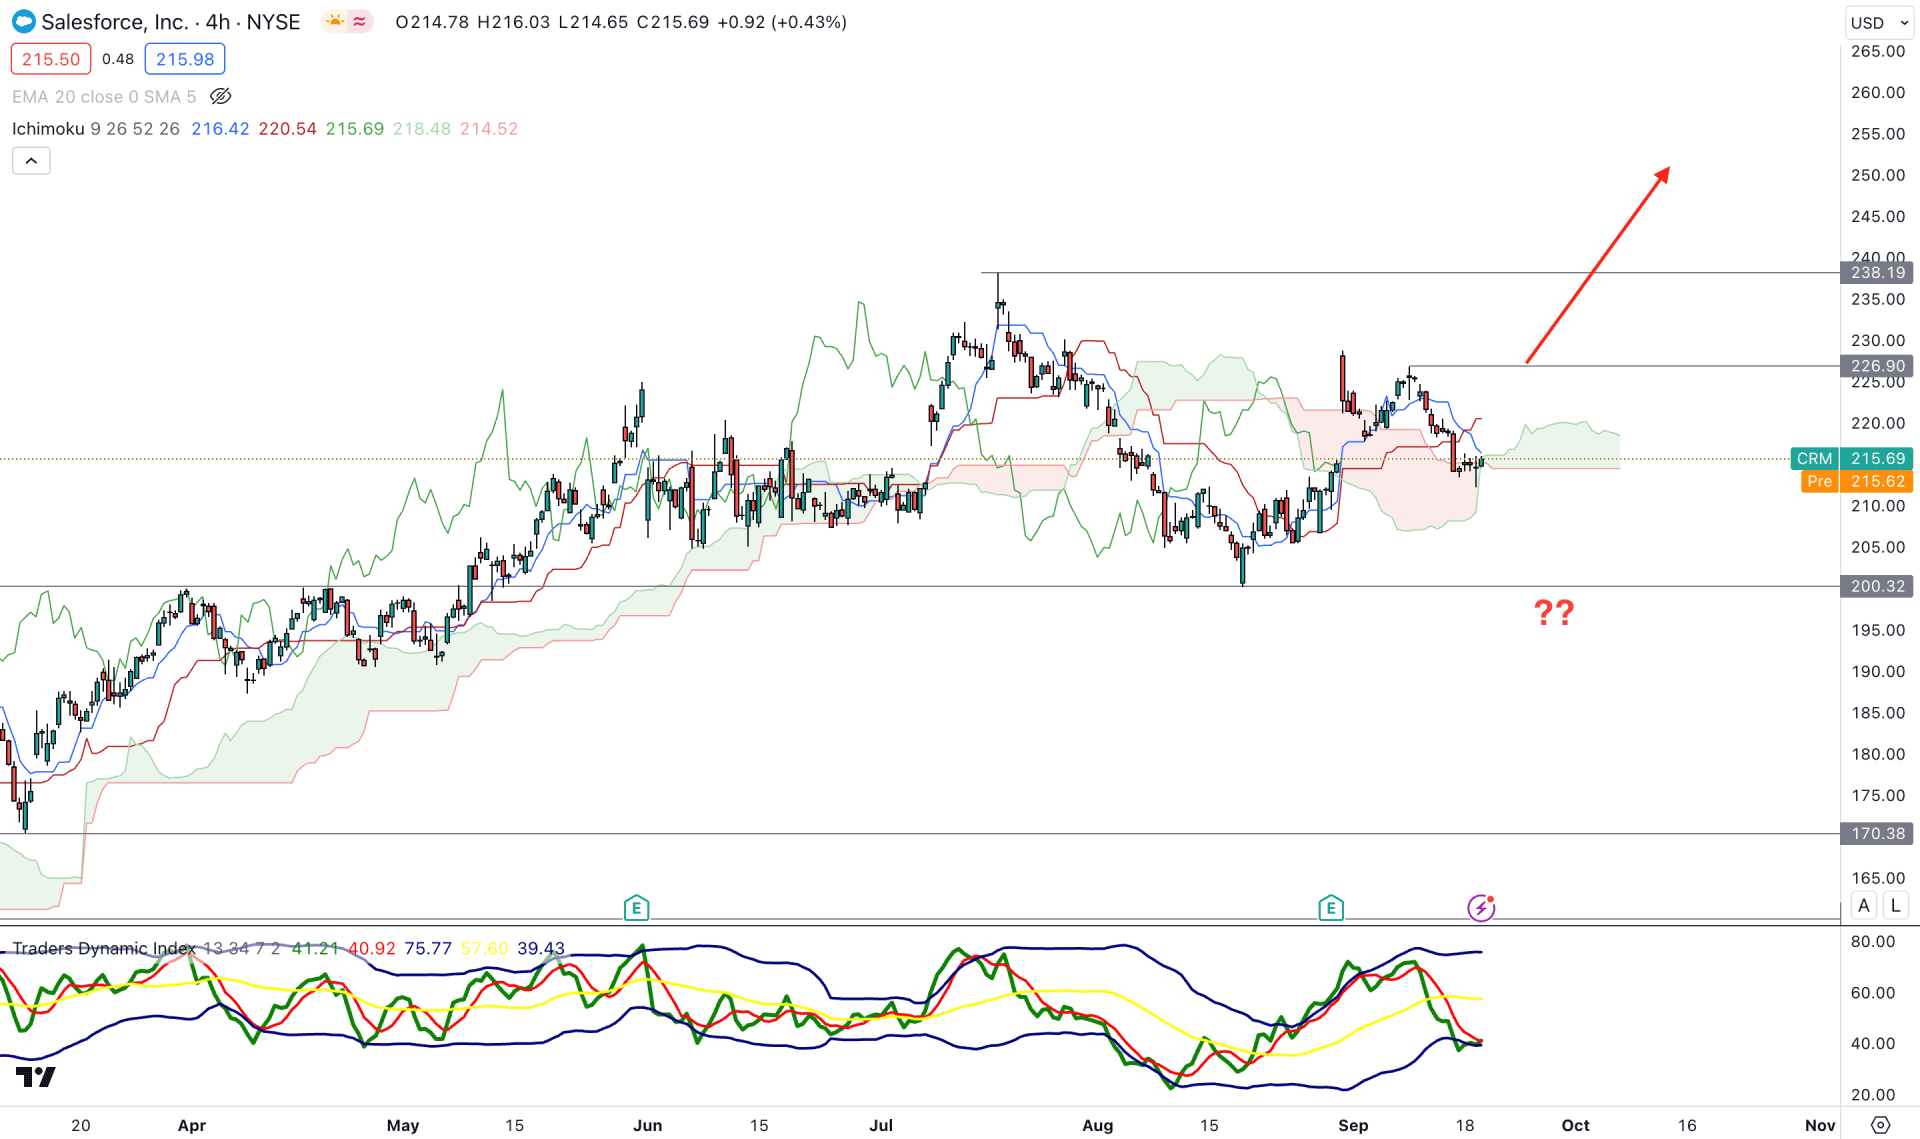
In the intraday price, the overall market momentum is corrective as the current Senkou Span B is flat. However, the Senkou Span A is above the Senkou Span B, which indicates an active buyers’ presence in the market.
In the secondary window, the Traders Dynamic Index level (TDI) reaches the oversold zone, from where a bullish recovery is possible. However, a decent recovery above the 50.00 line is needed to anticipate a strong bullish momentum.
In the H4 timeframe, a bullish recovery is limited by the bearish crossover among dynamic Ichimoku lines. In that case, a strong bullish H4 candle above the 226.90 is needed before aiming for the 260.00 critical zone.
On the other hand, the existing bearish continuation with an H4 candle below the 200.00 psychological level could extend the loss toward the 170.38 support level.
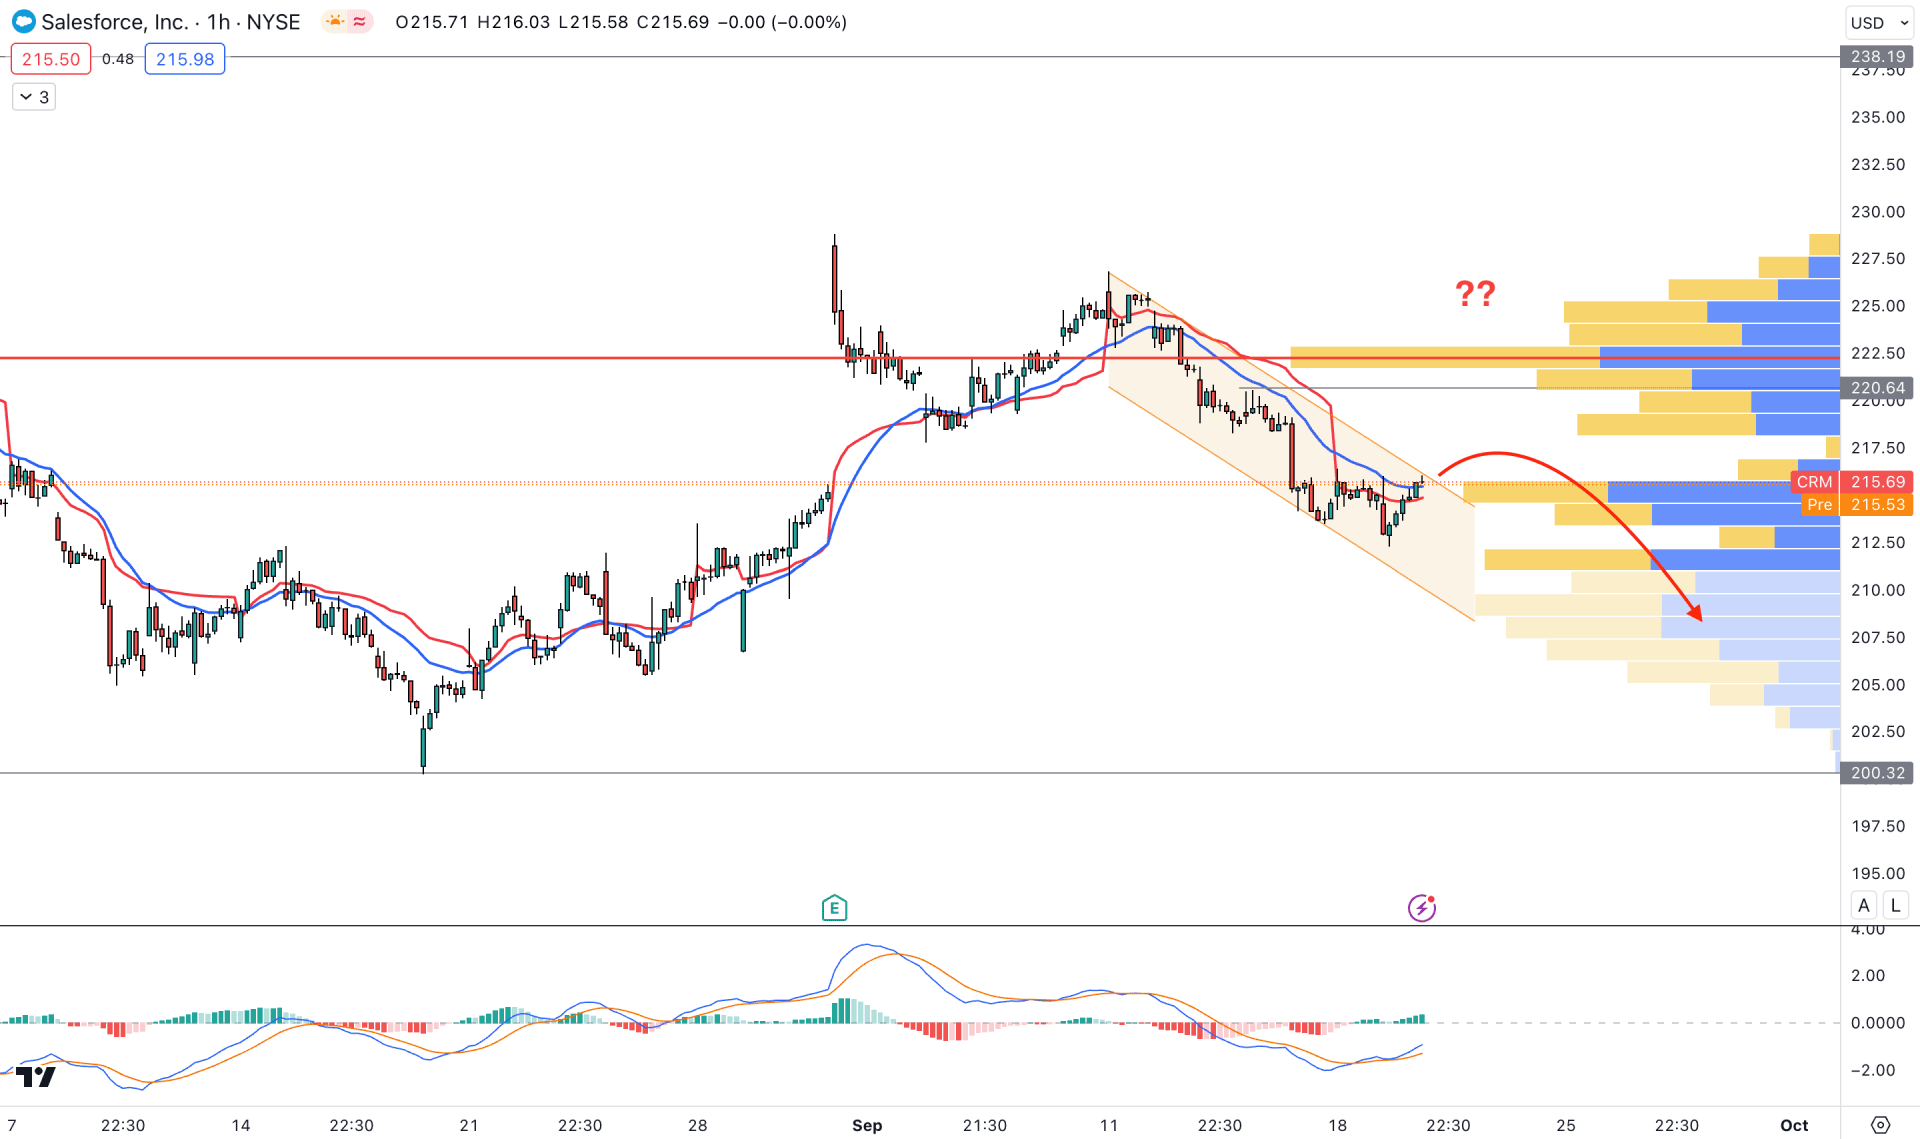
In the H1 chart, the current price trades below the 20 EMA and weekly VWAP, which signals an active intraday selling pressure. Moreover, the visible range high volume level is above the current structure, which could be an immediate barrier to bulls.
A different story is visible in the indicator window as the current MACD Histogram is bullish, supported by an upward pressure on Signal lines.
Based on this structure, a strong channel breakout with an H1 close above the 222.17 level could be a long signal, targeting the 240.00 level.
On the other hand, an immediate buying pressure and a recovery below the 20 EMA could extend the downside momentum towards the 200.00 psychological level.
Based on the current multi-timeframe analysis, the overall market momentum for the CRM stock is bullish, whereas the intraday price is still bearish. Investors should wait for a solid bottom to form in the H1 timeframe before joining the daily rally.


