
Published: September 2nd, 2025
Salesforce reported $9.83 billion in sales last quarter, rising 7.6% year over year and 0.8% above analysts' revenue projections. The company had an excellent quarter, exceeding both the analysts' EBITDA and billing projections by a significant margin.
Analysts predict that Salesforce's revenue will increase 8.7% year over year to $10.14 billion this quarter, matching the 8.4% gain it saw in the similar quarter last year. It is anticipated that adjusted earnings will be $2.78 per share.
Some of Salesforce's competitors in the marketing and sales software sector have already released their Q2 numbers, which gives us an idea of what to anticipate. Freshworks announced revenues of 17.5%, exceeding projections by 2.9%, and HubSpot posted year-over-year sales growth of 19.4%, surpassing analysts' expectations by 2.9%. Freshworks saw a 2.5% decline in trading after the results, while HubSpot saw a 5.8% decline.
Given that share prices have increased by an average of 3.2% over the past month, buyers in the marketing and sales software sector are feeling optimistic. Salesforce has risen 1.6% over the same period and is targeting a typical analyst price of $344.62 going into earnings.
Let's see the further aspect of this stock from the CRM technical analysis:
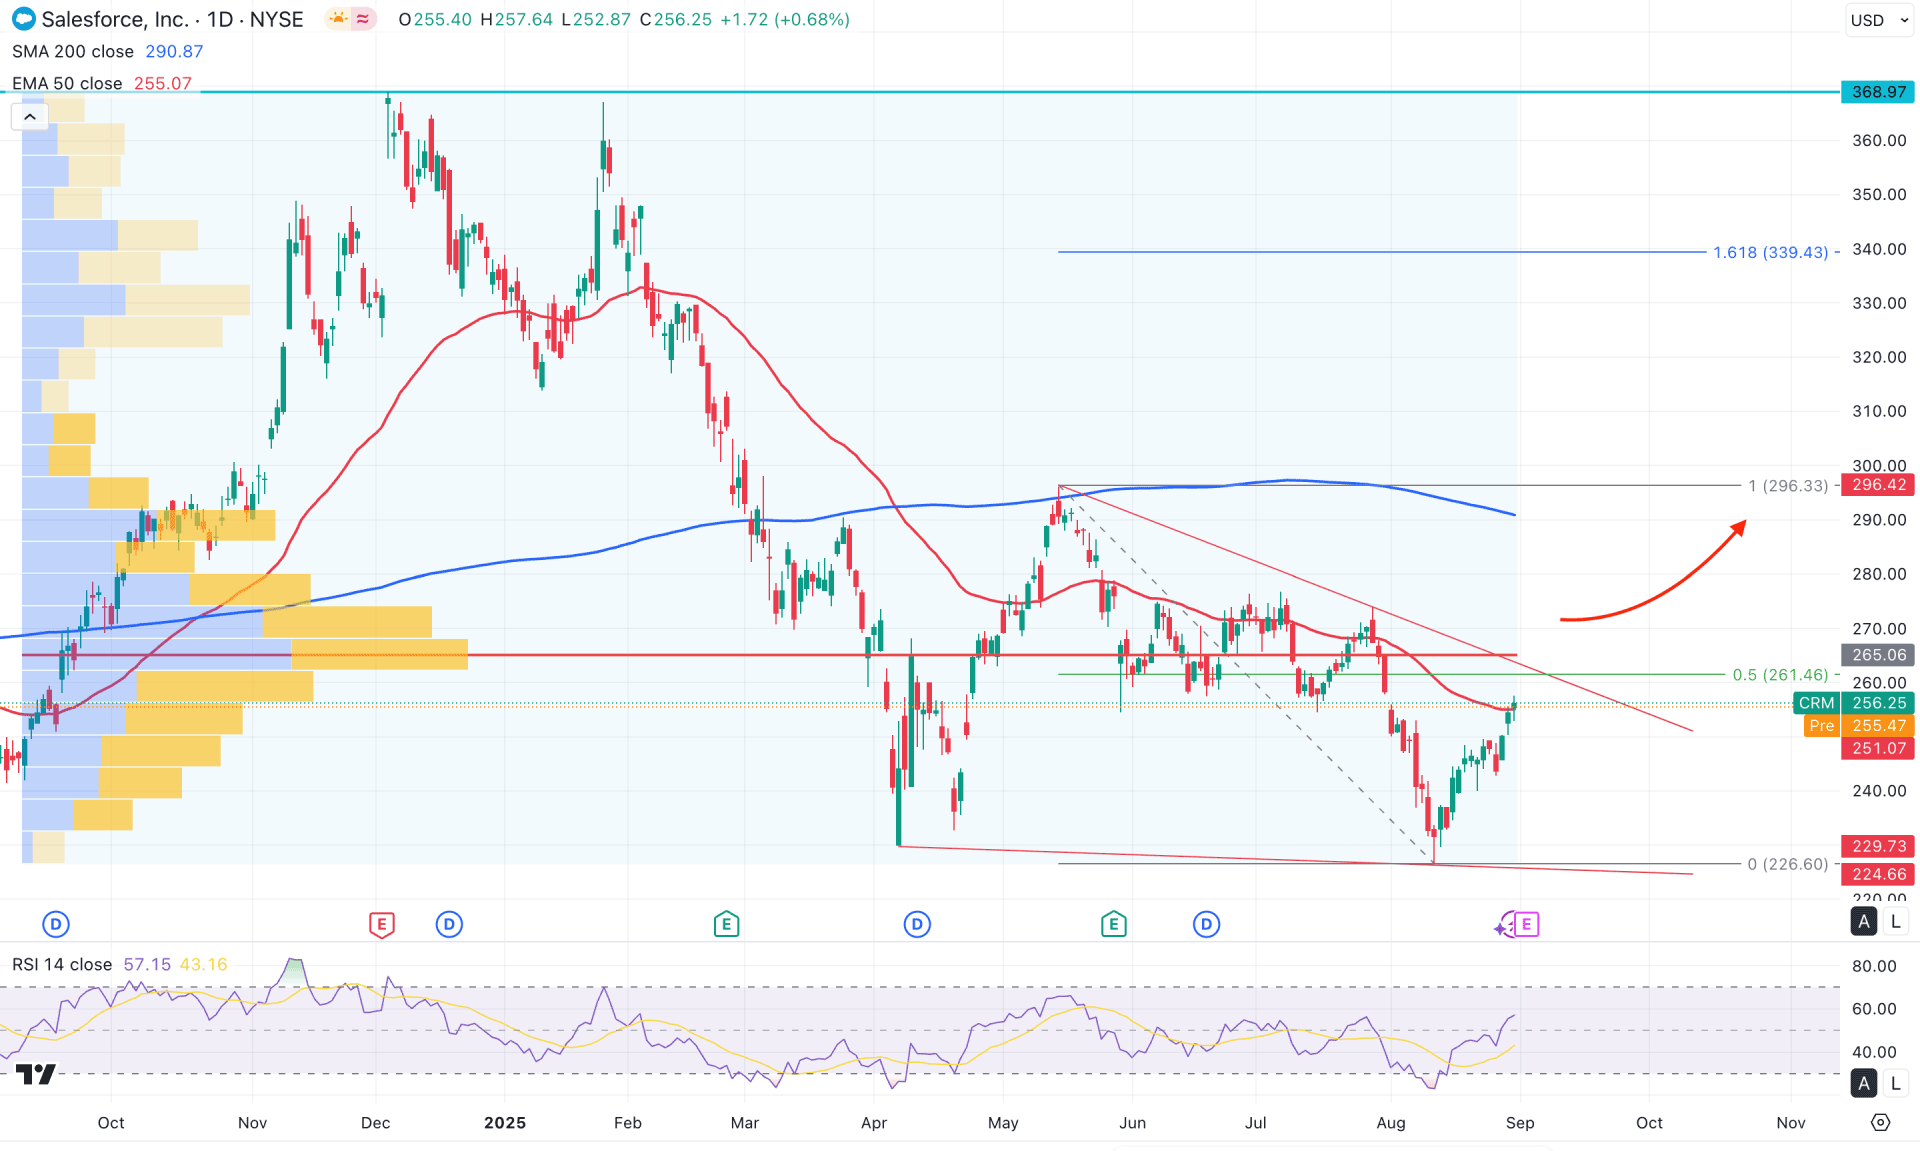
In the daily chart of CRM stock, an extended downside correction is observed from the 368.37 level to the 224.66 level, signaling a valid correction. However, the most recent price action is forming a potential reversal pattern, suggesting that investors may consider entering a bullish rally from a discounted trading zone.
In the higher timeframe, the broader market momentum remains bullish as a strong liquidity sweep occurred below the April 2025 low. However, the most recent monthly candle is still trading below the July 2025 low, and investors should monitor how the price recovers from this area. On the weekly chart, the outlook appears optimistic, as the 200-week Simple Moving Average has acted as strong support. Still, the ongoing pressure from the static trendline resistance could act as a barrier.
In terms of volume, the price is still trading below the key consolidation area where a large number of orders are clustered. Based on the high-volume indicator, the most active level since September 2024 is around the 265.10 level. As long as the current price trades below this high-volume level, selling pressure may continue to expand.
In the daily price structure, a solid bottom has yet to form as the price is moving within a falling wedge pattern. A bullish breakout from this wedge, confirmed by valid price action above the high-volume level, could provide a long opportunity.
On the bearish side, the price remains below the 200-day SMA, while the 50-day EMA is acting as immediate resistance.
In the secondary indicator window, the Relative Strength Index (RSI) has rebounded strongly from the 30.00 oversold line, supporting the case for a potential bottom formation.
Overall, the bullish scenario requires further confirmation, such as a wedge breakout followed by consolidation above the 265.00 level. In that case, the price is likely to test the 296.33 resistance level before targeting the 339.43 Fibonacci Extension area.
Conversely, a sideways market between the 50-day and 200-day Moving Averages could create challenges for buyers. Failure to break above the wedge resistance, followed by an immediate rebound, could signal a buy-side liquidity grab. In such a scenario, valid price action below the 50-day exponential moving average could extend downside pressure and test support near the 226.60 level.
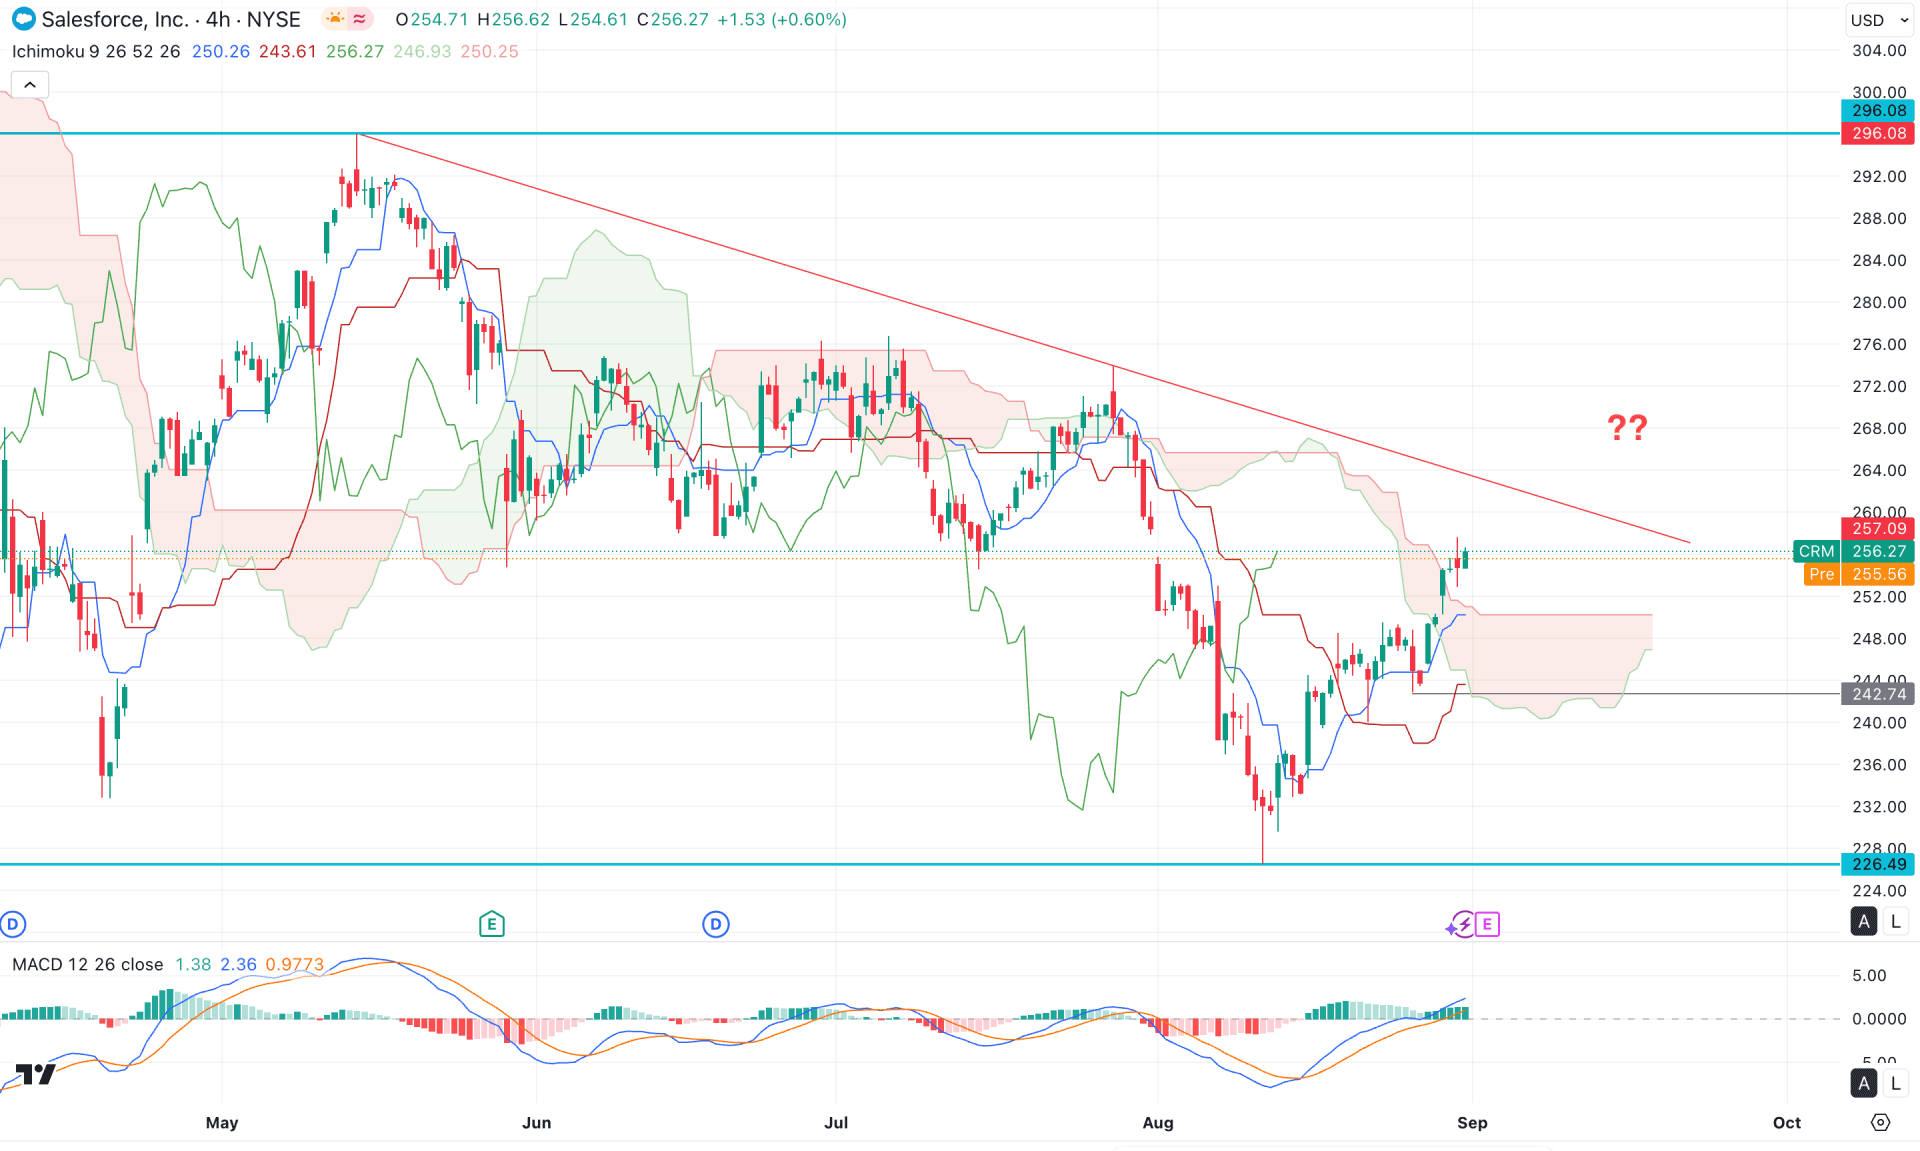
In the four-hour timeframe, a drop-base-drop formation is visible, but the current price is struggling to maintain momentum above the cloud area.
According to the Ichimoku Cloud, a bullish crossover has formed between the dynamic lines, with Senkou Span A starting to move toward the flat Senkou Span B.
In the secondary indicator window, the MACD histogram has maintained a bullish stance for a considerable period. However, the signal line has recently returned to the neutral area after the earlier crossover.
Based on this outlook, the primary focus should be on long opportunities, as a bullish engulfing candle has appeared above the cloud area. In that case, consolidation above the cloud followed by a breakout above the trendline resistance could present a high-probability long setup, targeting the 296.08 level.
On the other hand, failure to hold above the cloud level, with an immediate break below the 242.198 level, could extend the ongoing downside pressure and potentially drive the price lower toward the 226.49 support level.
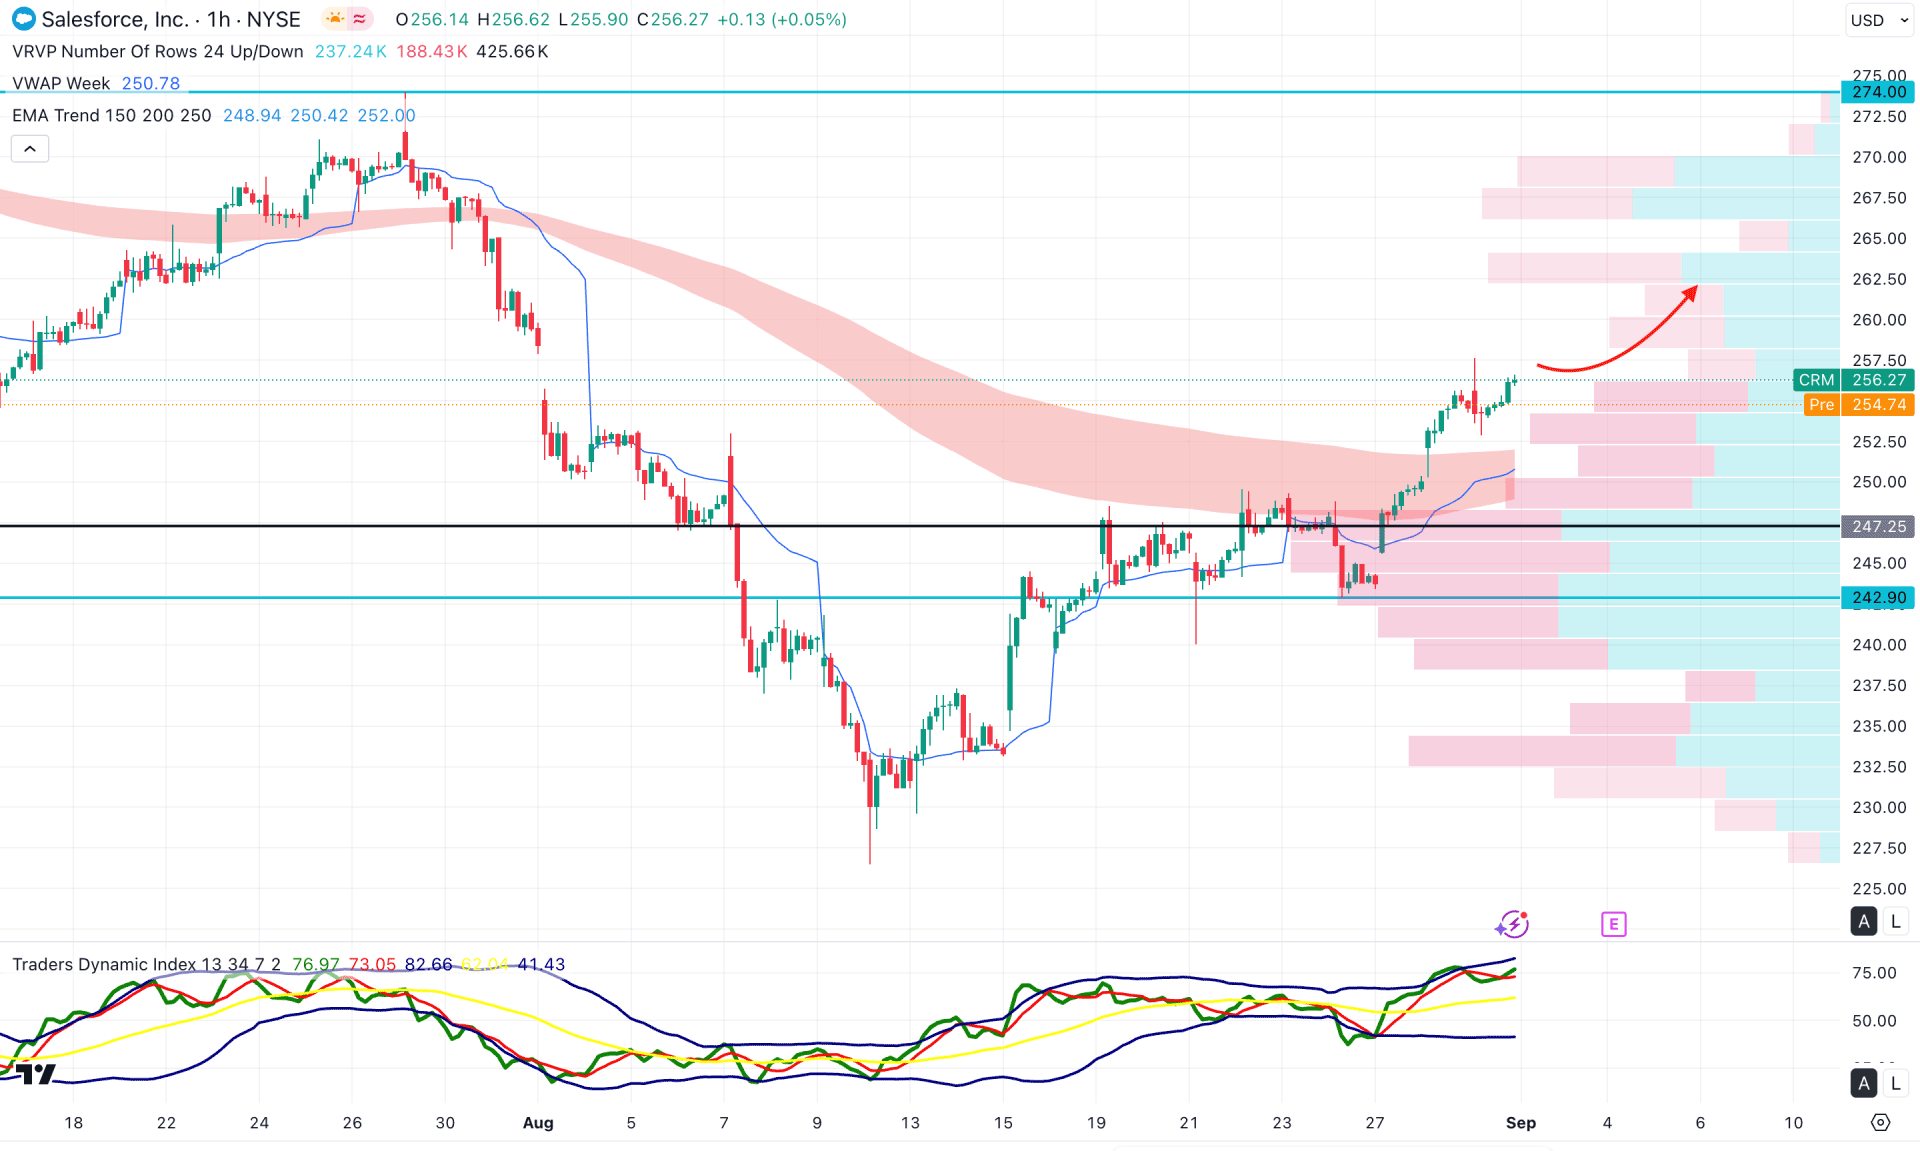
In the hourly timeframe, the current price is trading within a bullish trend as a breakout has appeared above the exponential moving average. Moreover, the weekly VWAP level is positioned below the current price, which helps maintain buying pressure.
In the secondary indicator window, the Traders Dynamic Index (TDI) has shifted into a bullish position and moved above the 50.00 neutral line. As the current TDI line is hovering around the 70.00 area, further buying pressure can be expected.
Based on the current market outlook, investors should closely monitor how the price reacts above the 247.25 high-volume line. The primary aim is to look for a bullish reversal from the weekly VWAP level, which could extend momentum toward 274.90.
On the other hand, an alternative trading approach would be to watch for an immediate bearish break below the 242.90 level, which could pave the way for a move toward the 227.50 support level.
Based on the current market structure, CRM is trading within a bullish pre-breakout structure from where a valid confirmation is needed before opening a long position. Investors should closely monitor how the price breaks out from the falling wedge pattern, as no confirmed buying possibility is visible now.


