
Published: December 25th, 2025
As investors reevaluate the prospects for U.S. small-cap stocks going into 2026, market sentiment regarding the Russell 2000 has become more positive. In comparison to the S&P 500, small-cap companies are still trading at a significant valuation discount, around 35% under their 20-year median relative price-to-earnings ratio.
Given their greater sensitivity to borrowing rates and domestic economic circumstances, expectations of rate cuts by the Federal Reserve in 2026 — possibly once in the first half of the year. Crucially, recession risks are still low, mitigating a major danger to stock bull markets and bolstering a favorable macroenvironment.
Elevated valuations by themselves are not thought to be an adequate trigger for an economic downturn, even though the larger U.S. stock markets are trading close to all-time highs with historically small margins of safety.
Rather, the bullish argument for small caps is supported by growing growth forecasts, robust GDP patterns, and long-term indicators including compounded returns and value normalization. In light of this, the Russell 2000 is seen as a possible beneficiary of a return to the mean, especially given the signals of tiredness in the leadership levels in large-cap indices.
The next technical analysis of the Russell 2000 index is based on that basic and sentiment-driven environment.
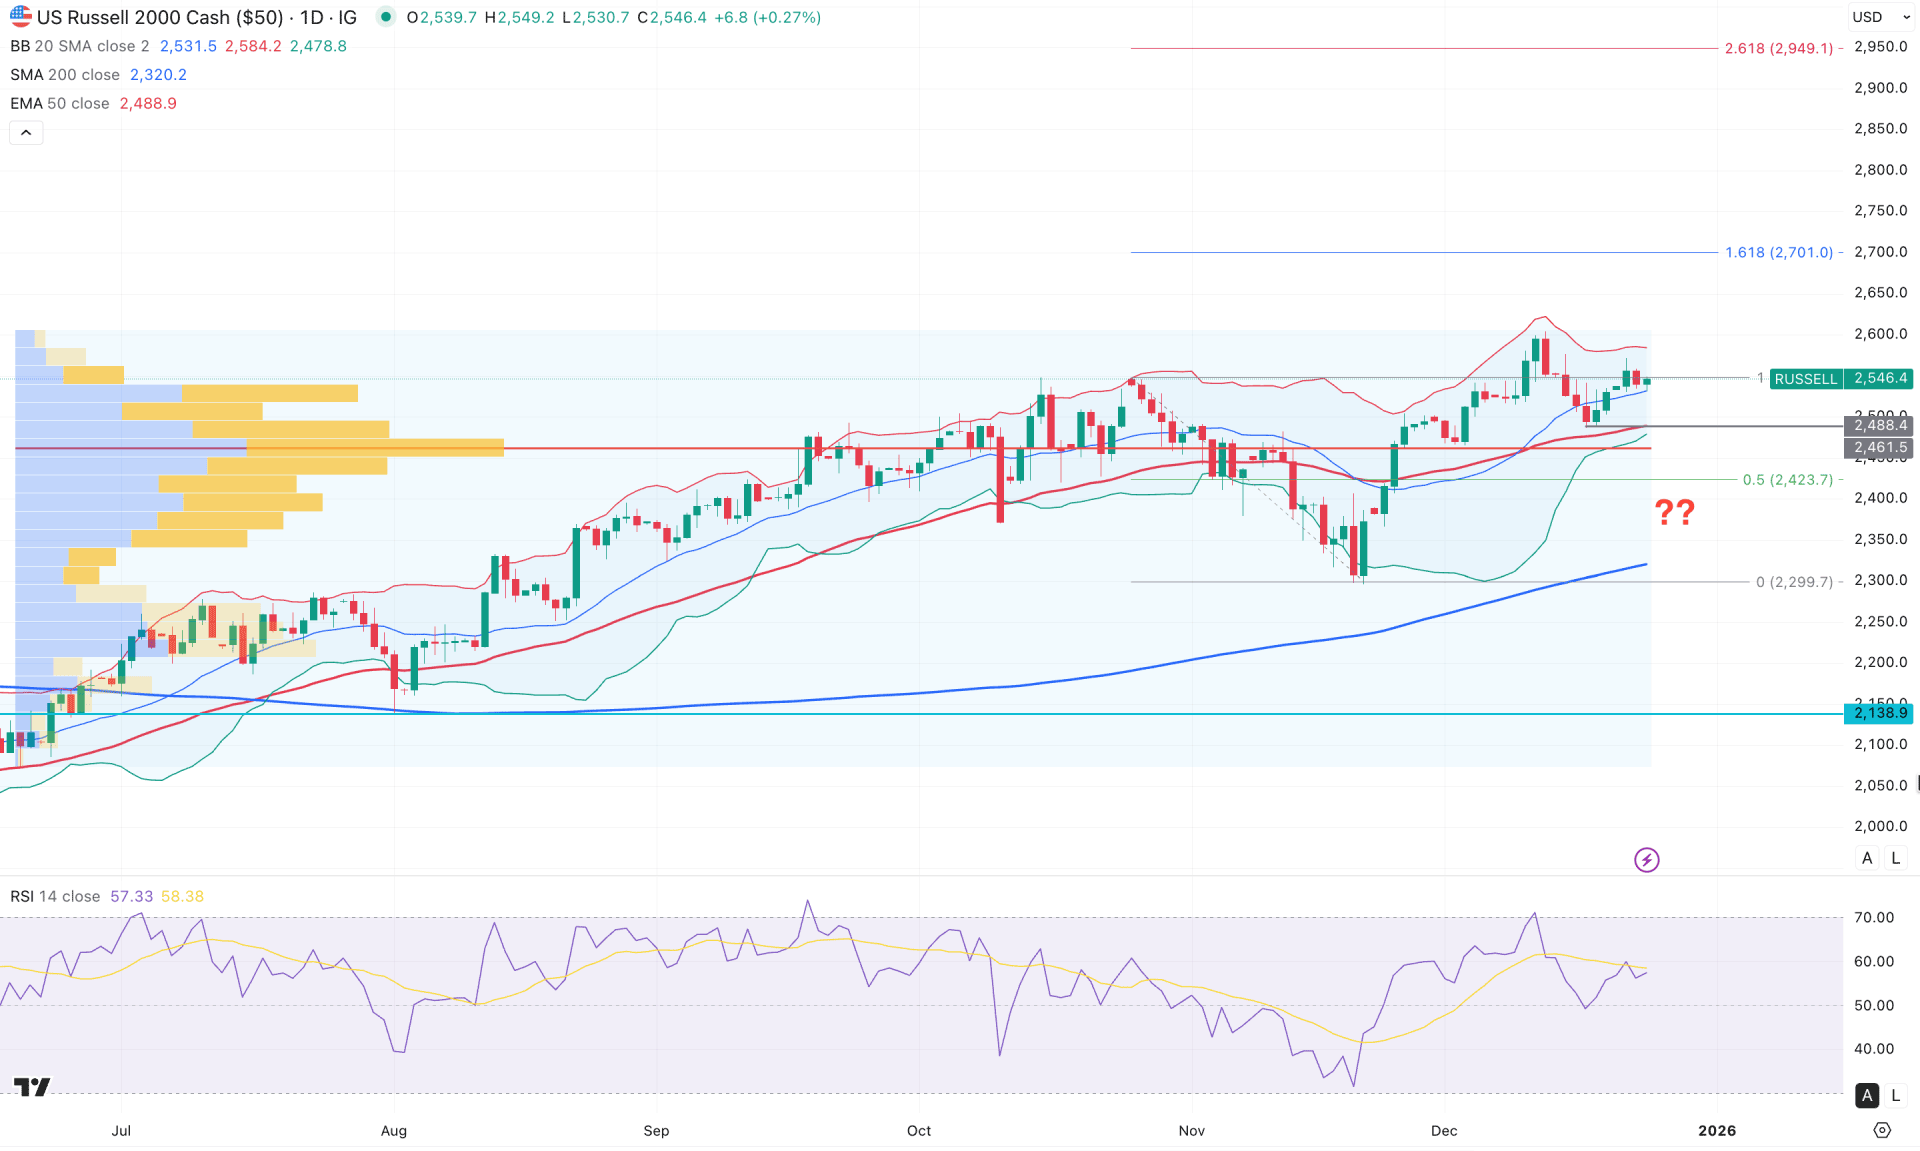
On the daily chart of the Russell 2000 (RUT), the recent bullish recovery from the 2299.70 level marks a significant achievement for buyers, creating scope for further upside in the coming trading days. In the most recent sessions, price action has moved sideways after testing the all-time high level, with no meaningful selling pressure at the top.
From a higher-timeframe perspective, the broader bullish structure has remained intact since signs of exhaustion appeared in April 2025. Since then, prices have continued to advance, forming eight consecutive positive monthly closes. On the weekly timeframe, the index is consolidating near its all-time high, where an extended volatility at premium levels may signal the potential downside correction.
On the main price chart, volume dynamics remain favorable for buyers. The highest volume activity since June 2025 is concentrated around the 2461.50 level, which currently sits below the market price and acts as a strong demand zone. Additionally, the most recent price action has formed a bullish reversal from the volume support, suggesting the potential for bullish pressure.
On the daily chart, the price is holding above the mid Bollinger Bands Line, while the lower band is acting as immediate support. The 200-day SMA is providing major support, reinforced by a bullish crossover near the 2300.00 psychological level. Although a short-term downside correction cannot be ruled out, the broader market trend remains bullish.
The Relative Strength Index (RSI) indicator shows stabilization above the 50 neutral level, with the current reading approaching the 60 level, reflecting sustained bullish momentum.
Based on the overall market structure, a minor pullback toward the 2488.40 level could strengthen the bullish outlook at any time. In such a scenario, bullish price action from the mid Bollinger Bands line or the 50-day EMA may present a potential long opportunity, targeting the 2600.00 level. Following the swing structure formed in October and November, the ultimate upside target for the broader rally stands near 2701.00, which corresponds to the 161.8% Fibonacci extension level.
On the downside, a failure to hold above the 2461.50 volume area could pose a near-term challenge for buyers and increase the probability of a retest of the 200-day SMA. Moreover, sustained selling pressure accompanied by a daily close below the 2300.00 level could expose the index to deeper losses, toward the 2100.00 level.
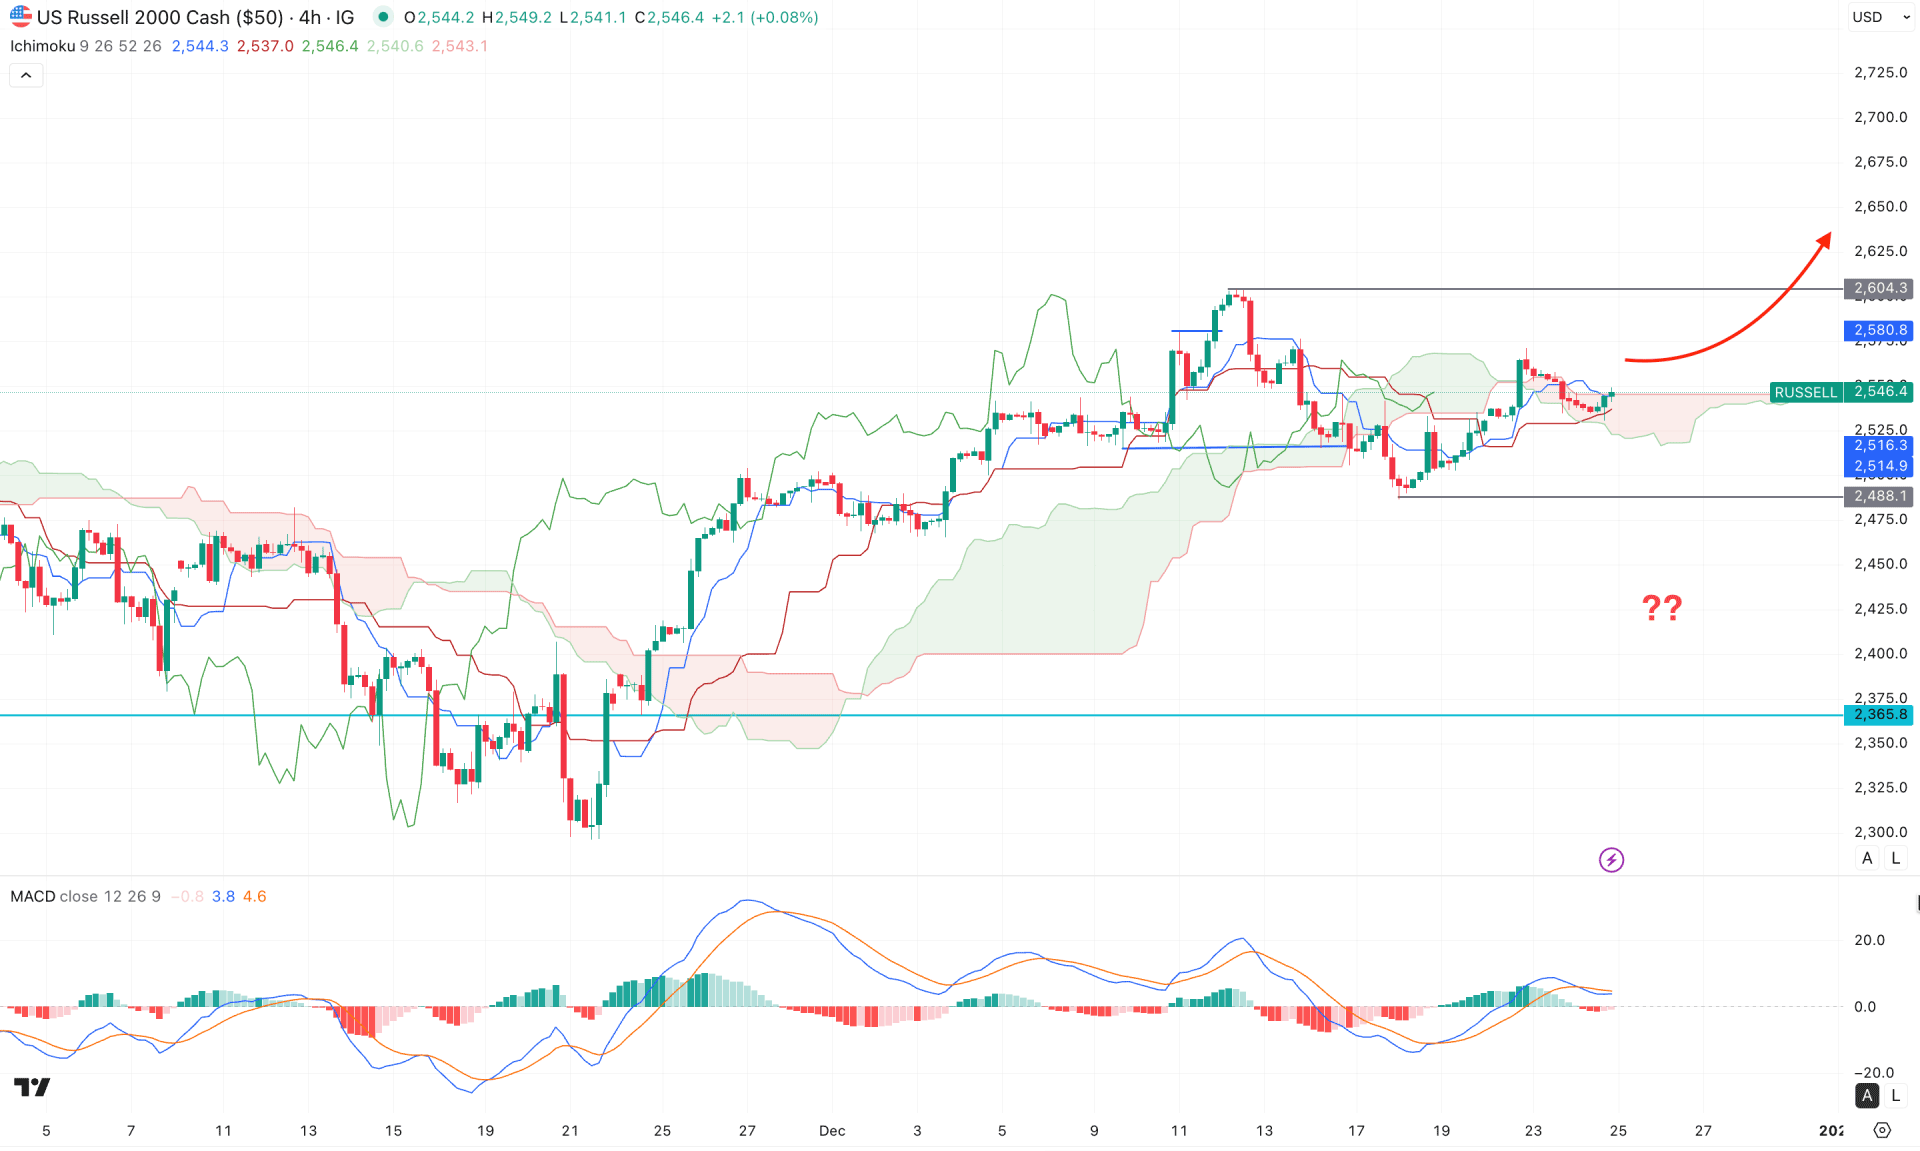
On the H4 timeframe, the Russell 2000 is trading within a corrective phase while remaining supported by the broader bullish trend. The most recent price action has moved above the dynamic Ichimoku Cloud zone, indicating relatively stable buying pressure.
In the future cloud, Senkou Span A and Senkou Span B remain close to each other, signaling ongoing corrective market pressure. A bullish crossover in the future cloud, with Span A moving above Span B, could validate a bullish continuation opportunity in the coming hours.
In the secondary indicator window, the Traders Dynamic Index (TDI) is hovering near the neutral level with a flat signal line, which reflects corrective market conditions. However, a stronger bullish histogram close could confirm a bullish continuation setup.
From a market structure perspective, the Russell 2000 remains positioned for further upside. A bullish continuation would be validated following a positive candle close above the dynamic Kijun-sen line. In that scenario, the immediate upside target stands at 2604.30, followed by the 2750.00 area.
On the downside, a deeper pullback remains possible toward the 2488.01 level. If the price breaks below 2440.00, extended selling pressure toward the 2365.08 level could invalidate the current bullish structure at any time.
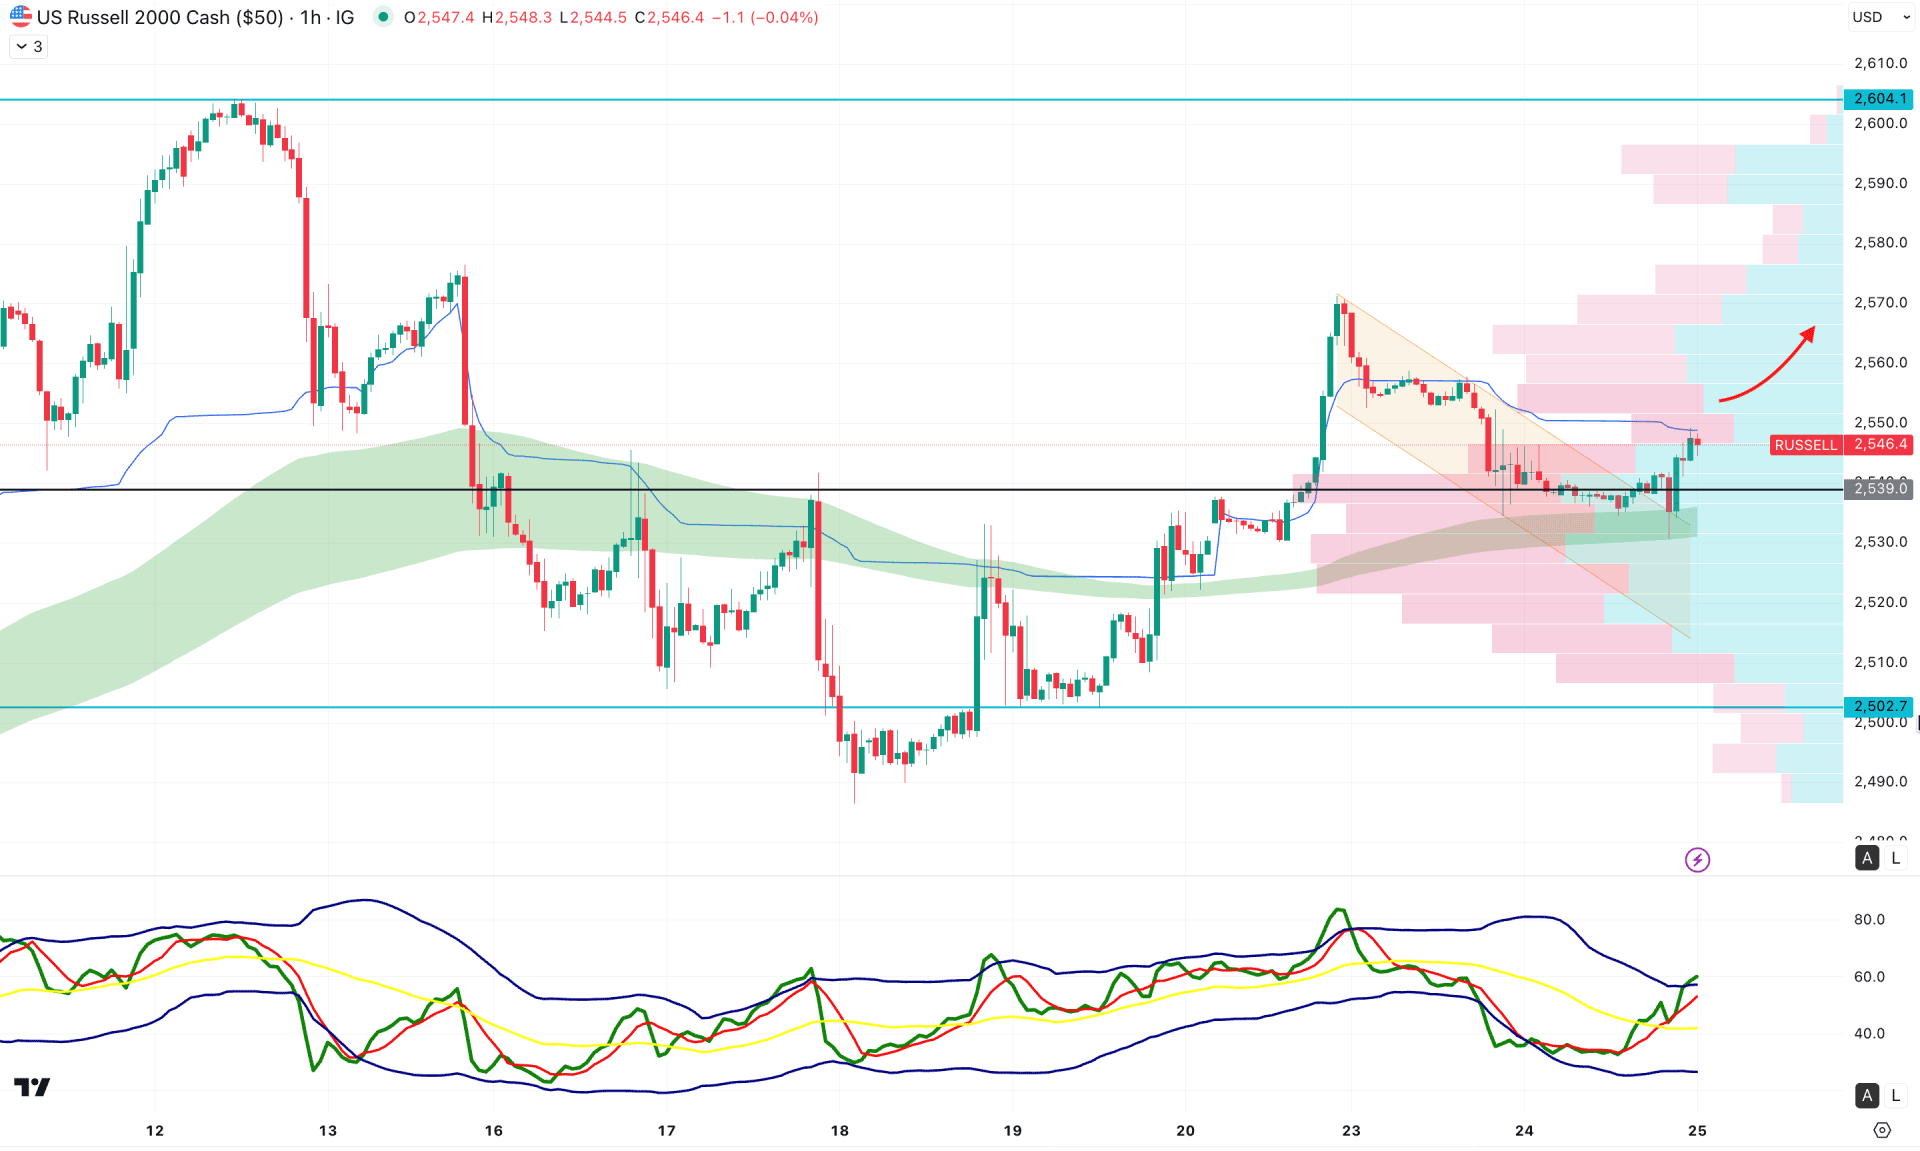
On the hourly timeframe, bullish pressure is evident as the recent price action formed a U-shaped recovery above the 2530.00 resistance level. Additionally, the high-volume line is positioned below the current price, from where a rebound has emerged, supported by a bullish engulfing pattern.
On the main chart, the weekly VWAP level is acting as an immediate resistance, while the exponential moving average wave remains below the current price, reinforcing the underlying bullish bias.
In the Traders Dynamic Index (TDI), the most recent line is holding above the 50–60 zone, which lies within the bullish territory, indicating sustained buying momentum.
From an overall outlook perspective, traders should monitor how the price reacts around the weekly VWAP level. A decisive breakout above the VWAP with a four-hour candle close could open the path toward the 2604.10 level.
Conversely, immediate selling pressure accompanied by an H4 candle close below the 2539.00 level could push the price into a corrective bearish phase, potentially leading to a test of the 2502.70 support level.
Overall, the Russell 2000 remains in a bullish trend, where recent pullbacks may allow the price to extend further toward new all-time highs. Investors should watch for signs of a valid bottom formation, as a bullish rebound from key support levels could present an early entry opportunity.


