Published: January 7th, 2025
RPM International, a manufacturer of coatings and sealants, released its fiscal second-quarter earnings today. Analysts anticipated that the firm would report quarterly profits of $1.339 each share, but the actual result was $1.390, representing an increase of 3.77%.
Moreover, quarterly revenue has reached $1.85 billion, which is also 3.15% higher than the anticipated $1.79 billion. The company has had a typical earnings surprise of 3.02% over the last four quarters.
The ongoing expansion of high-performance building development and renovation is helping RPM. Government initiatives to improve US infrastructure have increased competition for RPM's products.
RPM International Inc. has subsidiaries that lead the world in construction supplies, sealants, speciality finishes, and associated services. The company's four reportable business segments are consumer, building goods, performance coatings, and specialized products. Market-leading brands such as Rust-Oleum, Zinsser, DAP, DayGlo Varathane, Stonhard, Legend Brands, Tremco, Tremco, and Dryvit are among the many names in RPM's varied portfolio.
RPM's brands, from residences and places of employment to infrastructure and priceless landmarks, have been recognized by individuals and businesses alike as contributing to creating a better society.
Let's see the future price direction of this stock from the RPM technical analysis:

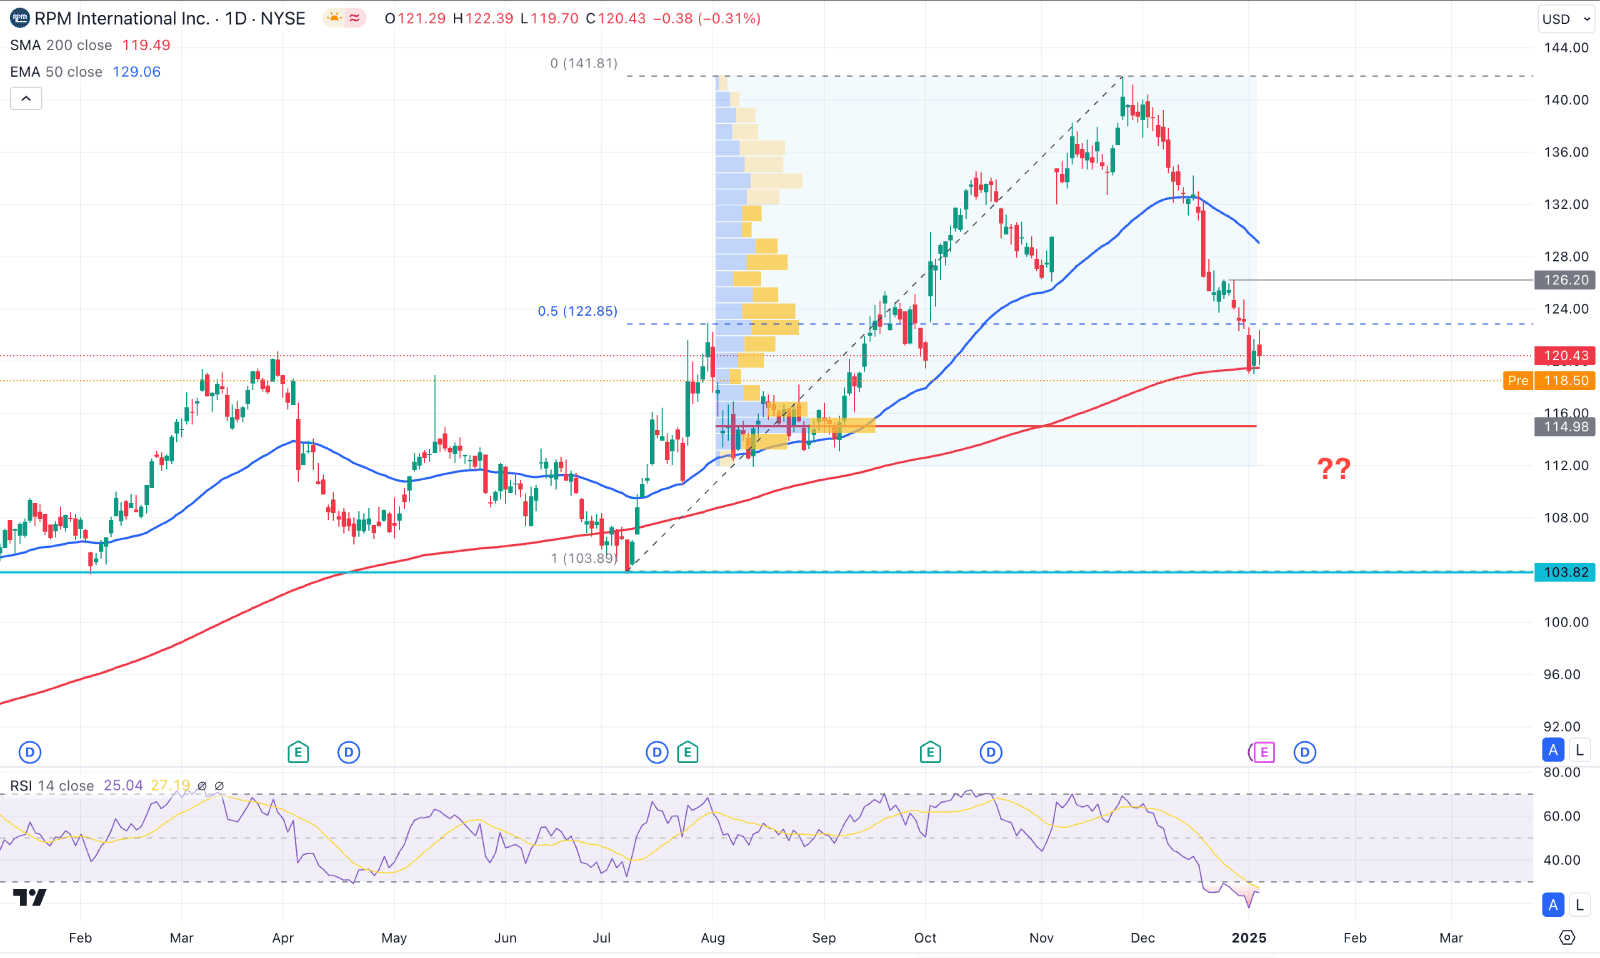
In the daily chart of RPM, the most recent price shows bearish pressure from a crucial top. As a result, the price reached a potential discounted zone from where investors might open a long position with a cheaper price. However, a valid price action is needed before anticipating the current bearish wave, as no sign of buyers' activity is visible.
In the tradable range, the immediate bottom is at the 103.82 level, which will be the lower limit of the current buying possibility. The long-term outlook shows a different story. A bearish monthly candle is visible from the all-time high level. In that case, a potential bearish continuation is also possible from the latest bearish engulfing bar.
In the volume structure, the highest activity level since July 2024 is at the 114.98 level, below the current price. A bullish reversal is possible as long as the price remains above the high volume line.
In the major structure, the most recent selling pressure took the price below the 50-day Exponential Moving Average line, suggesting a medium-term selling pressure in the market. However, the 200-day SMA is still protected and is an immediate support line. In that case, a bearish break below this line could increase the downside possibility, which is primarily shown in the monthly candlestick.
The Relative Strength Index (RSI) reached the oversold zone in the secondary window, signalling the lowest level in a year. Depending on the upcoming price action, a bullish reversal might appear as the oversold zone is reached.
Based on RPM's daily outlook, the ongoing bearish pressure from the all-time high is likely to extend. A bearish daily close below the 200-day SMA line could extend the loss and find support at the 103.82 level.
On the bullish side, a recovery from the current area with a daily candle above the 126.20 level might eliminate the downside possibility and increase the bullish momentum towards the existing all-time high area.

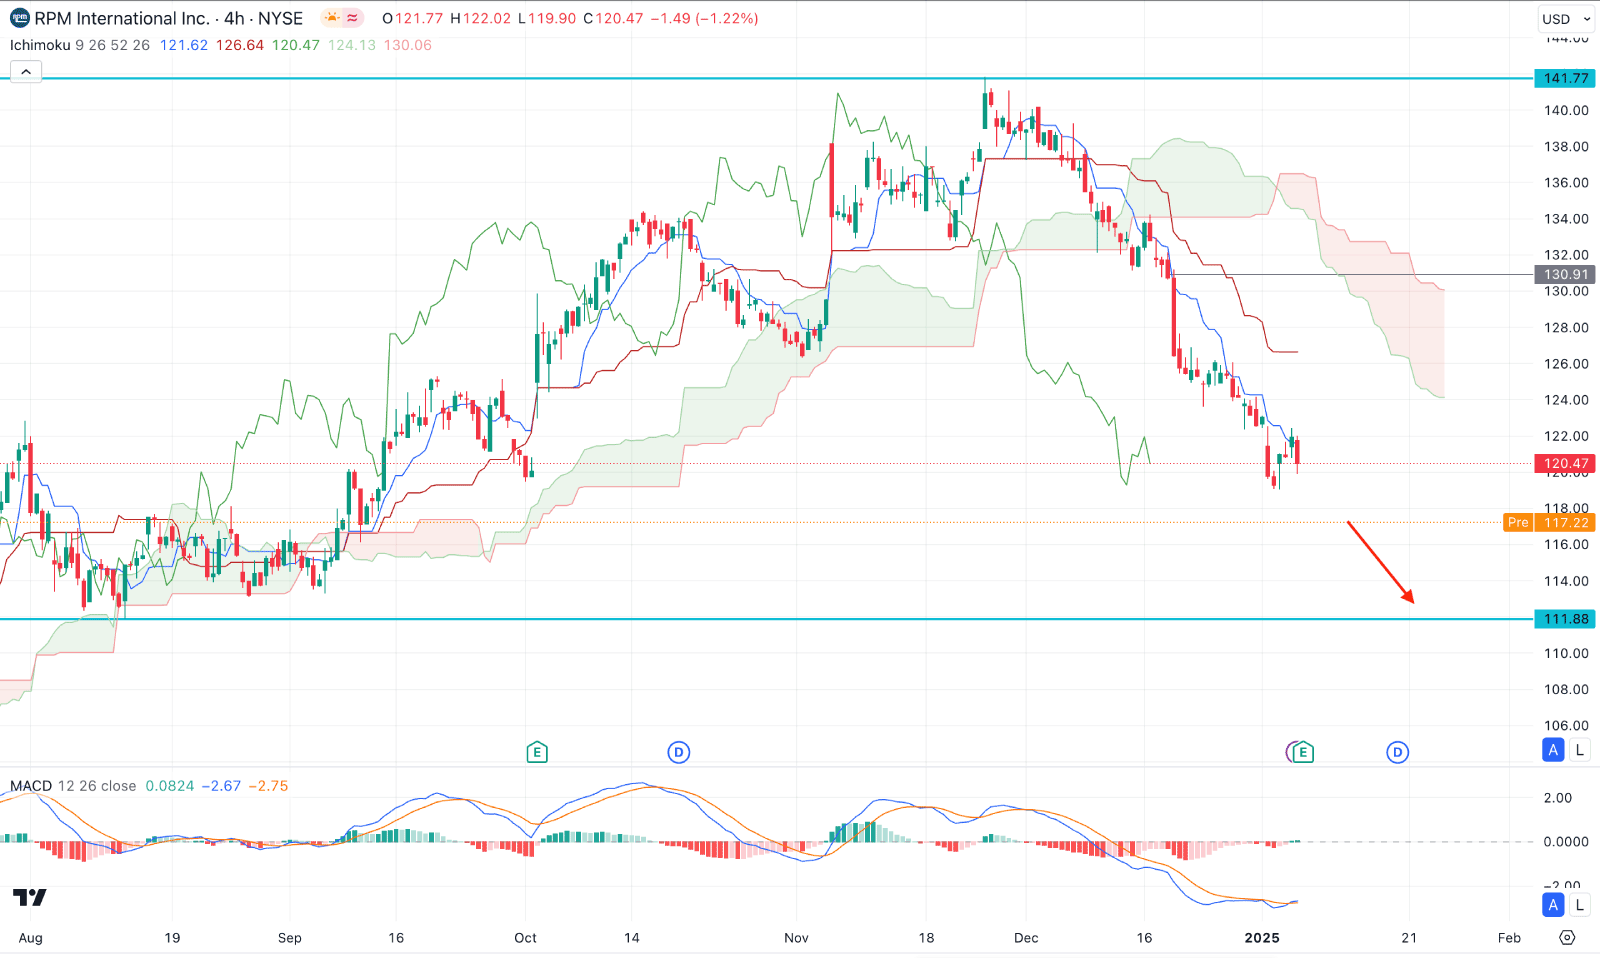
In the H4 timeframe, the recent price shows extensive selling pressure, where the current price hovers below the dynamic Ichimoku Cloud zone. Moreover, the Future Cloud shows a bearish continuation, where the Senkou Span A and B remain downwards.
A different scenario is visible in the indicator window as the MACD Signal line has found a bottom. The current line hovers flat at the record low, which signals a possible bottom formation in the main chart. In that case a flip in the MACD Histogram with a bullish crossover in signal lines could signal a possible upward correction.
On the bullish side, both dynamic lines work as resistance, signalling an ongoing bearish wave. In that case, the price is more likely to aim lower and find support at the 111.88 support level.
On the other hand, a prolonged bullish pressure with an H4 candle above the 130.91 Imbalance high could validate the bullish reversal, aiming for the 140.00 area.

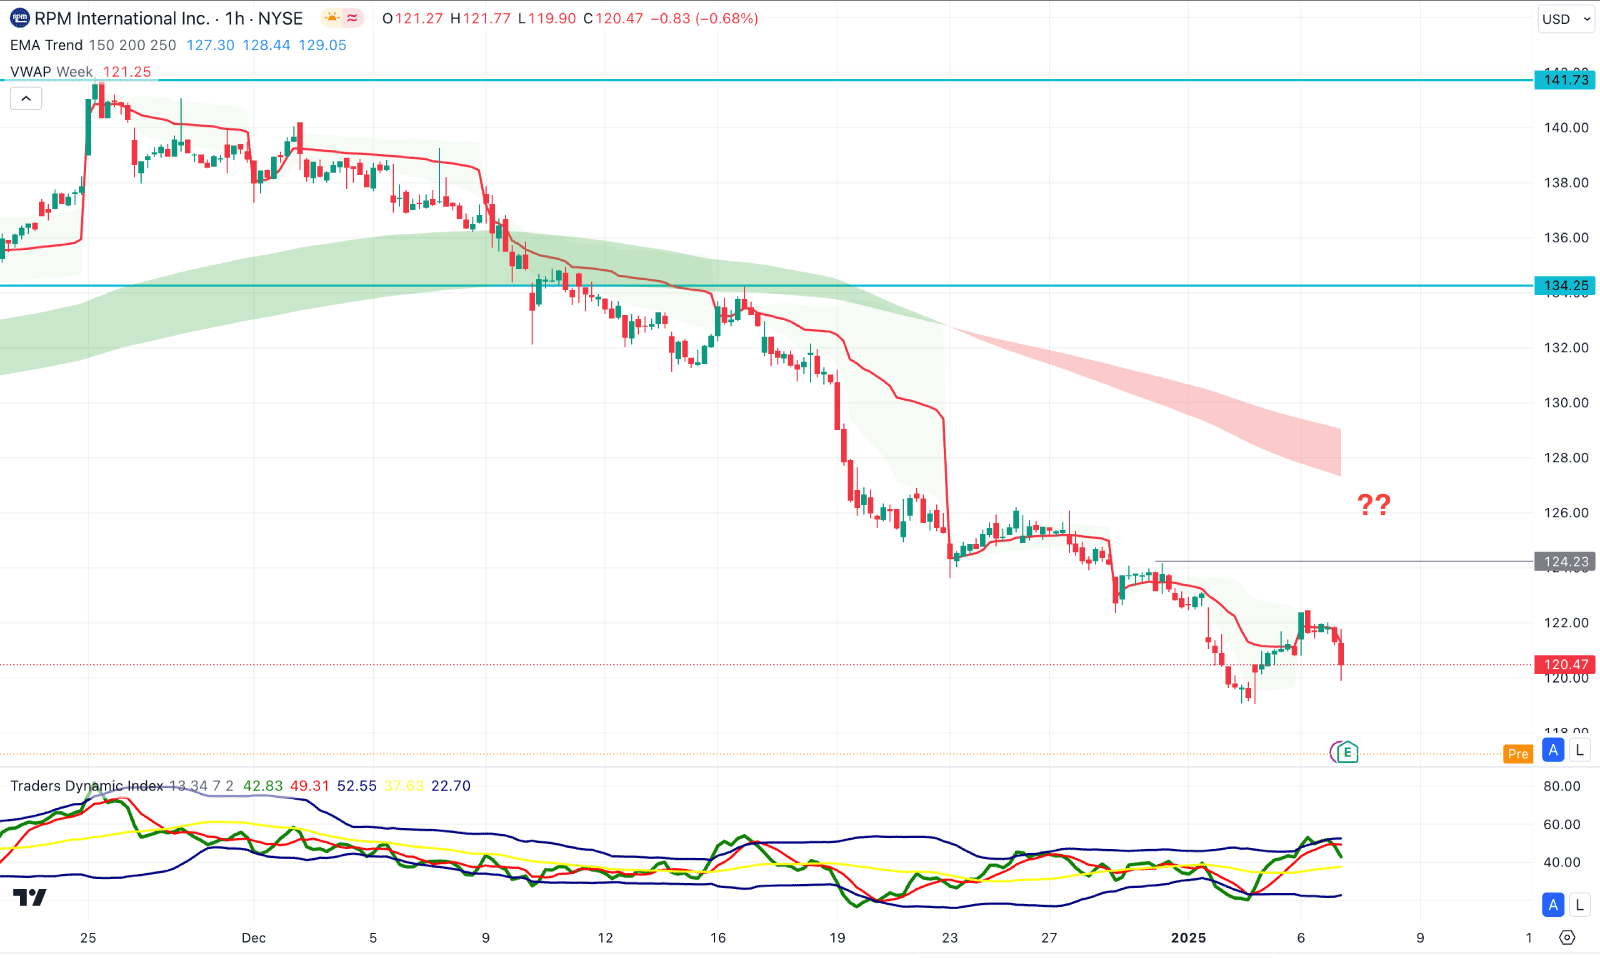
In the hourly time frame, the recent price has an ongoing bearish pressure as a bearish H1 candle is visible below the dynamic weekly VWAP line. Moreover, the Moving Average wave is above the current price, working as a major resistance.
In the indicator window, the Traders Dynamic Index (TDI) has reached the peak and signalled a top formation. In that case, the price has a higher possibility of extending lower and finding support from the near-term level.
On the other hand, the Moving Average wave could work as a crucial barrier to bulls as a bullish price action above this area would be a long opportunity. On the bullish side, overcoming the 124.23 static line could extend the upward pressure above the 134.25 level.
Based on the current market outlook, RPM is having a bearish continuation from the record high level where sufficient downside correction is still pending. In that case, opening a long position needs additional attention. A solid intraday bottom with a bullish reversal in the daily chart could offer a decent long opportunity.