Published: February 18th, 2025
Ronin is the only blockchain to scale a single game to accommodate millions of daily active users. It was developed by Sky Mavis, the team behind the wildly popular Web3 game Axie Infinity, which has brought in over $1.3 billion in revenue.
It has handled more than $4 billion in NFT transactions. Ronin is the best option for Web3 games because of its emphasis on almost instantaneous transactions and low costs. It allows millions of in-game transactions to be completed without any problems.
Over 2 million wallet downloads, $5 billion in total value locked (TVL), 250,000 unique daily active addresses, and 15% of all NFT transactions in the market have all occurred on Ronin in its first nine months of operation.
Let's see the future price direction of this coin from the RONIN/USDT technical analysis:
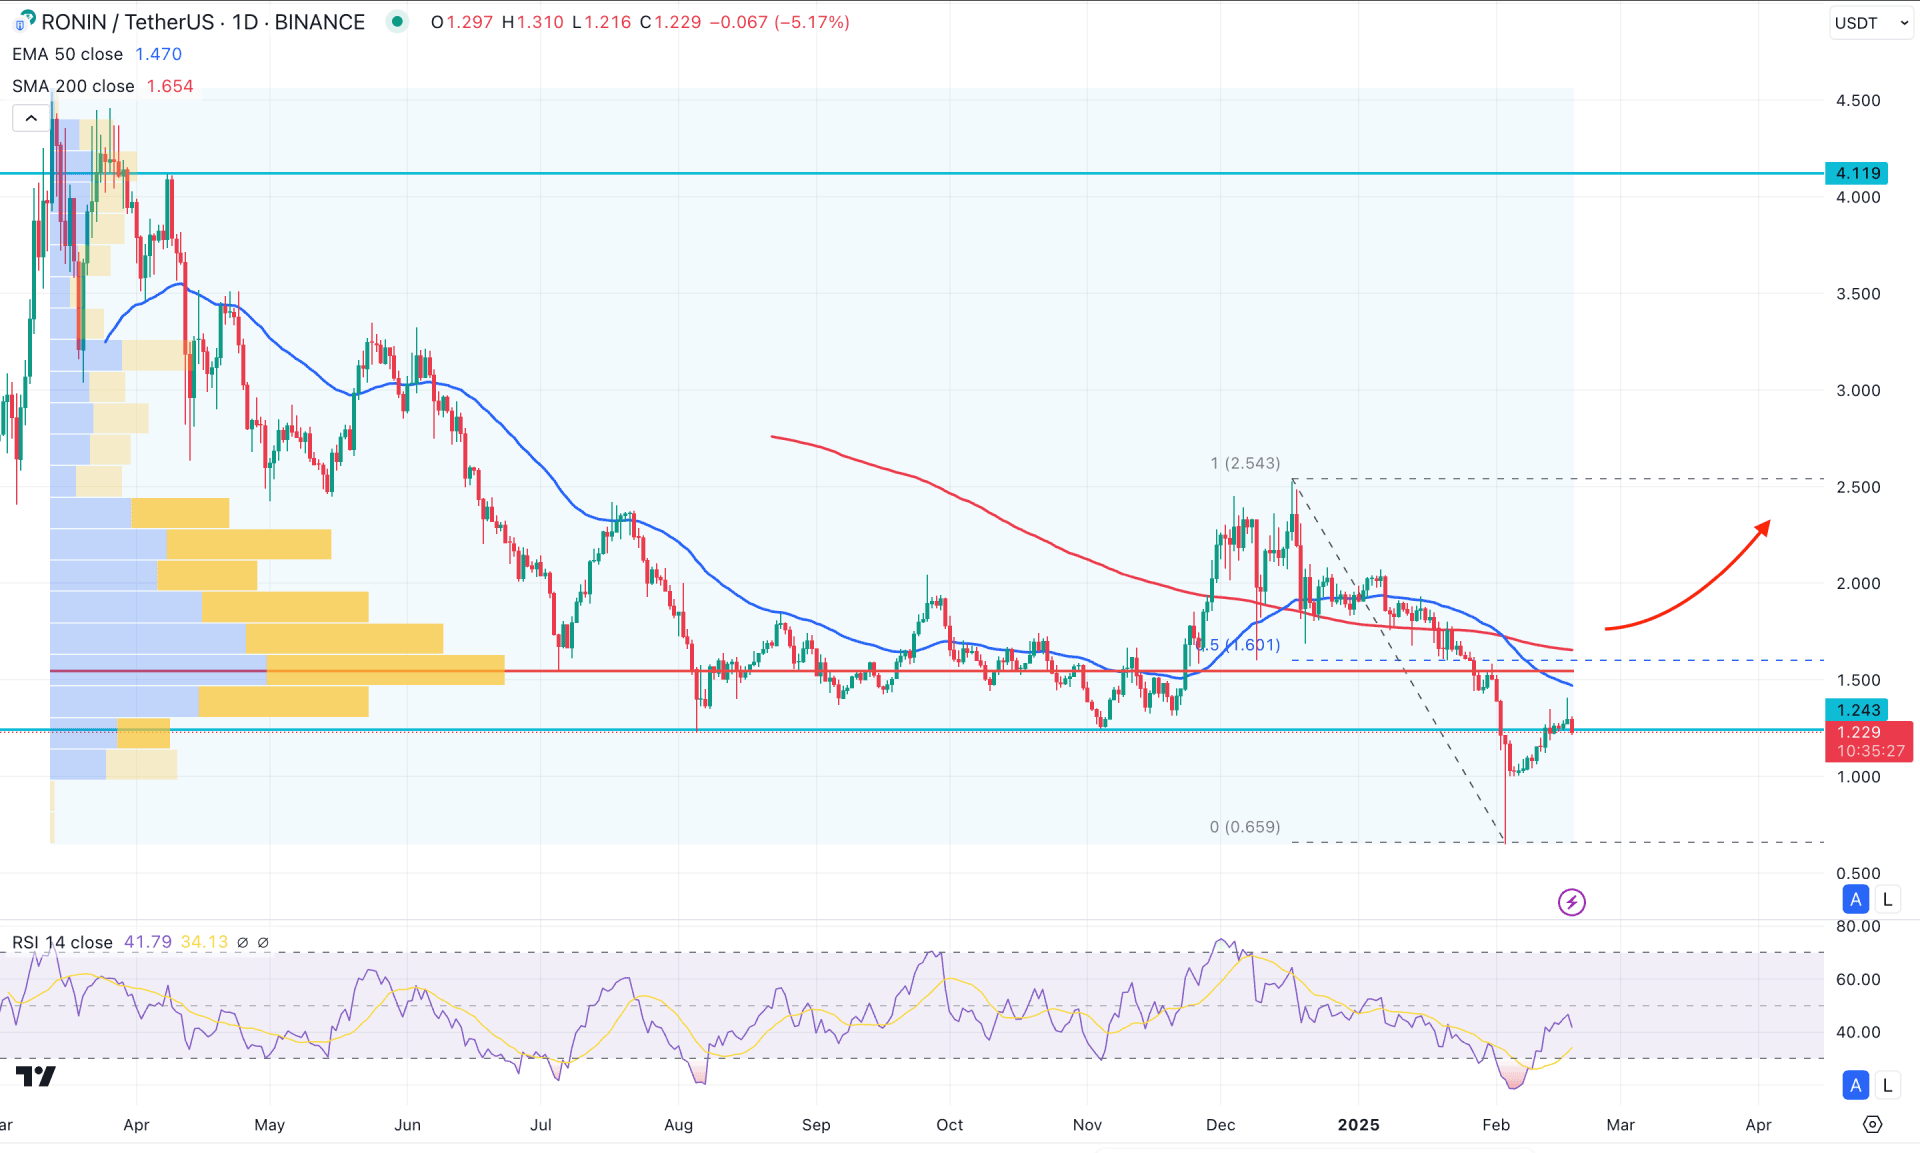
An extended selling pressure is seen in the daily chart of RONIN/USDT, taking the price below the existing all-time low. Also, the daily candlestick pattern shows exhaustion at the bottom, suggesting sellers' wipeout from the market. However, a valid bullish rebound is needed from the discounted area before anticipating a long movement.
In the monthly timeframe, the bullish close in November 2024 failed to hold the momentum, and the price was seen for consecutive bearish months. As a result, the most latest monthly candle is hovering below the November low, suggesting sellers' dominance in the price.
In the volume structure, bears are still in control as the current high volume line is above the near-term swing high. Primarily, as long as the high volume line remains above the current price, investors might expect the selling pressure to extend.
The major market trend remains bearish from dynamic lines in the main price chart. The 50 day Exponential Moving Average has crossed below the 200 day Simple Moving Average, suggesting a Death Cross formation. In that case, the primary aim for this pair is to seek short opportunities, from the 50 day EMA line.
In the indicator window, the Relative Strength Index (RSI) reached the oversold zone and formed a rebound. However, the recent line failed to recover above the 50.00 line, limiting the bullish opportunity.
Based on the daily market outlook, RONIN/USDT bulls must be skeptical before opening a long position. The conservative long approach is to wait for a daily candle above the 1.547 high volume line, aiming for the 2.600 level.
On the other hand, the ongoing bearish trend might extend, where a bearish reversal from the 50 day EMA could be a Death Cross continuation opportunity.
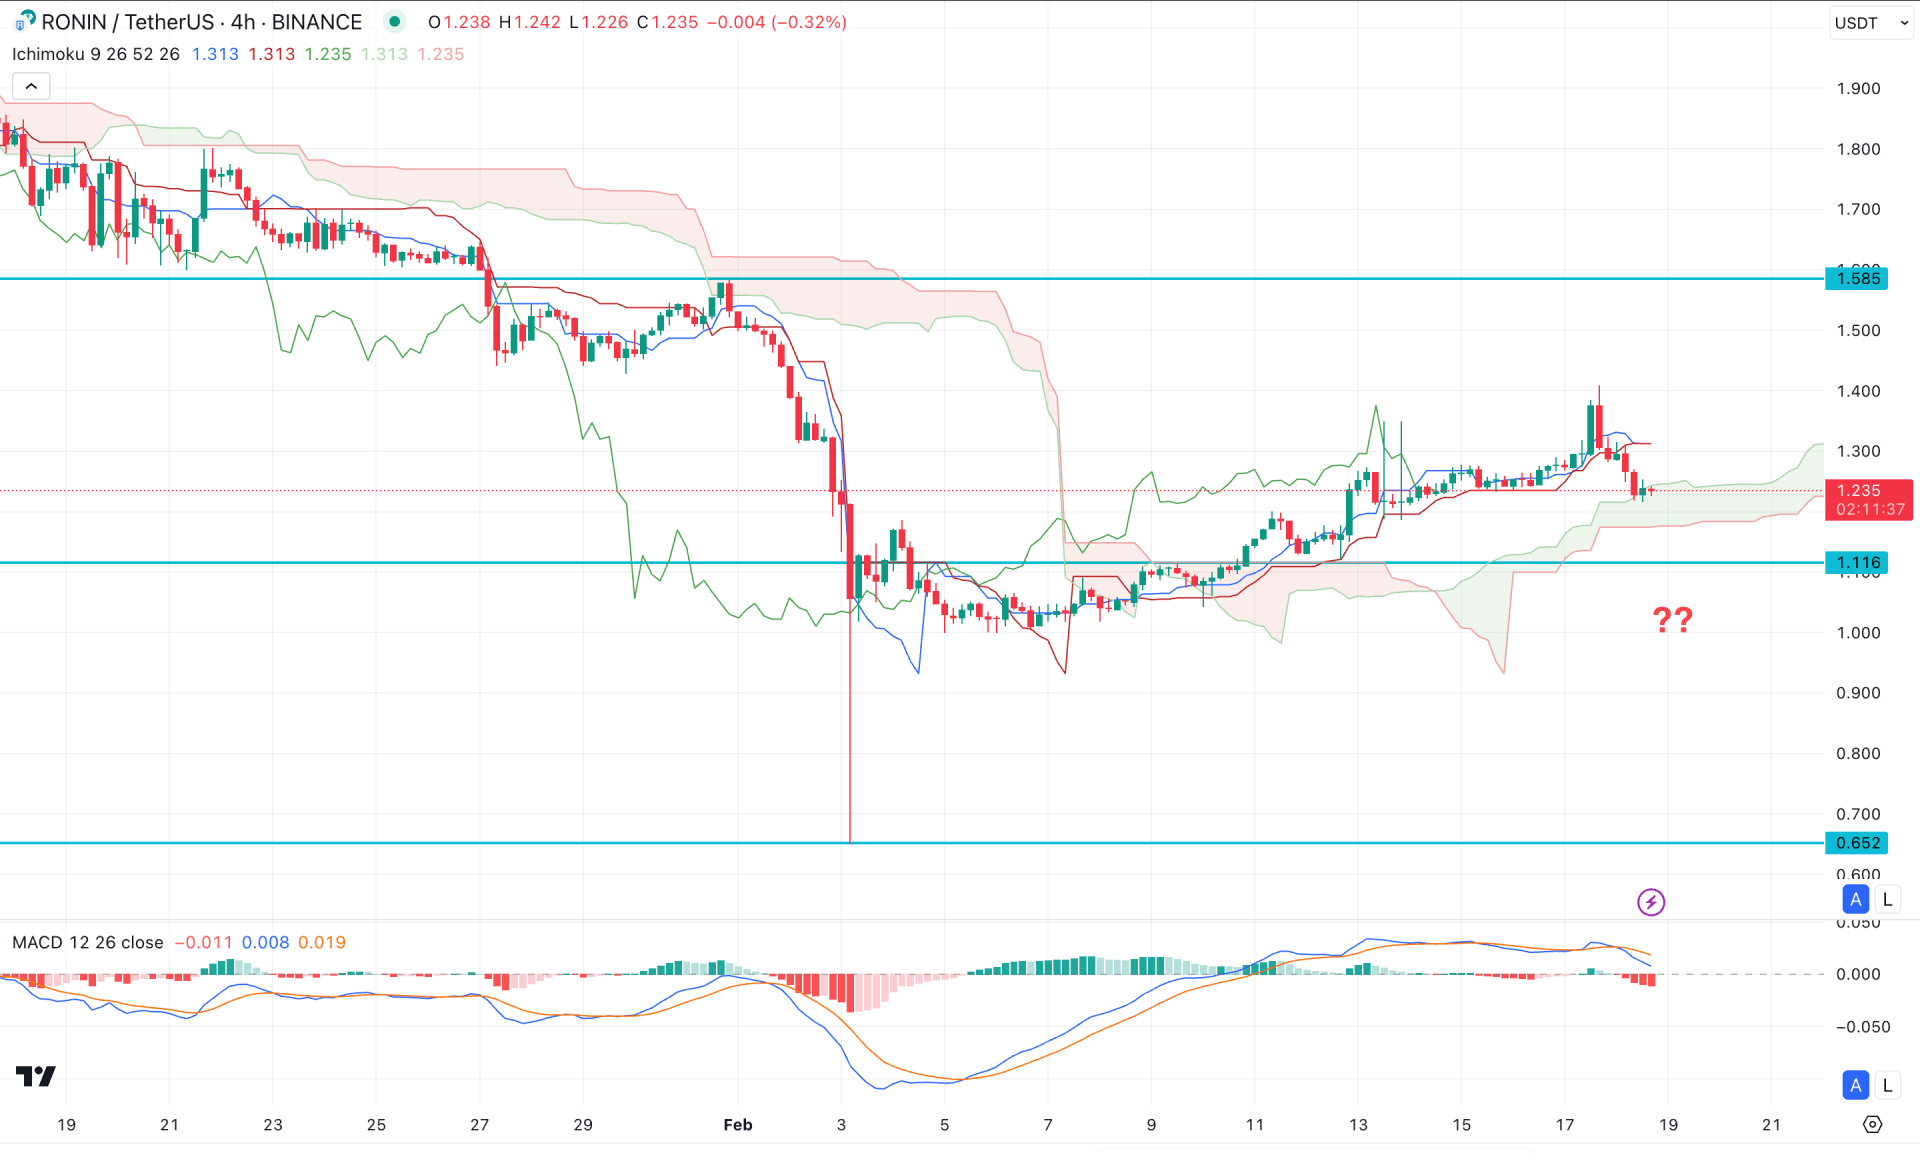
In the H4 timeframe, the recent price is trading above the Ichimoku Cloud level after forming exhaustion at an all-time low. Primarily, a bullish continuation is possible if the price can make a new intraday swing high from the Cloud support area.
In the Ichimoku Cloud indicator, the Future Cloud looks positive to bulls, where the Senkou Span A and Senkou Span B aimed higher with a bullish slope.
In the indicator window, the MACD Histogram aimed lower and formed three consecutive red lines from the neutral point. Moreover, the MACD Signal line remained sideways at the top, suggesting an intraday top formation.
Based on the H4 outlook, any immediate bearish recovery with an H4 close below the 1.116 support level could be a high probable short opportunity, aiming for the 0.700 level.
On the other hand, the current price is facing support from the Cloud area, where a bullish rebound above the Kijun Sen might extend the momentum above the 1.500 level.
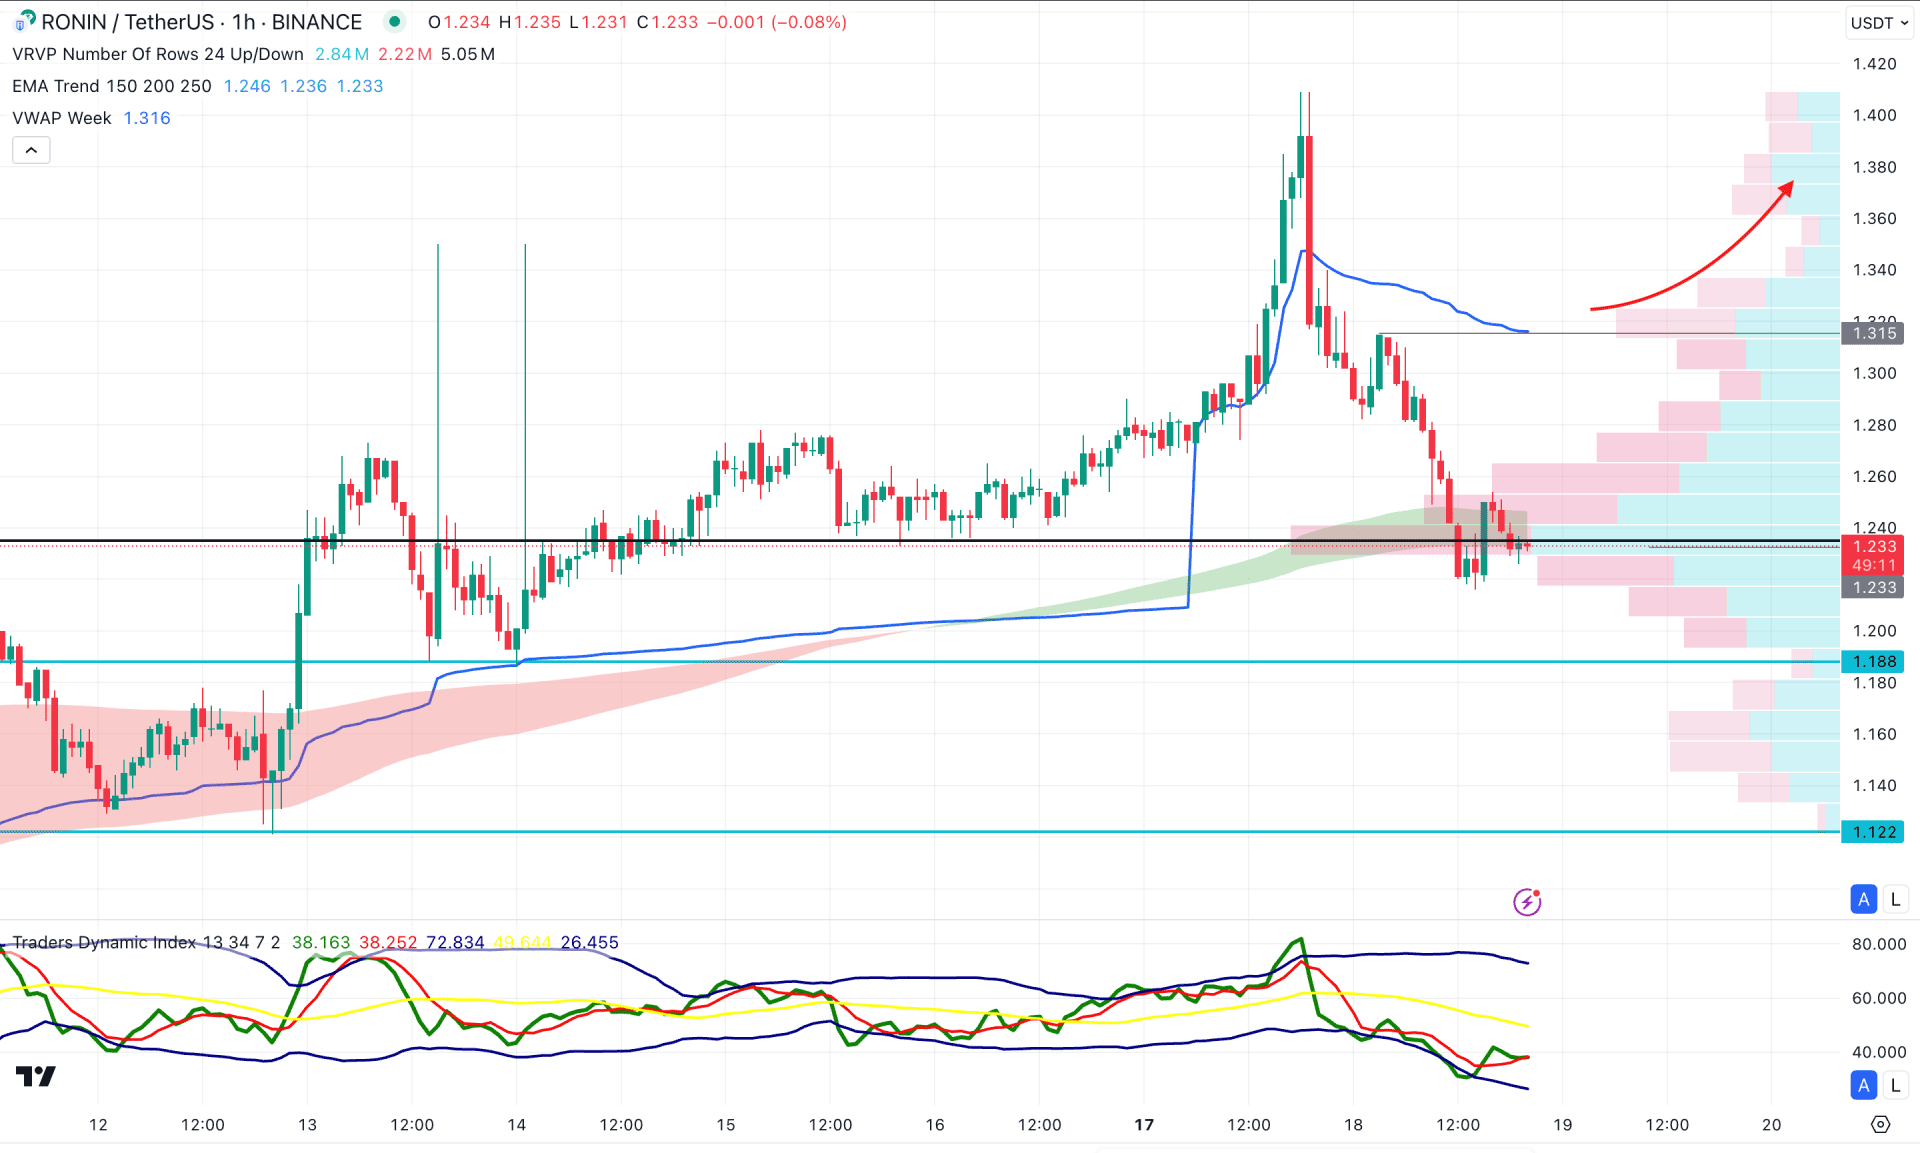
The ongoing market momentum in the H1 timeframe is bearish. However, the latest selling pressure from the 1.41 swing high showed counter-bearish momentum towards the visible range high volume line.
Moreover, the weekly VWAP is above the current price, signaling a bearish pressure, while the Moving Average wave aligns with the price.
In the indicator window, the Traders Dynamic Index (TDI) reached the lower band area and formed a bullish reversal. This is a sign of extreme bearish pressure, from which a rebound awaits confirmation.
Based on this outlook, a bullish continuation with an hourly candle above the 1.315 level could offer a bullish continuation opportunity aiming for the 1.500 level.
Based on the current market structure, RONIN/USDT is more likely to extend higher once a bullish rebound is confirmed from the candlestick pattern. The major barrier to look at is primarily the 50-day EMA. A valid bullish rebound above this line could increase the bullish opportunity, aiming for the 2024 high level.


