
Published: November 14th, 2023
Rocket Pool, an Ethereum staking service, has disclosed its plans to establish Protocol DAO (pDAO), a decentralized autonomous organization (DAO) governed by RPL. pDAO will function exclusively on the blockchain, obviating the necessity for third-party applications like snapshot voting instead of conventional DAOs.
The primary objective of the Protocol DAO is to grant community members the power to amend Rocket Pool protocol configurations, distribute treasury funds for initiatives, and address potential protocol complications in a timely manner. In the wake of this declaration, the price of RPL surged by 25%, attaining a peak of $34—a level not observed since July 2023.
The forthcoming Houston enhancement is another forthcoming Rocket Protocol project modification. Furthermore, developers are investigating the feasibility of decreasing the prerequisite for establishing a Rocket Pool mini pool from 8 to 4 ETH.
The weekly and monthly price suggests extensive buying pressure in RPL/USDT, but investors need closer attention to the price action before investing in this project.
Let’s see the upcoming price direction of RPL from the RPL/USDT technical analysis:
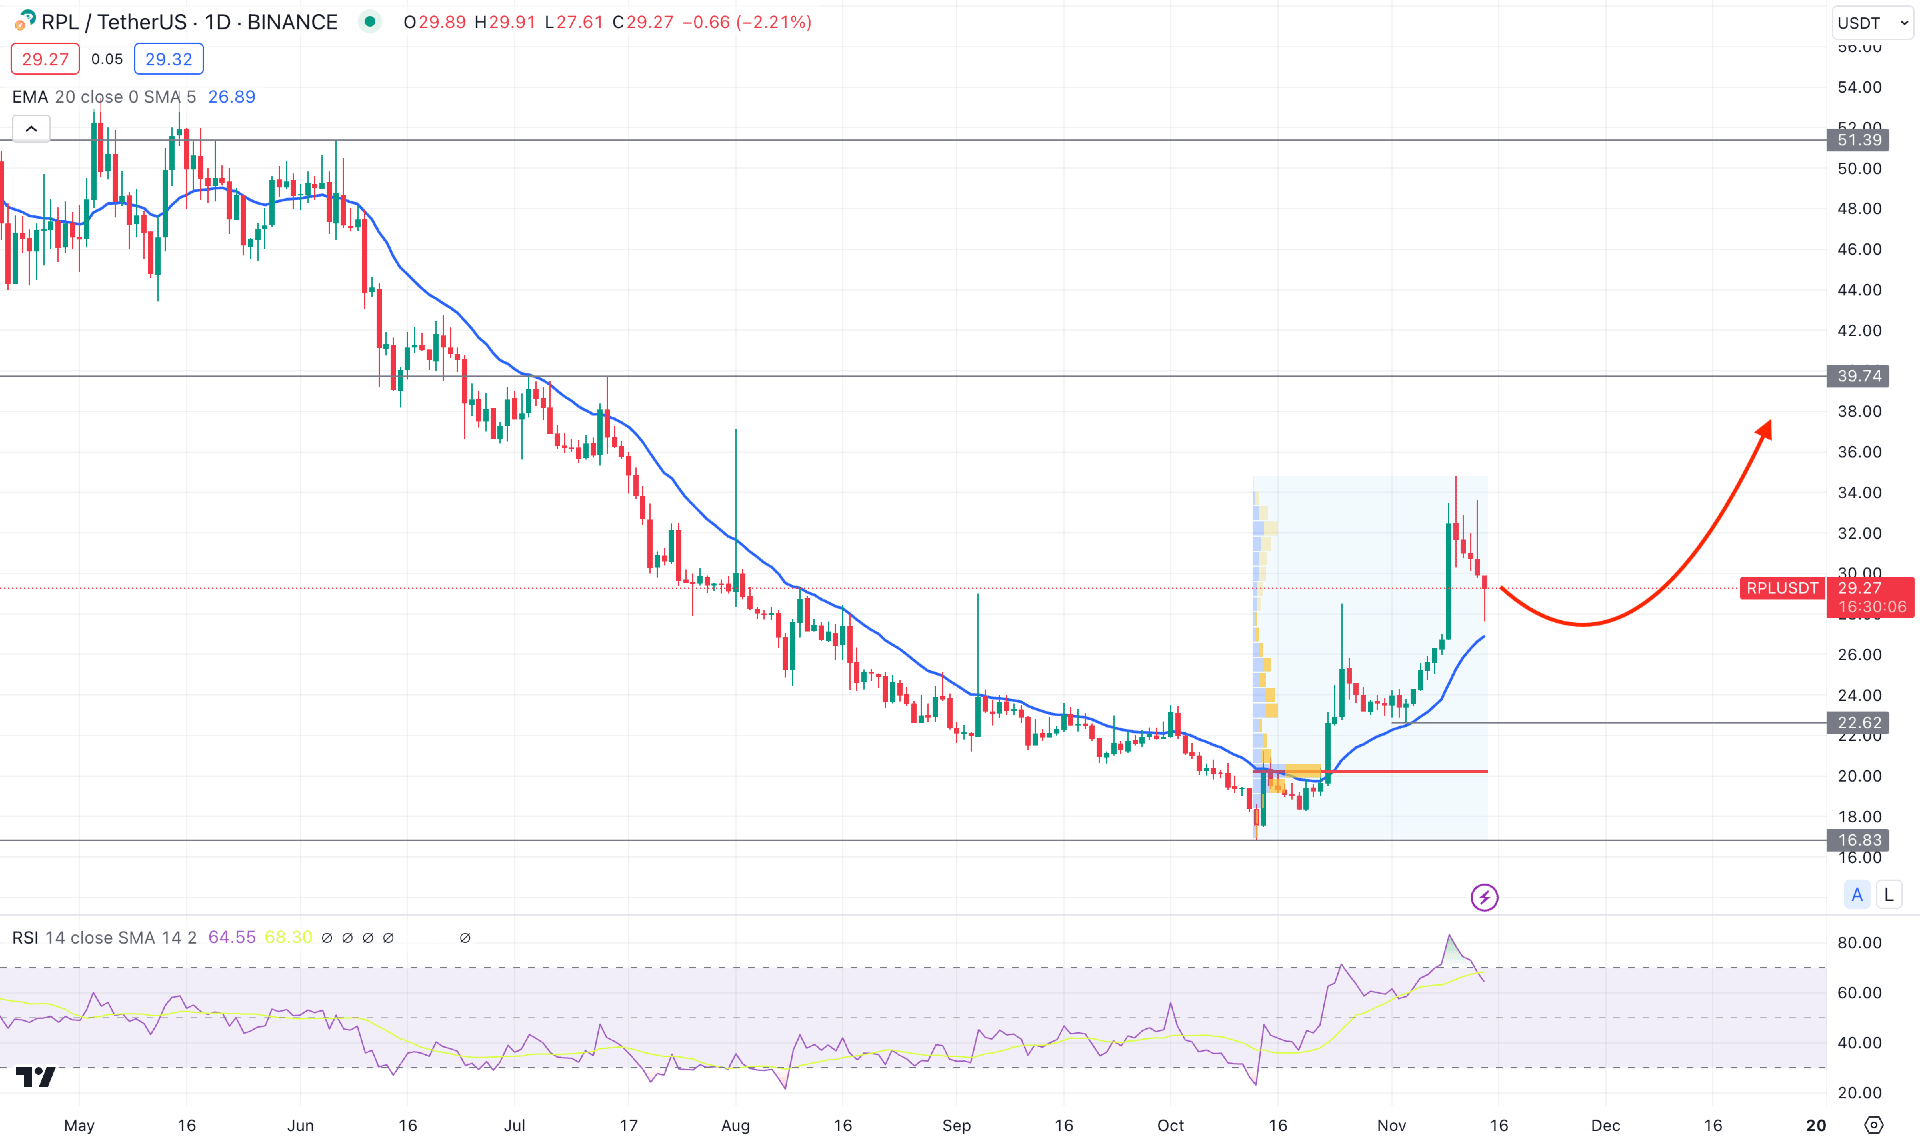
In the daily chart of RPL/USDT, the recent price shows extensive buying pressure from the bottom, which is a primary reason for relying on an upward trend extension.
In the higher timeframe, the price of RPL became corrective after three consecutive bullish weekly candles. As a result, a bullish monthly candle has come with a stable market above the last three month’s average price.
In the volume structure, a strong trading volume since 13 October is marked at 20.23 level, which is below the current price. As the recent price shows sellers' interest above the 20.23 level, we may expect bulls to make a new high in the coming days.
In the daily chart, the extensive loss from May 2023 came limited after reaching the 16.83 bottom. The price made two consecutive higher highs from this bottom, which is a strong sign of a bullish trend formation. Moreover, the current price trades at the discounted zone of this long bearish swing, which could offer a bullish opportunity with better risk and reward.
In the current price, the dynamic 20-day EMA is acting as a strong support as the recent price trades above this level. Moreover, the Relative Strength Index (RSI) reached the 70.00 overbought zone, which could work as a short-term bearish signal.
Based on the daily market outlook of RPL/USDT, bulls need to eliminate some gain before forming a new high in the existing swing. In that case, a downside pressure and a bullish rejection candlestick from the dynamic 20 EMA level could be valid long signals targeting the 39.74 and 51.39 levels.
On the other hand, a deeper correction with a valid break below the 20.23 high volume level would indicate a consolidation. In that case, a bearish daily candle below the 16.83 level could lower the price towards the 10.00 level in the coming days.
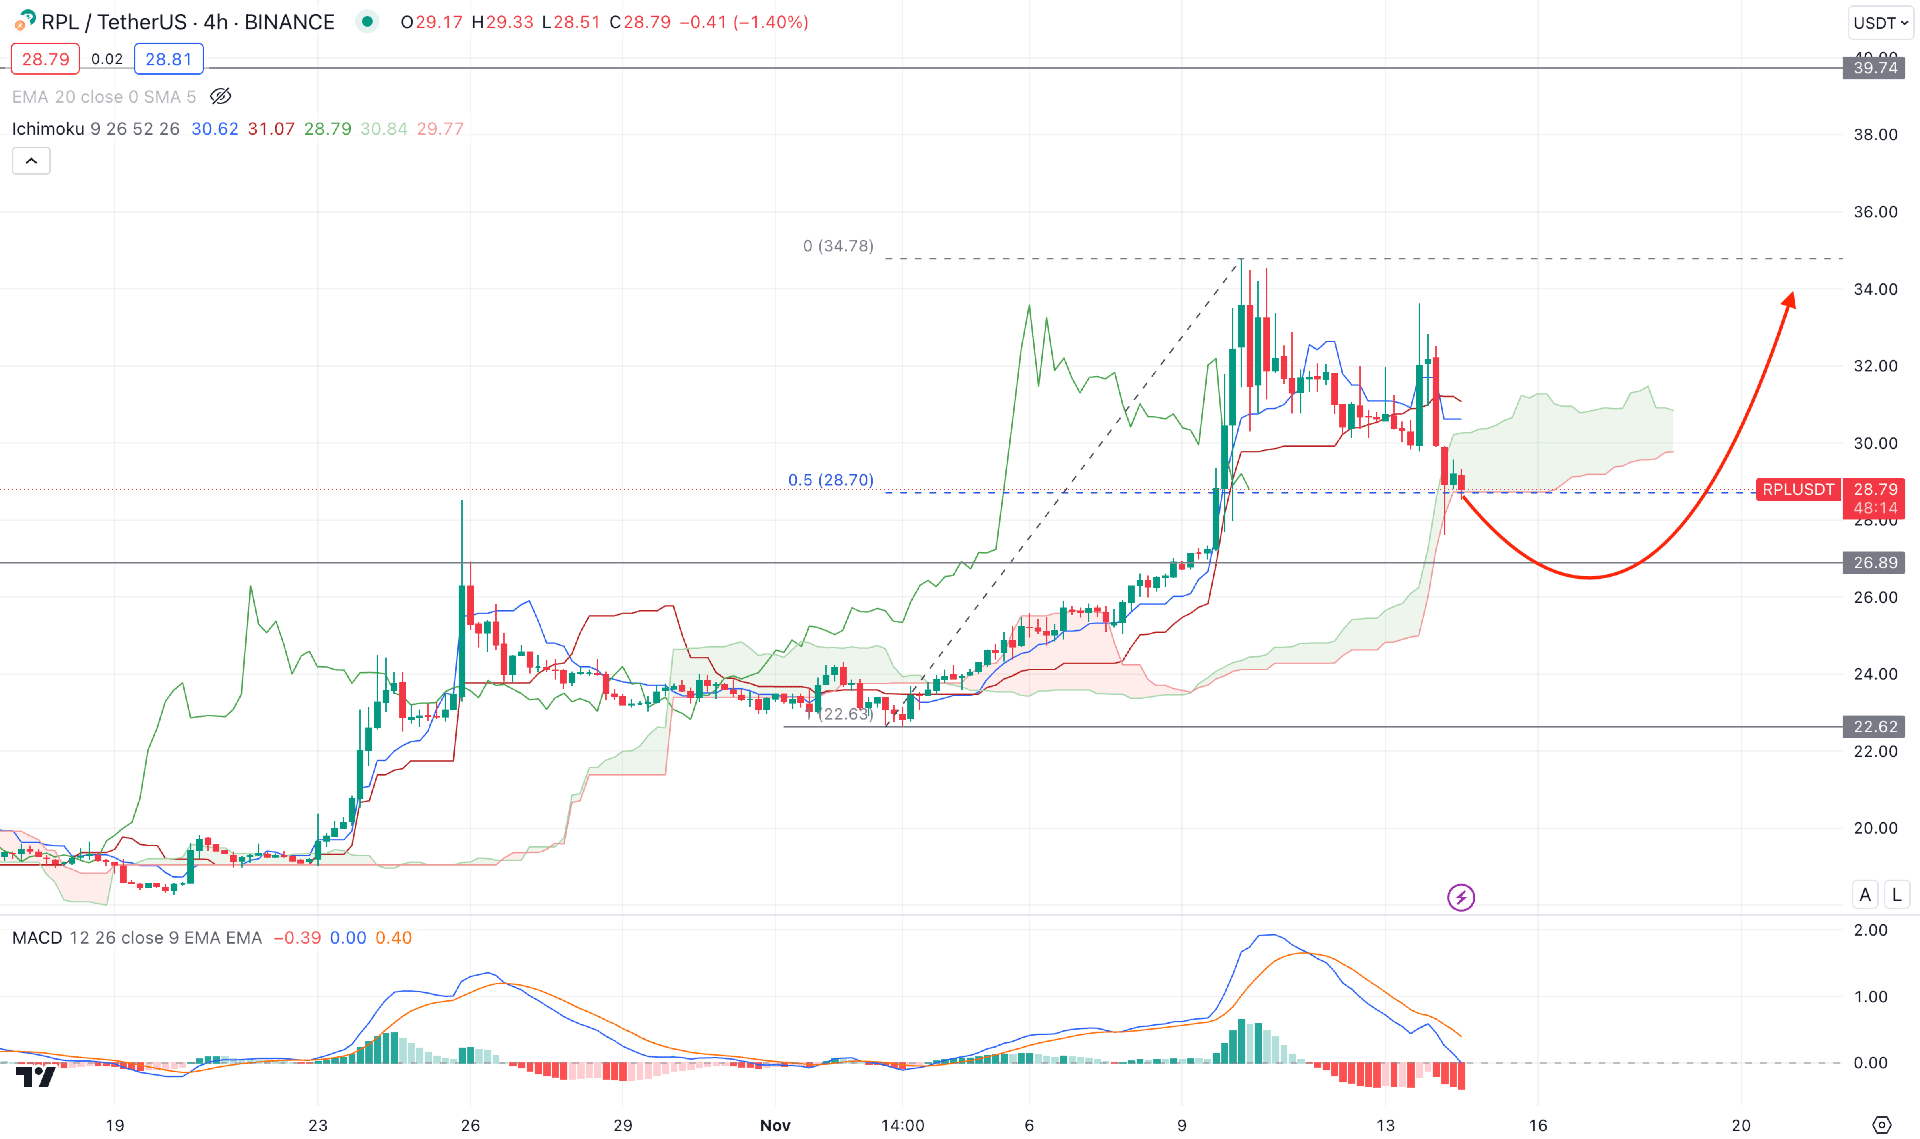
In the H4 timeframe, the broader market context is bullish as the recent price trades are in an impulsive trend. Moreover, the future cloud continues a bullish trend as Senkou Span A and Senkou Span B remains upward. In this context, a bullish trend continuation is possible, but investors need to monitor recent swings to find a better price.
In the secondary window, the MACD Histogram is bearish, while MACD signal lines show a downside pressure. It is a sign of bearish pressure in the market, but it is not enough to consider it a bearish trend reversal.
Based on the H4 structure, investors should wait for the price to come at the discounted zone, as marked in the image. Therefore, a valid bullish rejection from the 26.89 to 22.60 area could be a long opportunity, targeting the 39.74 level.
On the other hand, massive selling pressure with a bearish daily candle below the 22.60 level could be a short opportunity, aiming for the 18.00 level.
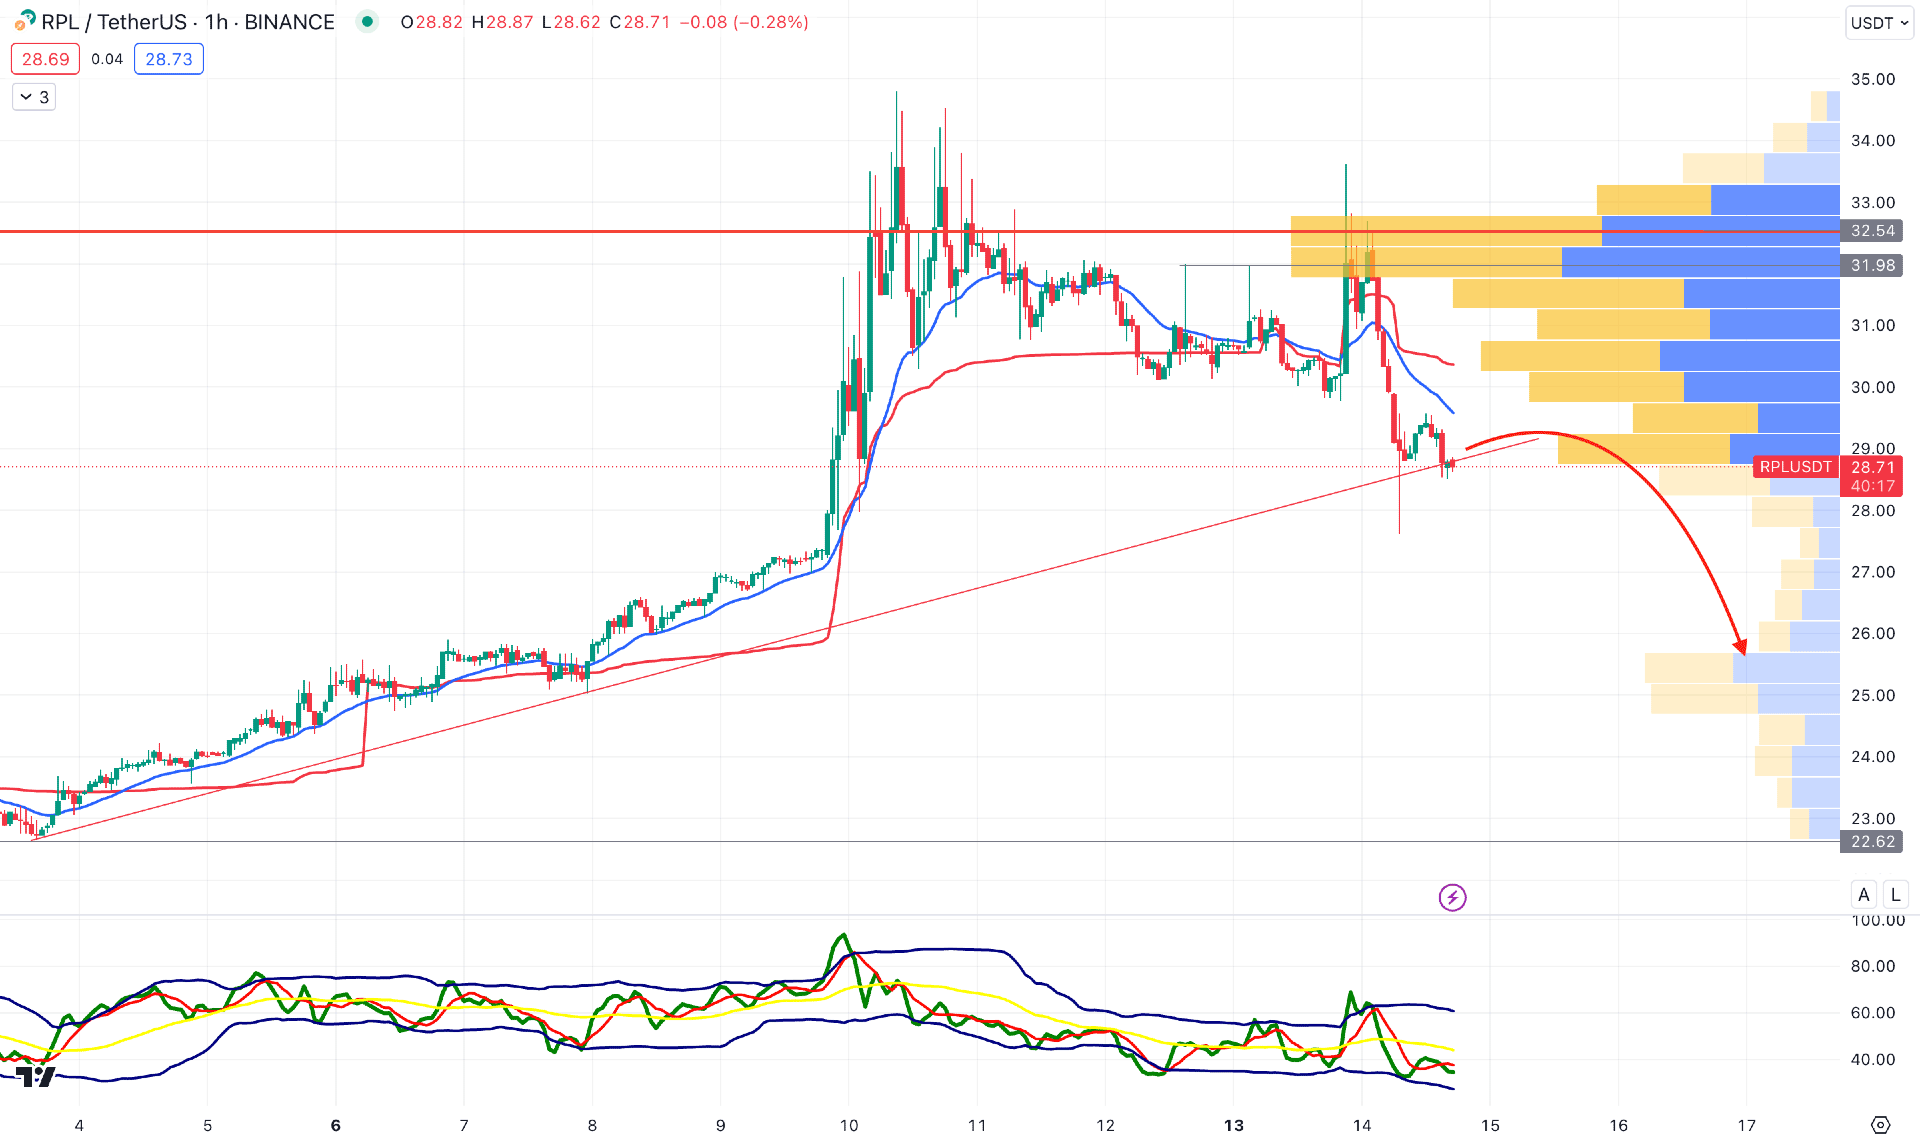
In the hourly chart, the overall market momentum is volatile due to profit taking from the most recent bull run. Therefore, investors should closely monitor how the price trades at the dynamic resistance from where a bearish pressure might come.
In the recent chart, a bullish spike above the 31.98 double top level with an immediate reversal indicates buyers’ rejection, which pushed the price towards the trendline support. Moreover, the Traders Dynamic Index (TDI) suggests a corrective bearish momentum as the current level moves below the 50.00 line.
Based on the H1 structure, a bearish trend continuation is potent, where the main aim is to test the 24.00 psychological area.
On the other hand, additional buying pressure needs a stable price above the 32.54 level, which could open a long opportunity, targeting the 40.00 level.
As per the current price action, RPL/USDT bulls have a higher possibility of extending the current bullish momentum. However, the intraday price suggests a bullish overextension, which could result in a bearish reversal at any time.


