Published: March 5th, 2024
The favorable performance of XRP and apprehensions surrounded the resolution of the SEC v Ripple case. As they deliberate the imposition of punitive penalties for violations of Section 5 of the US Securities Act, both parties are preparing remedy-related briefs.
Ripple was found liable by Judge Analisa Torres in July 2023 for neglecting to register XRP as a security when selling it to institutional investors in the United States. Nevertheless, she concluded that programmatic XRP transactions failed to meet the requirements of the third prong of the Howey Test.
The SEC has lodged complaints against Binance, Coinbase (COIN), Kraken, and additional entities since the July 2023 ruling. In response, Coinbase and Kraken have filed Motions to Dismiss. Coinbase's August 2023 Motion to Dismiss is especially significant for the cryptocurrency market as a decision is imminent.
According to Coinbase, the SEC is devoid of statutory authority to oversee cryptocurrency exchanges. In a favorable ruling, the SEC might be obligated to cease regulation via enforcement actions. In addition, it could potentially lead to settlement discussions with Ripple, thereby ending the SEC's appeal of the decision regarding XRP programmatic sales.
Besides, the broader market context is bullish as the crypto market cap reached its peak, while Bitcoin is trading at the record high.
Let’s see the upcoming price direction of this coin from the XRP/USDT technical analysis
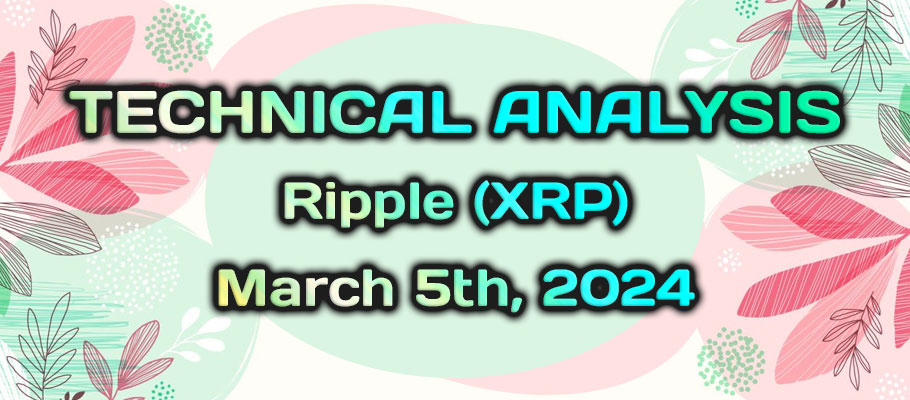
In the daily chart of XRP/USDT, the recent price showed a bullish impulsive pressure supported by the bullish breakout above the 50-day Exponential Moving Average. In this context, the primary aim of this instrument would be to look for long trades until it comes below the dynamic line.
In the higher timeframe, the buying pressure is supported by the bullish Monthly close in February, eliminating most of the January losses. Although February was closed as an inside bar, it is not sufficient to consider a bearish condition.
In the weekly timeframe, a clearer view of the symmetrical triangle breakout is visible, with a weekly close above the trendline resistance.
Regarding the volume structure- the largest activity level since 17 August 2023 is at 0.5113 level, which is below the current price. Therefore, as long as the current price trades above this high volume level, we may expect the buying to continue.
In the daily price action, the most recent buying pressure has come with a new impulsive wave, creating a base at the 0.5254 level. However, the Golden Cross is visible, as the dynamic 50-day EMA crossed above the dynamic 200-day SMA. In that case, any minor downside correction towards the dynamic 50 day EMA could offer a potential bullish continuation signal.
On the other hand, the RSI is bullish above the 70.00 line with no sign of a divergence. In that case, a considerable downside correction with a stable market below the 0.5100 level could be a bearish signal, targeting the 0.4000 level.

In the H4 timeframe, the overall market pressure is bullish as the recent price shows a decent continuation above the Ichimoku Kumo Cloud. Moreover, the future cloud is solid to bulls, as the Senkou Span A is above the Senkou Span B.
In the secondary window, the recent Traders Dynamic Index (TDI) level is corrective at the neutral line, with no sign of a strong trend.
Based on the H4 outlook, any minor downside correction to the dynamic Kijun Sen line could be a potential long opportunity, targeting the 0.8000 area.
On the other hand, bearish exhaustion with a downside pressure below the 0.5795 event level could be a short opportunity, targeting the 0.4852 support level.
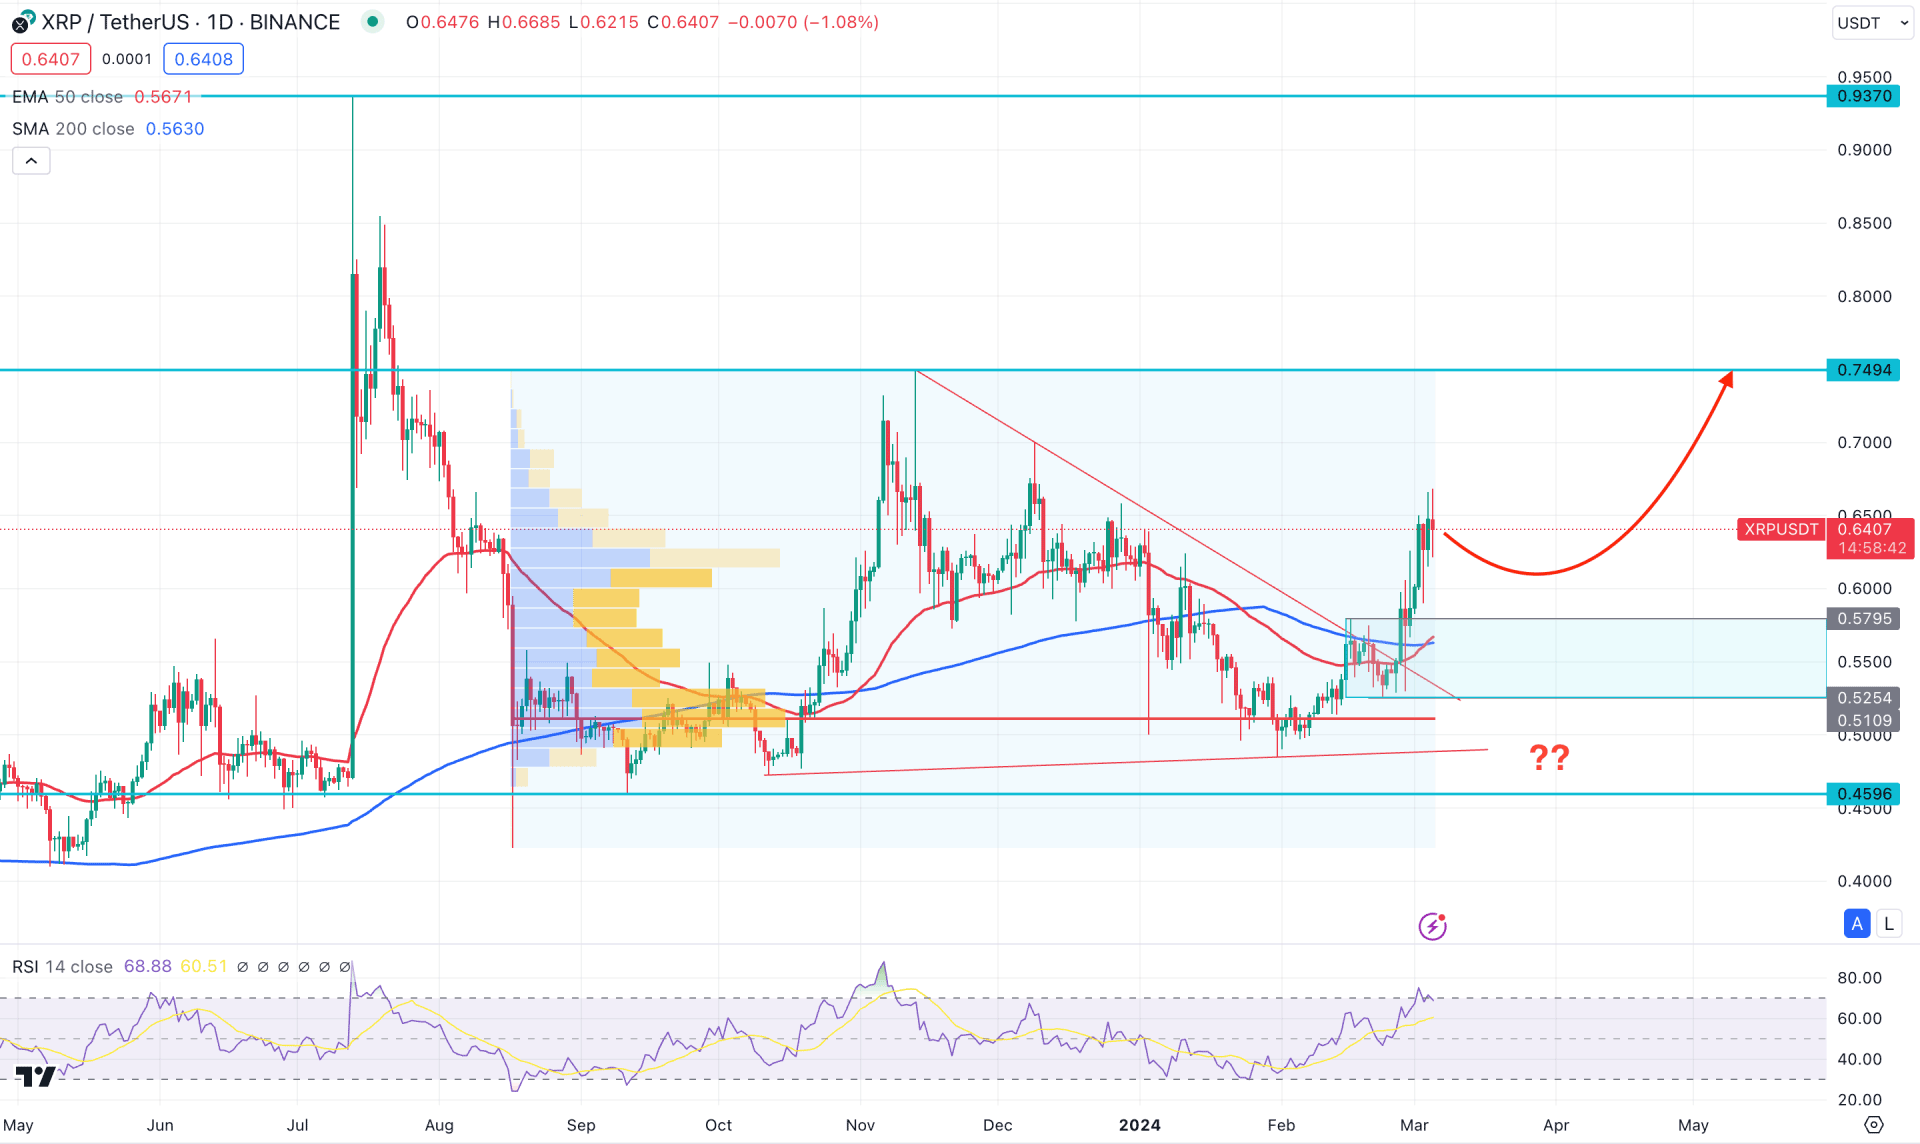
In the H1 chart, the broader market direction is bullish, where a sideways momentum is visible from the MACD Divergence. However, the latest activity level is still protected, with no sign of significant selling pressure at the top.
Based on this outlook, investors should closely monitor how the price trades at the dynamic VWAP level. An immediate bullish pressure with an hourly candle above the 0.6700 level could increase the possibility of reaching the 0.8000 area.
However, a downside correction is possible towards the 0.6217 level before offering another bull run but a counter-impulsive momentum with a daily close below the 0.6000 level might alter the current scenario.
Based on the current multi-timeframe analysis, XRP/USDT is more likely to provide a decent long opportunity from the Golden Cross formation. Investors should closely monitor the intraday price action to find the best price to buy from the low.


