
Published: November 21st, 2023
Consistent institutional capital inflows into XRP funds indicate a positive momentum. Notably, during this active institutional investment period, such whale segments have been redistributing their XRP holdings. Santiment data indicates that billionaires with XRP holdings in the 100,000 to 1,000,000 and 1,000,000 to 10 million segments sold their holdings between November 4 and November 21. Amidst this, retail merchants with XRP tokens in the range of 10 to 100,000 have been amassing the alternative cryptocurrency.
The positive sentiment is further reinforced by the on-chain metric Market Value to Realized Value (MVRV), which represents the average potential profit or loss for investors who have purchased XRP within the previous 30 days.
At the present XRP price, the MVRV ratio (30 days) is -0.97, which indicates that XRP acquired within the previous month would result in a loss for holders. This indicates that traders are less inclined to sell, indicating buyers' market presence.
Let's see the upcoming price direction of Ripple from the XRP/USDT technical analysis:
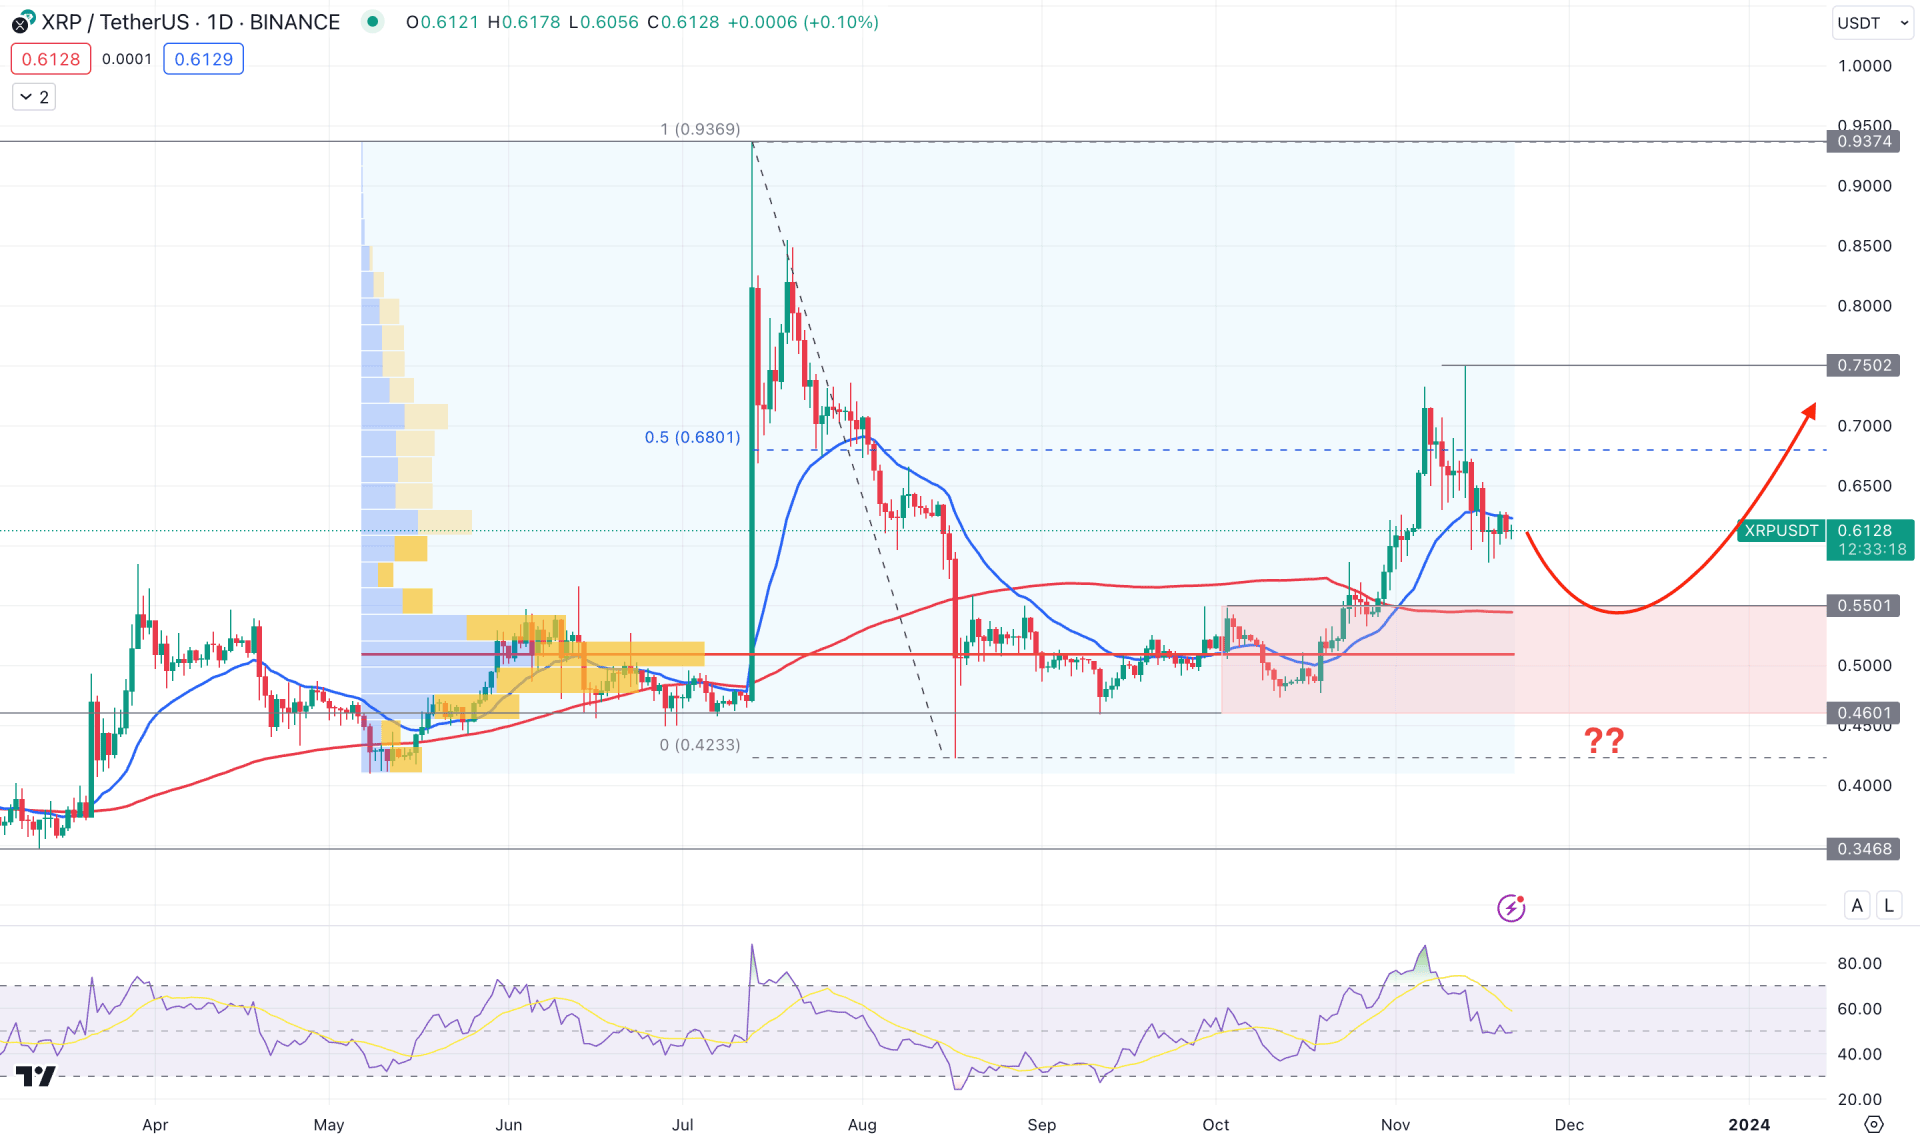
In the daily chart of XRP/USDT, the Pump and dump scheme has failed as the recent price shows a rebound without forming a counter-impulsive pressure at the support areas. In that case, investors should closely monitor the price action at near-term demand zones as a hold and bullish rejection candlestick formation could offer a long opportunity.
The monthly candle holds the buying pressure above the October high for more than 20 days in the higher timeframe. However, the monthly decease period has come, which might hold the existing buying pressure. Moreover, the weekly chart suggests selling pressure as recent candles formed consecutive lower lows. Based on the higher timeframe, the bottom is not formed. Therefore, investors should closely monitor the near-term price action from where a bullish setup might appear.
In the daily chart, the most active level since the 8 May low is below the current price, indicating buyers' presence in the market. Moreover, a stable market is visible above the 100-day Simple Moving Average level, which works as a confluence support to bulls. Moreover, the 20-day Exponential Moving Average is the immediate support from where another buying pressure might come.
Based on the daily market outlook, a valid correction toward the 0.5501 to 0.4600 demand zone is possible, supported by the neutral Relative Strength Index (RSI).
On the bullish side, valid buying pressure from the bottom with a daily candle above the 20 DMA could offer a long opportunity, targeting the 0.9000 psychological level. Moreover, the extensive bearish momentum with a daily close below the 0.4500 level could eliminate the upside possibility and lower the price towards the 0.3468 level.
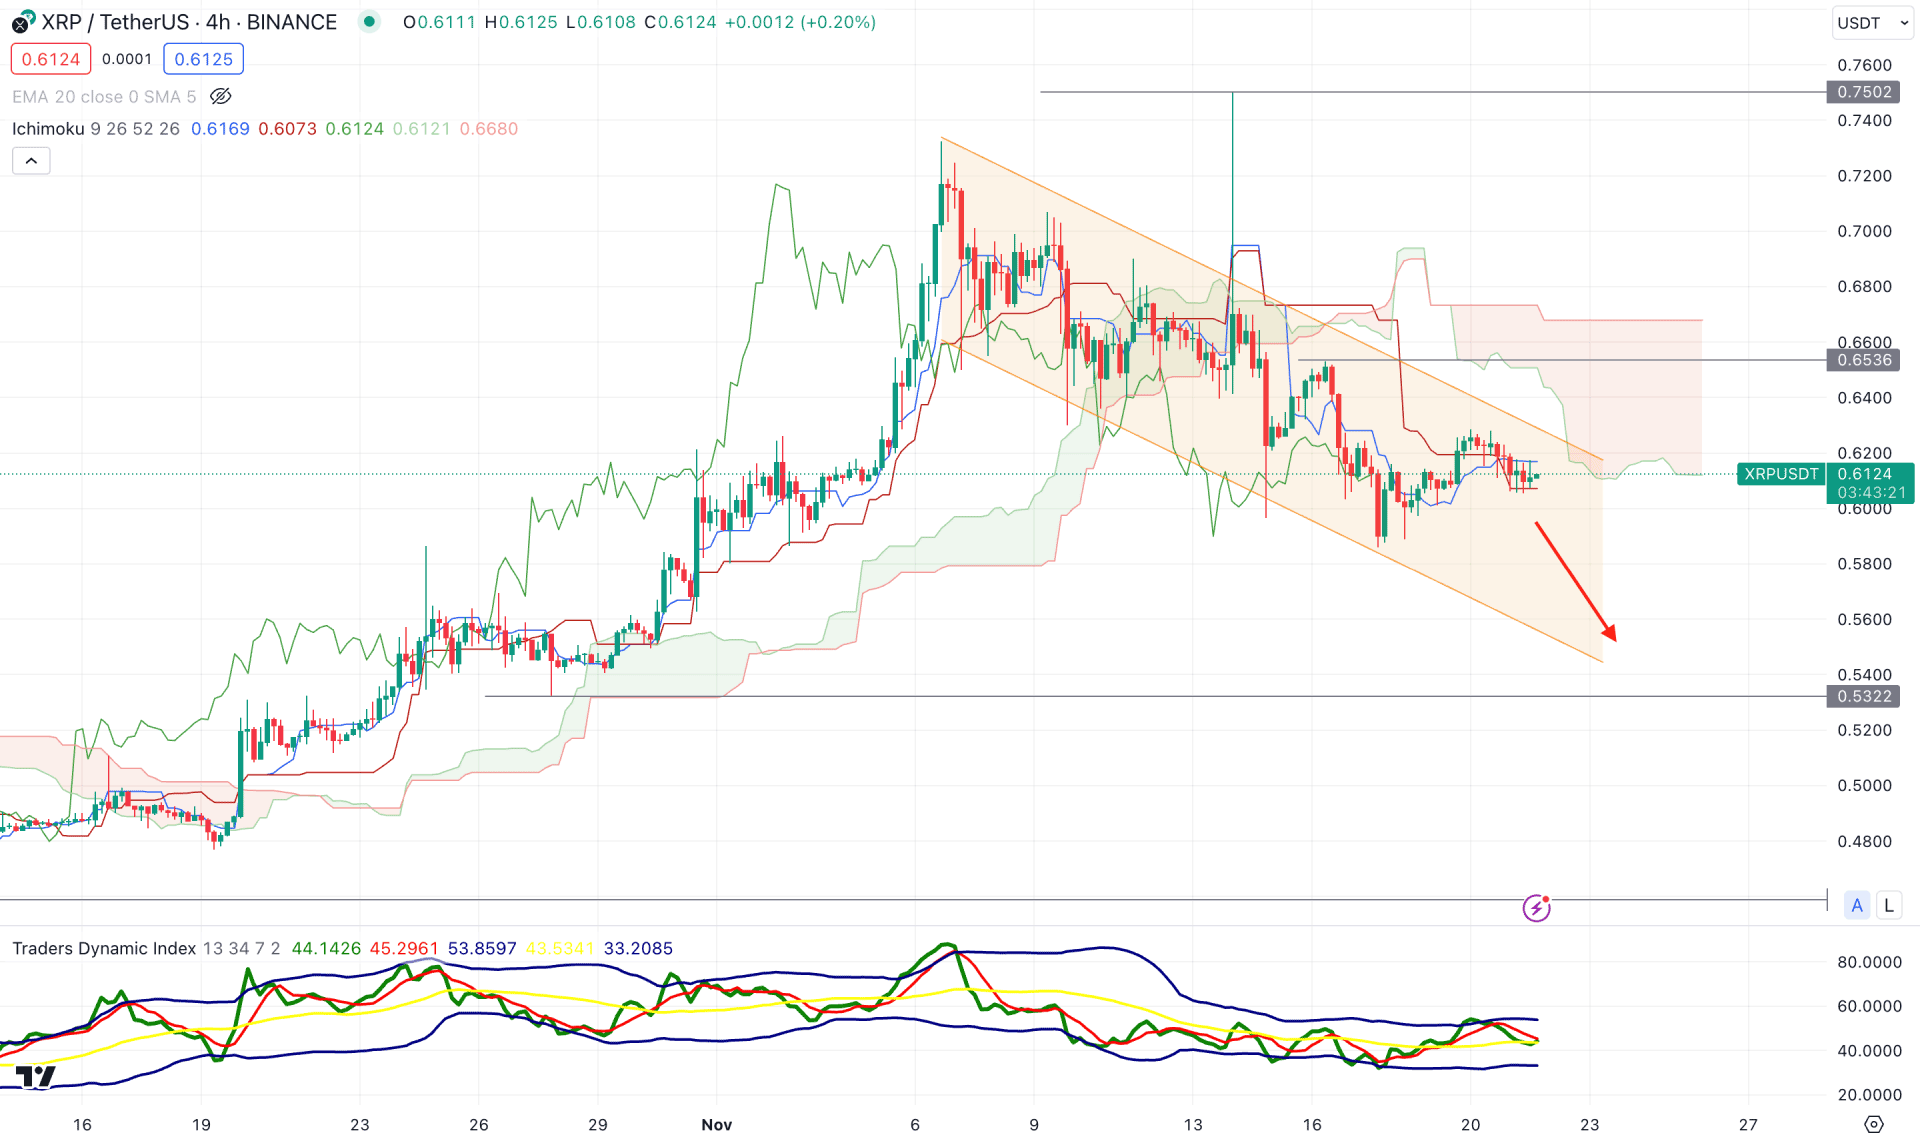
In the H4 timeframe, a stable market is present below the Ichimoku Kumod, which indicates a valid bearish continuation pattern. Moreover, the Future cloud shows a corrective selling pressure as both lines remain flat.
The current TDI level remains below the 50.00 line in the indicator window. Moreover, the dynamic Tenkan Sen and Kijun Sen levels are above the current price, which might be a barrier to bulls.
Based on the H4 outlook of XRP/USDT, an immediate bullish rebound with an H4 candle above the dynamic Kijun Sen could be a long opportunity. Moreover, a bearish extension is possible, offering another bullish opportunity from the 0.5322 to 0.4600 zone.
On the bearish side, a bearish H4 candle below the 0.4500 level could be an alarming sign to bulls, which might work as a bearish opportunity for the coming days.
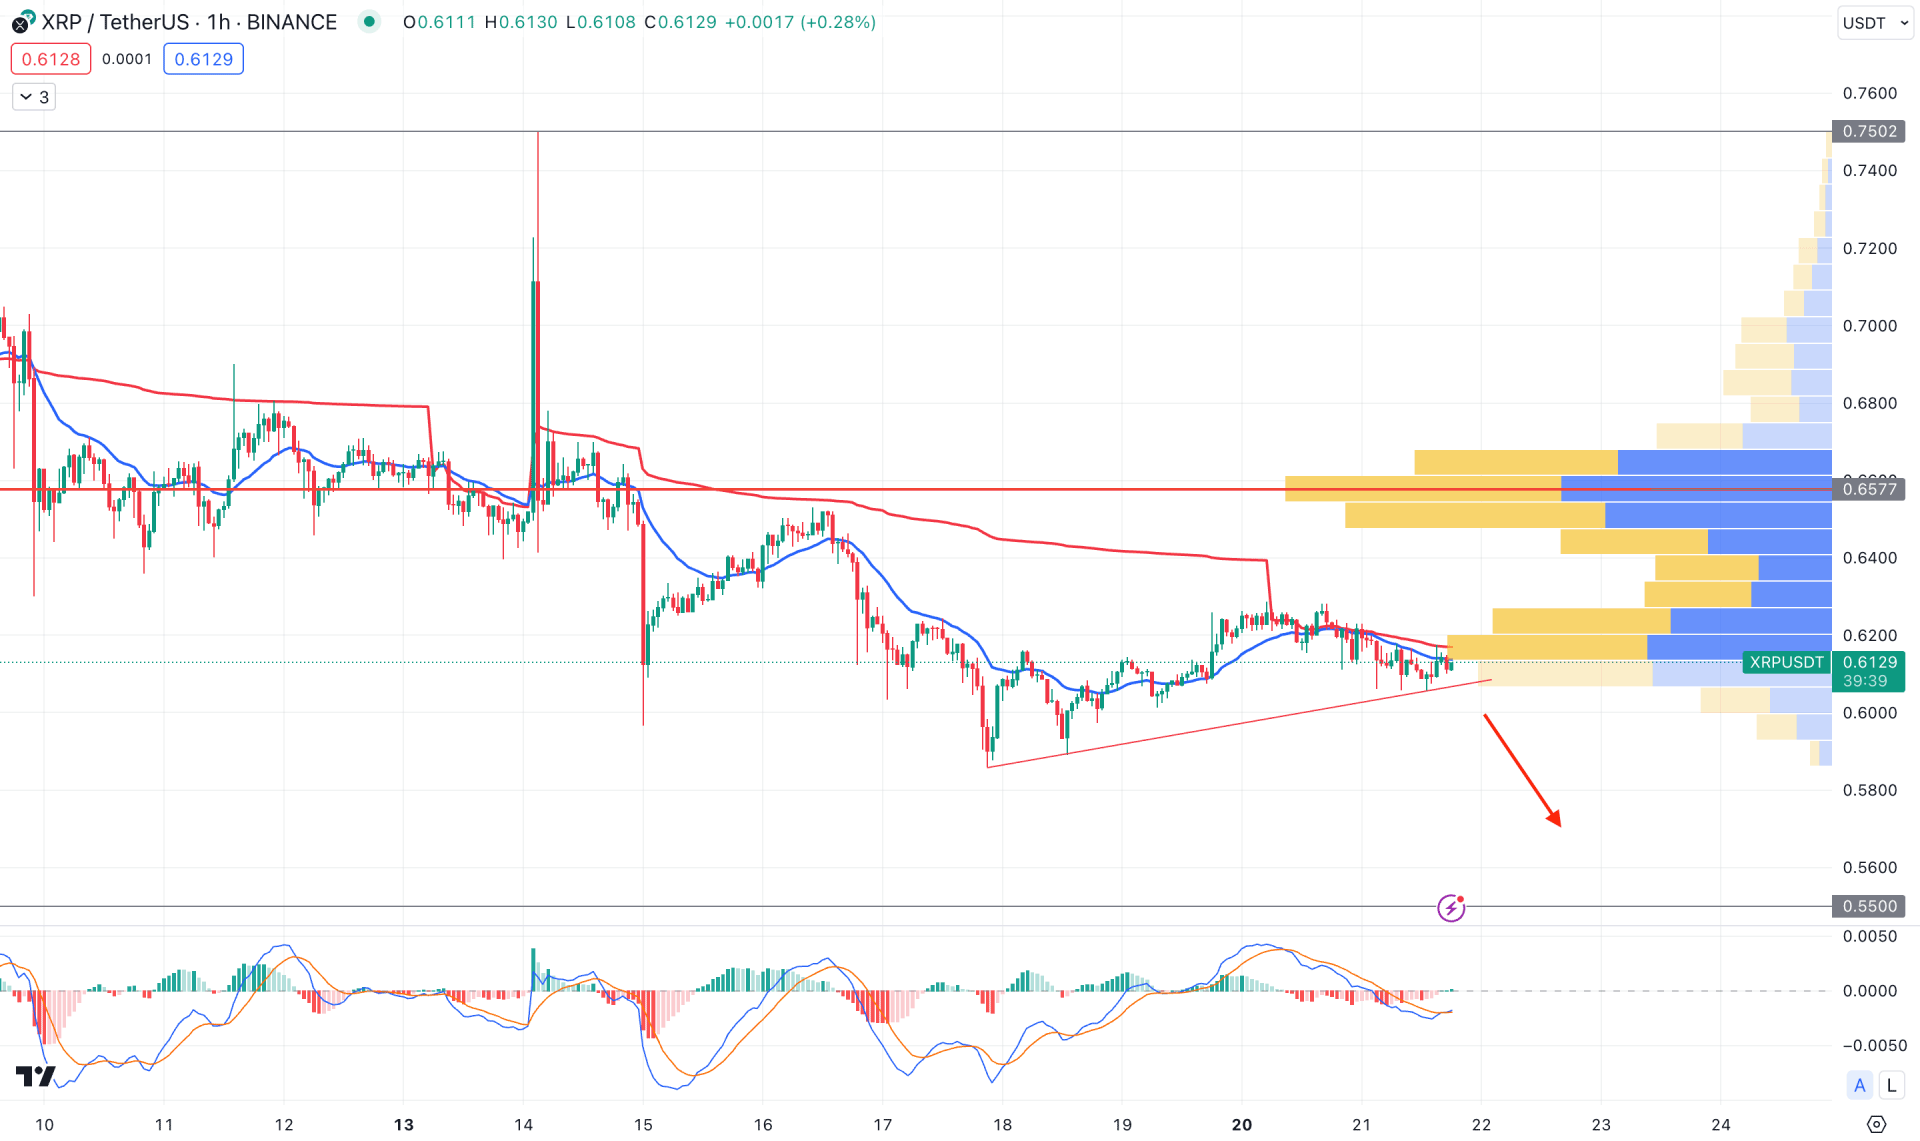
In the hourly chart, the overall market momentum is bearish as the visible range high volume level is above the current price. Moreover, the 20 EMA acts as a resistance as a bearish H1 candle is below the dynamic level.
In the MACD Histogram, bearish momentum is potent as recent reading shows a rebound to the neutral zone. Moreover, a bullish crossover is seen in the MACD Signal line, indicating limited selling pressure.
Based on the H1 outlook, a bearish H1 candle below the trendline support could be a short opportunity, where the main aim would be to test the 0.5500 psychological level. However, a bullish rebound with an hourly candle above the 0.6577 high volume level could be a valid long opportunity, targeting the 0.7500 level.
Based on the current market outlook, the bearish continuation is potent in the intraday chart. Therefore, investors should closely monitor how the price trades at the near-term support level, where a bearish pressure below the H1 trendline could be a short-term bearish opportunity.


