Published: May 17th, 2023
Ripple (XRP) showed strong buying pressure after the recent fundamental development. As per the current data, the token has been trading 5.8% higher in the last 7 days.
The U.S. The Securities and Exchange Commission's (SEC) attempt to suppress records related to William Hinman's speech was denied by Judge Analisa Torres, according to court documents filed on May 16.
The SEC argued that the documents should be sealed because they lacked relevance to the petitions for summary judgment. Also, their disclosure would be detrimental to the financial regulator. In contrast, Judge Torres ruled that the Hinman Speech Documents were pertinent to the judicial function and helpful to the judicial process.
This is not the first time that Judge Torres has denied the SEC's attempts to seal documents, and several members of the XRP community have embraced the news. In addition, the judge sealed Ripple's most recent financial statements from 2020 to the present while denying some of their requests to conceal all of their financial statements and other documents.
The chief executive officer of Ripple, Brad Garlinghouse, described the ruling as a victory for openness. At the same time, attorney Jeremy Hynes anticipates that the documents will disclose either lousy faith or embarrassing emails.
Let’s see the future price direction of this token from XRP/USDT technical analysis:
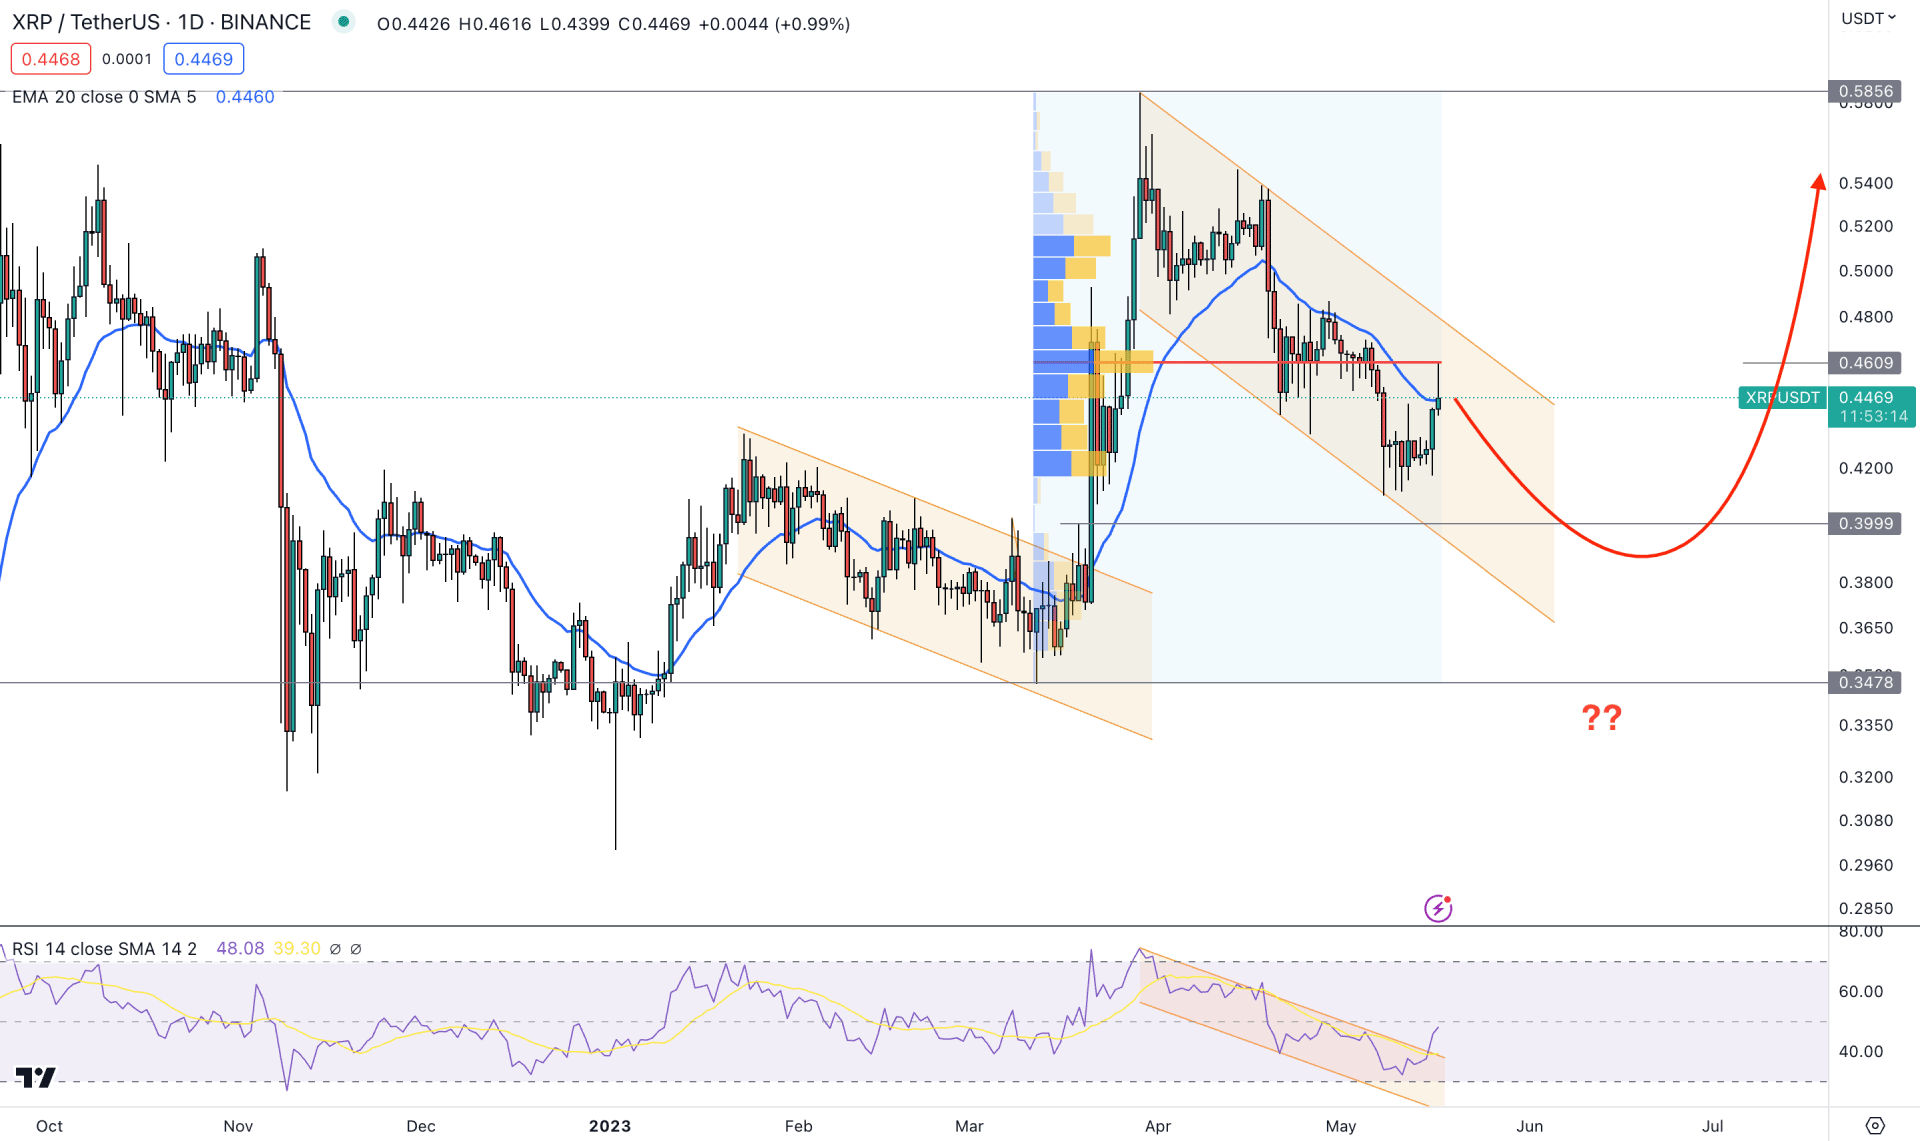
In the daily chart, the current market momentum is bullish for the XRP/USDT as several higher high formations are seen from left to right. In this context, this pair's primary intention would be to look for long trades only until the near-term critical support level is broken.
The buying pressure has been solid in this pair from the beginning of 2023, which came with a strong bullish exhaustion on 2 January 2023. Later, a descending channel breakout validated a bullish trend continuation pattern. At the most recent price, another channel formation is visible from where any breakout above the resistance level could resume the trend in the coming days.
Apart from the technical price pattern, the challenge for bulls is overcoming the latest high volume level. As the above image shows, the latest high volume level is at 0.4611, which is above the current price. It is a sign of sellers' presence in the market, and investors should wait for a strong bullish breakout above this area before opening any long position.
The dynamic level of the 20-day Exponential Moving Average is closer to the price, and the latest daily candle is struggling to hold momentum above it. However, the buying pressure is supported by the RSI channel breakout, while the latest RSI level is just below the 50.00 neutral line.
Based on this daily price outlook, XRP/USDT bulls need a stable price above the 0.4611 high volume level, with confluence support from the RSI by moving above the 50.00 line. In that case, an upside pressure is likely to open, where the main aim is to test the 0.5856 and 0.6000 levels.
The current price is still trading within the descending channel, where a bearish correction towards the 0.3999 area could offer another long opportunity. However, breaking below the 0.3478 level would invalidate the current momentum and lower the price towards the 0.3100 psychological level.
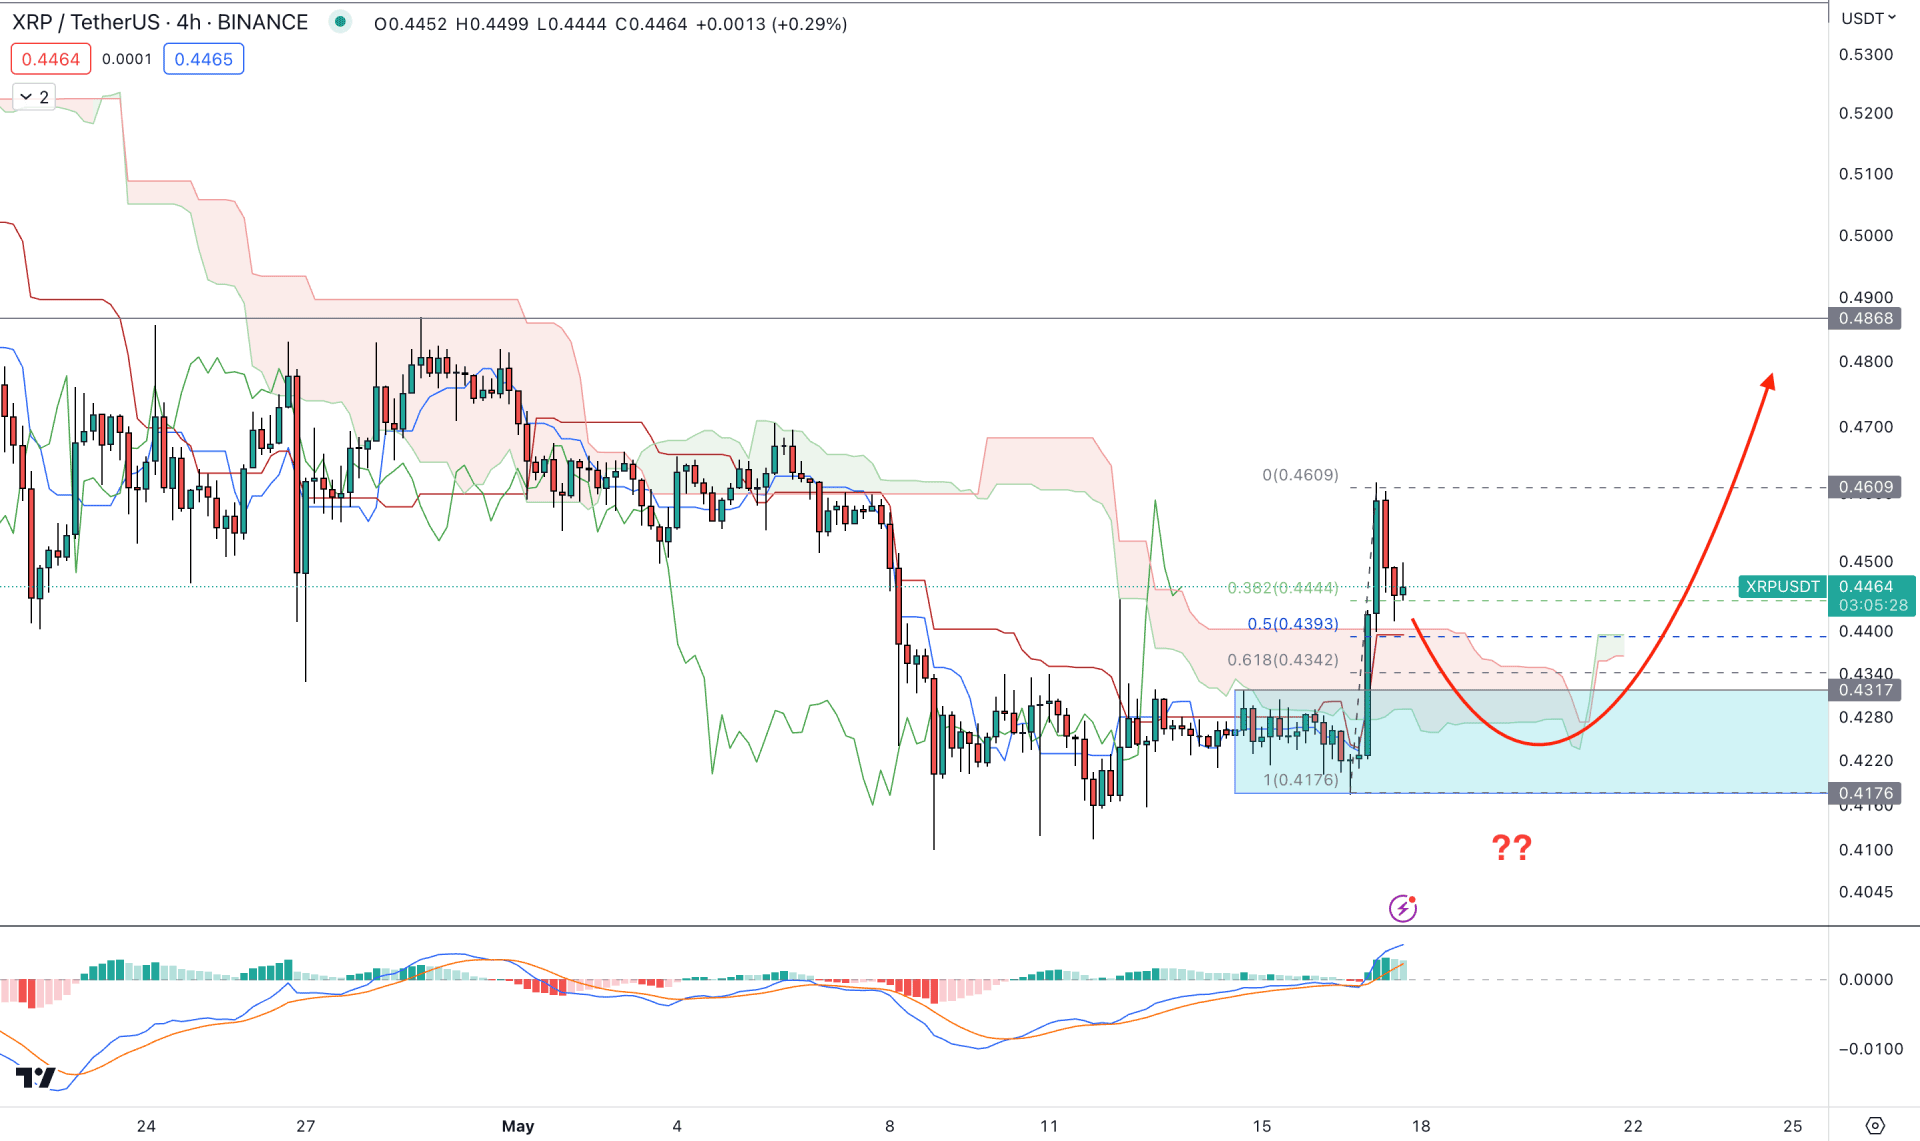
In the H4 chart of XRP/USDT, the bullish range breakout is visible where the latest Ichimoku Kumo Cloud changed its direction from bearish to bullish. We may expect the buying momentum to extend as the current price is trading above Cloud Support.
The latest range breakout came with an imbalance formation, which validated the 0.4317 to 0.4176 area as an order block from where the bullish pressure may come.
The indicator window shows a bullish possibility as the current MACD Histogram level is above the neutral line.
Based on the H4 structure, an immediate downside pressure and a bullish rejection from Ichimoku Kijun Sen support could offer a long opportunity, targeting the 0.4868 resistance level.
On the other hand, a bearish pressure with an H4 close below the 0.4170 level would validate the Cloud breakout, opening the possibility of reaching the 0.4000 area.
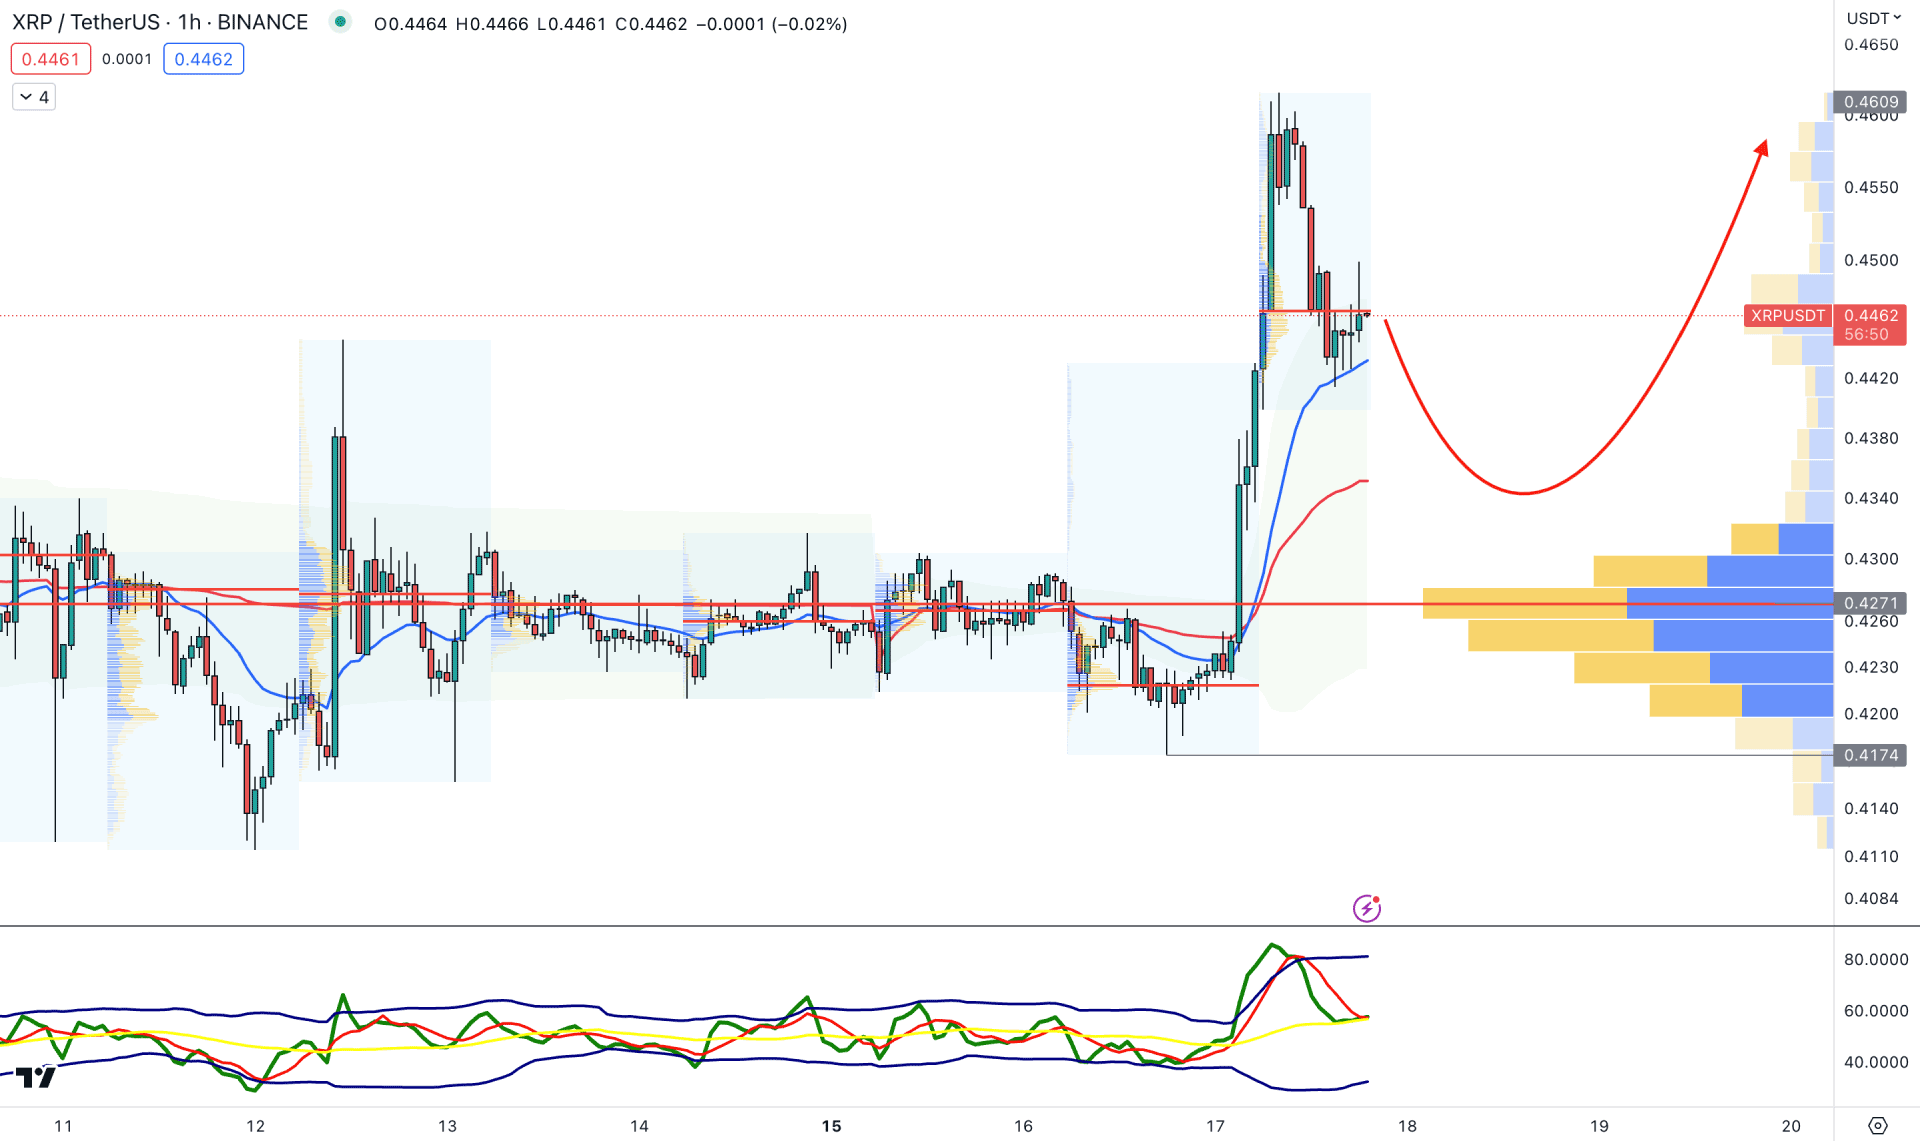
The hourly chart shows a strong bullish range breakout with support from the high volume level. Moreover, a strong bullish breakout is visible above the dynamic 20 EMA, which may work as a dynamic support.
The Traders Dynamic Index shows a downward momentum after visiting the overbought position. However, the current TDI level is still above the 50.00 line, which may influence buyers' position in the market.
Based on the H1 outlook, a bearish pressure toward the dynamic VWAP or 0.4271 high volume level could resume the buying pressure, targeting the 0.4600 level.
However, a failure to hold the price above the 0.4271 level could initiate a sharp drop towards the 0.4000 area.
Based on the current market outlook, XRP/USDT will likely extend its buying pressure any time. Investors should closely monitor the intraday price action as any bullish rejection on the intraday H4 chart could resume the trend.


