
Published: February 18th, 2026
Ripple (XRP) is trading sideways in the intraday chart due to ongoing headwinds in the cryptocurrency market. At $1.45, immediate support is beginning to form; nevertheless, a concentration of bearish bets may further depress the derivatives market and extend the decline.
XRP's inability to sustain its comeback is causing price swings as retail interest falters. The euphoria that drove the price to $1.67 on Sunday last week was undermined on Tuesday, when the Open Interest (OI) for XRP futures fell to $2.53 billion from $2.56 billion on Monday.
Open Interest (OI) is still well behind the July all-time high of $10.94 billion. Traders are closing positions in large numbers and refusing to establish new ones as OI declines.
A lack of faith in XRP's near-term optimistic outlook is indicated by the growing number of traders rushing into short positions, according to CoinGlass data.
Can sellers extend their dominance? Let's see the complete outlook from the XRP/USDT technical analysis:
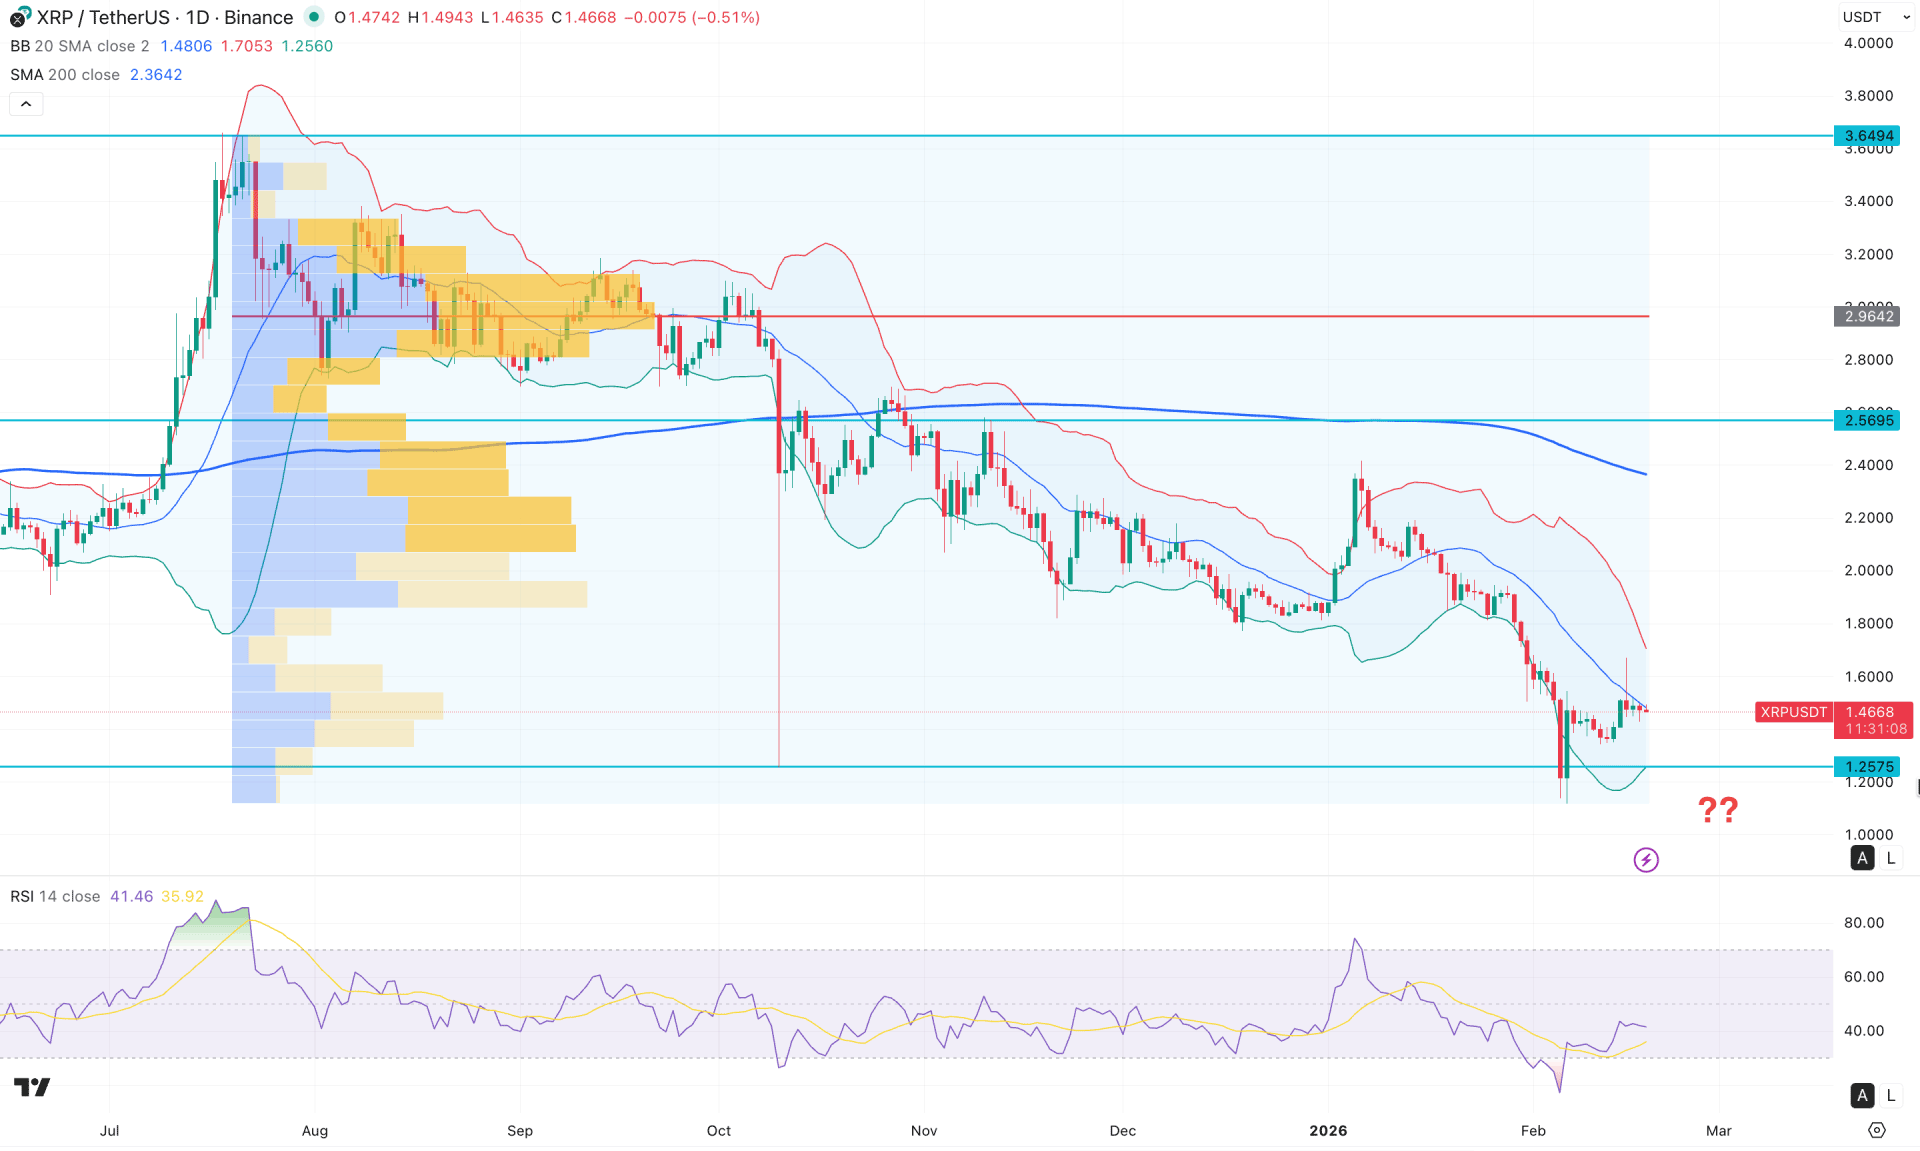
In the daily chart of XRP/USDT, the recent price action shows extreme selling pressure, taking out the existing yearly low. As a result, the market trend has shifted from bullish to bearish, requiring greater caution before considering any long positions.
On the higher timeframe, market momentum remains extremely bearish, as the price has been declining for five consecutive months. However, strong support is observed at the 1.2575 level, from where a minor bullish rebound is visible.
The weekly timeframe provides additional clarity, with the latest weekly candle closing as an inside bar, followed by bearish trend continuation. This is not a sufficient signal to consider the 1.2575 level a confirmed bottom. Since the prevailing market trend remains bearish, the primary bias favors selling opportunities.
From a volume perspective, the price is trading significantly below the high-volume level marked at 2.9642. As long as the price remains below this level, investor sentiment is likely to favor short positions. However, the widening gap between the current price and this high-volume level increases the probability of a temporary corrective rebound rather than a full trend reversal.
On the main price chart, a bearish trend structure remains intact. The price is currently facing resistance at the middle Bollinger Band, while the upper Bollinger Band is sloping downward, reinforcing bearish momentum. The long-term trend also reflects weakness, as the 200-day SMA has started to slope downward after a period of consolidation. Nevertheless, the widening gap between the current price and the 200-day SMA could signal a potential short-term bullish correction.
In the indicator window, the Relative Strength Index (RSI) previously reached the 30.00 oversold level, from which a recovery has begun. However, the RSI remains below the 50.00 neutral level, which must be reclaimed to validate a stronger bullish reversal.
Given the current market structure, investors should closely monitor how the price moves within the Bollinger Bands and around the middle band. A bearish rejection from the current price area, followed by a daily close below the middle band, could increase the likelihood of retesting the 1.2575 support level and potentially forming a new low below the 1.2500 area.
On the other hand, a range formation followed by a bullish breakout above the middle Bollinger Band could pave the way for a test of the 2.0000 psychological resistance level. However, a stronger bullish reversal would only be confirmed after a decisive breakout above the 2.5695 high-volume level.
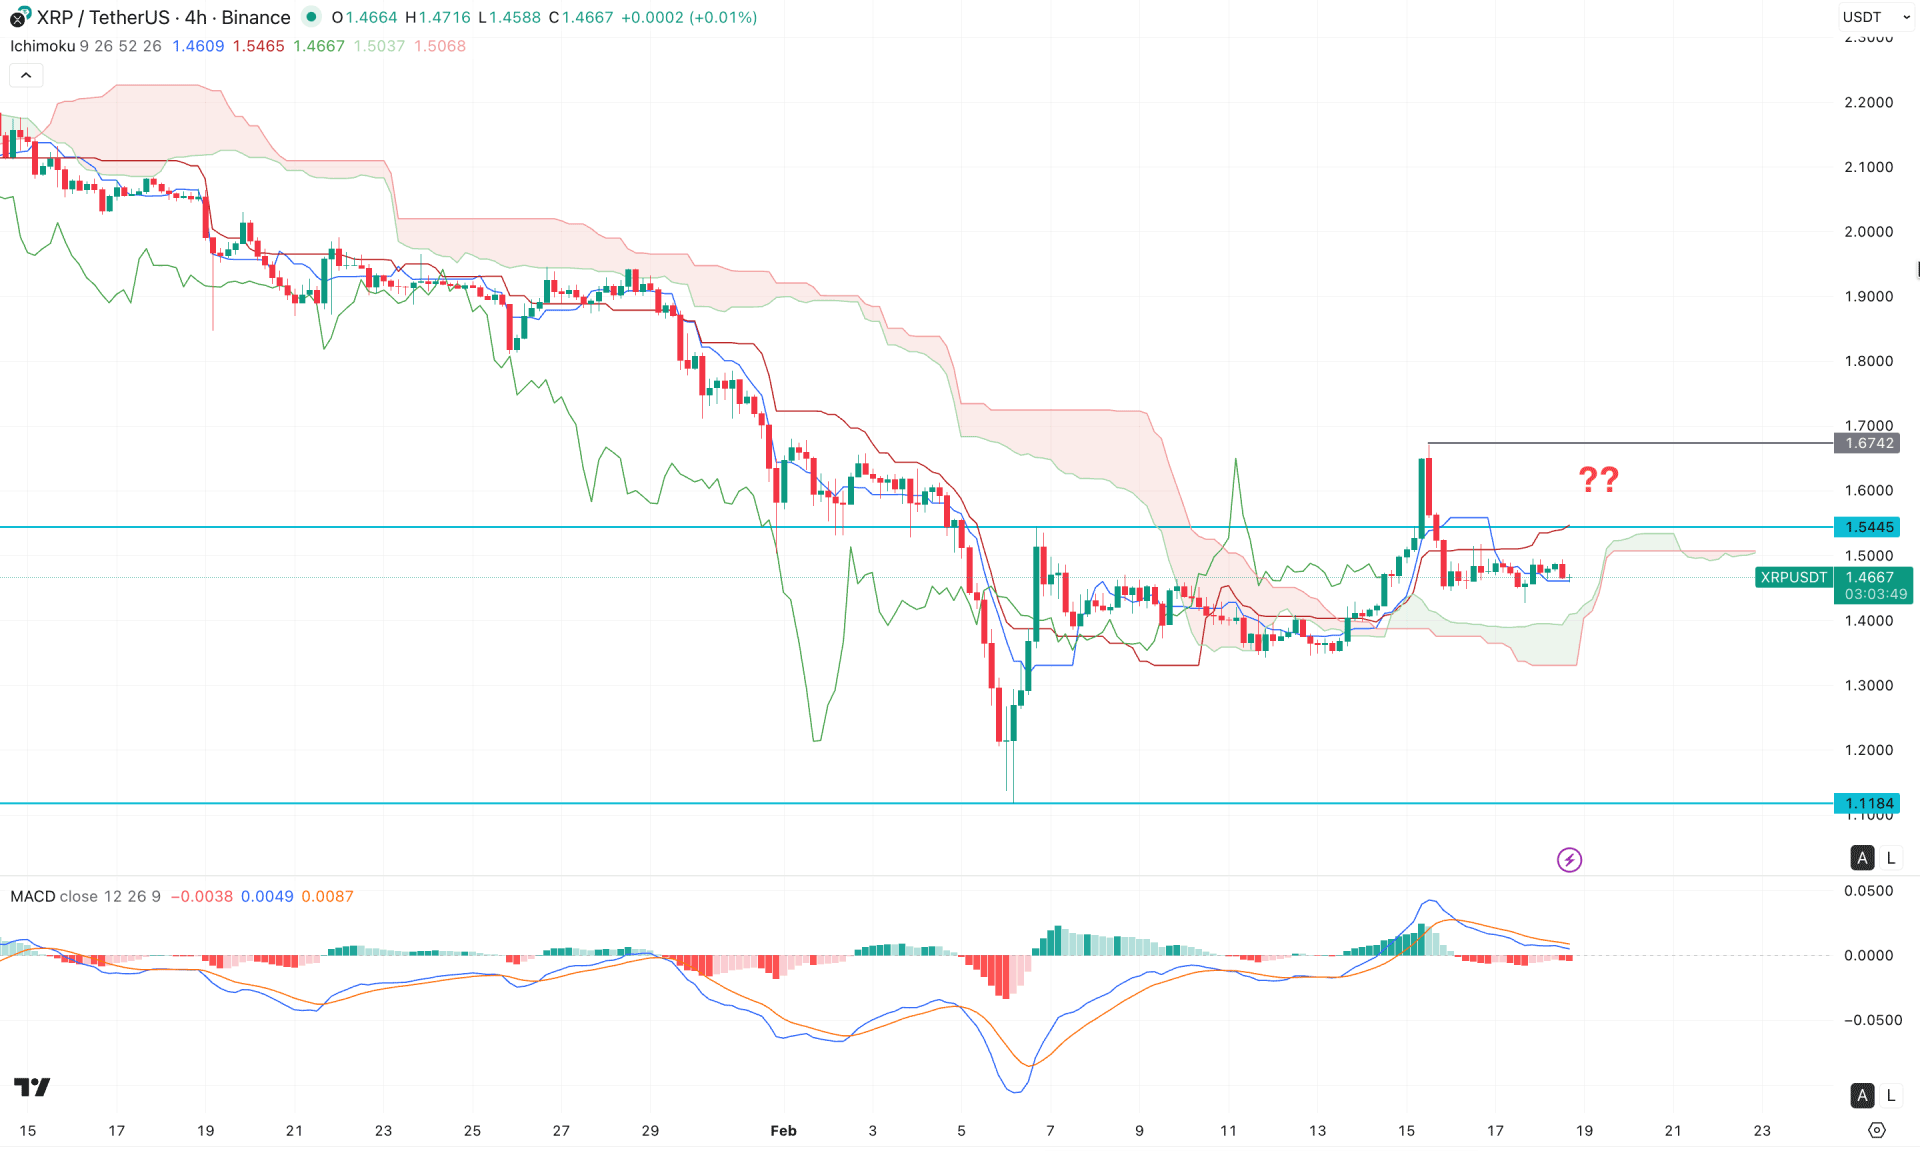
On the four-hour timeframe, the price rebounded and formed a bullish reversal above the cloud area, which is an early sign of a potential trend reversal. A new swing high was established at the 1.6742 level; however, the price failed to sustain upward momentum.
The future cloud is currently flat, as both leading spans are close together without a clear directional bias. Moreover, the price is trading within the dynamic lines, signaling a period of consolidation and sideways momentum.
In the indicator window, the MACD reflects a similar condition. The MACD line is positioned slightly above the neutral level, but the signal line remains close to equilibrium, indicating a lack of strong directional momentum. Although the MACD is marginally positive, no significant bullish expansion is visible.
Given the current H4 market structure, investors should monitor how the price behaves within the current range. A bearish breakout, followed by an H4 close below the range support, could present a potential short opportunity targeting the 1.2000 level.
On the other hand, a strong bullish recovery with sustained price action above the 1.5445 level is required before considering long positions. The primary resistance to monitor is the 1.6742 level, with a potential extension toward the 2.0000 psychological resistance zone if bullish momentum strengthens.
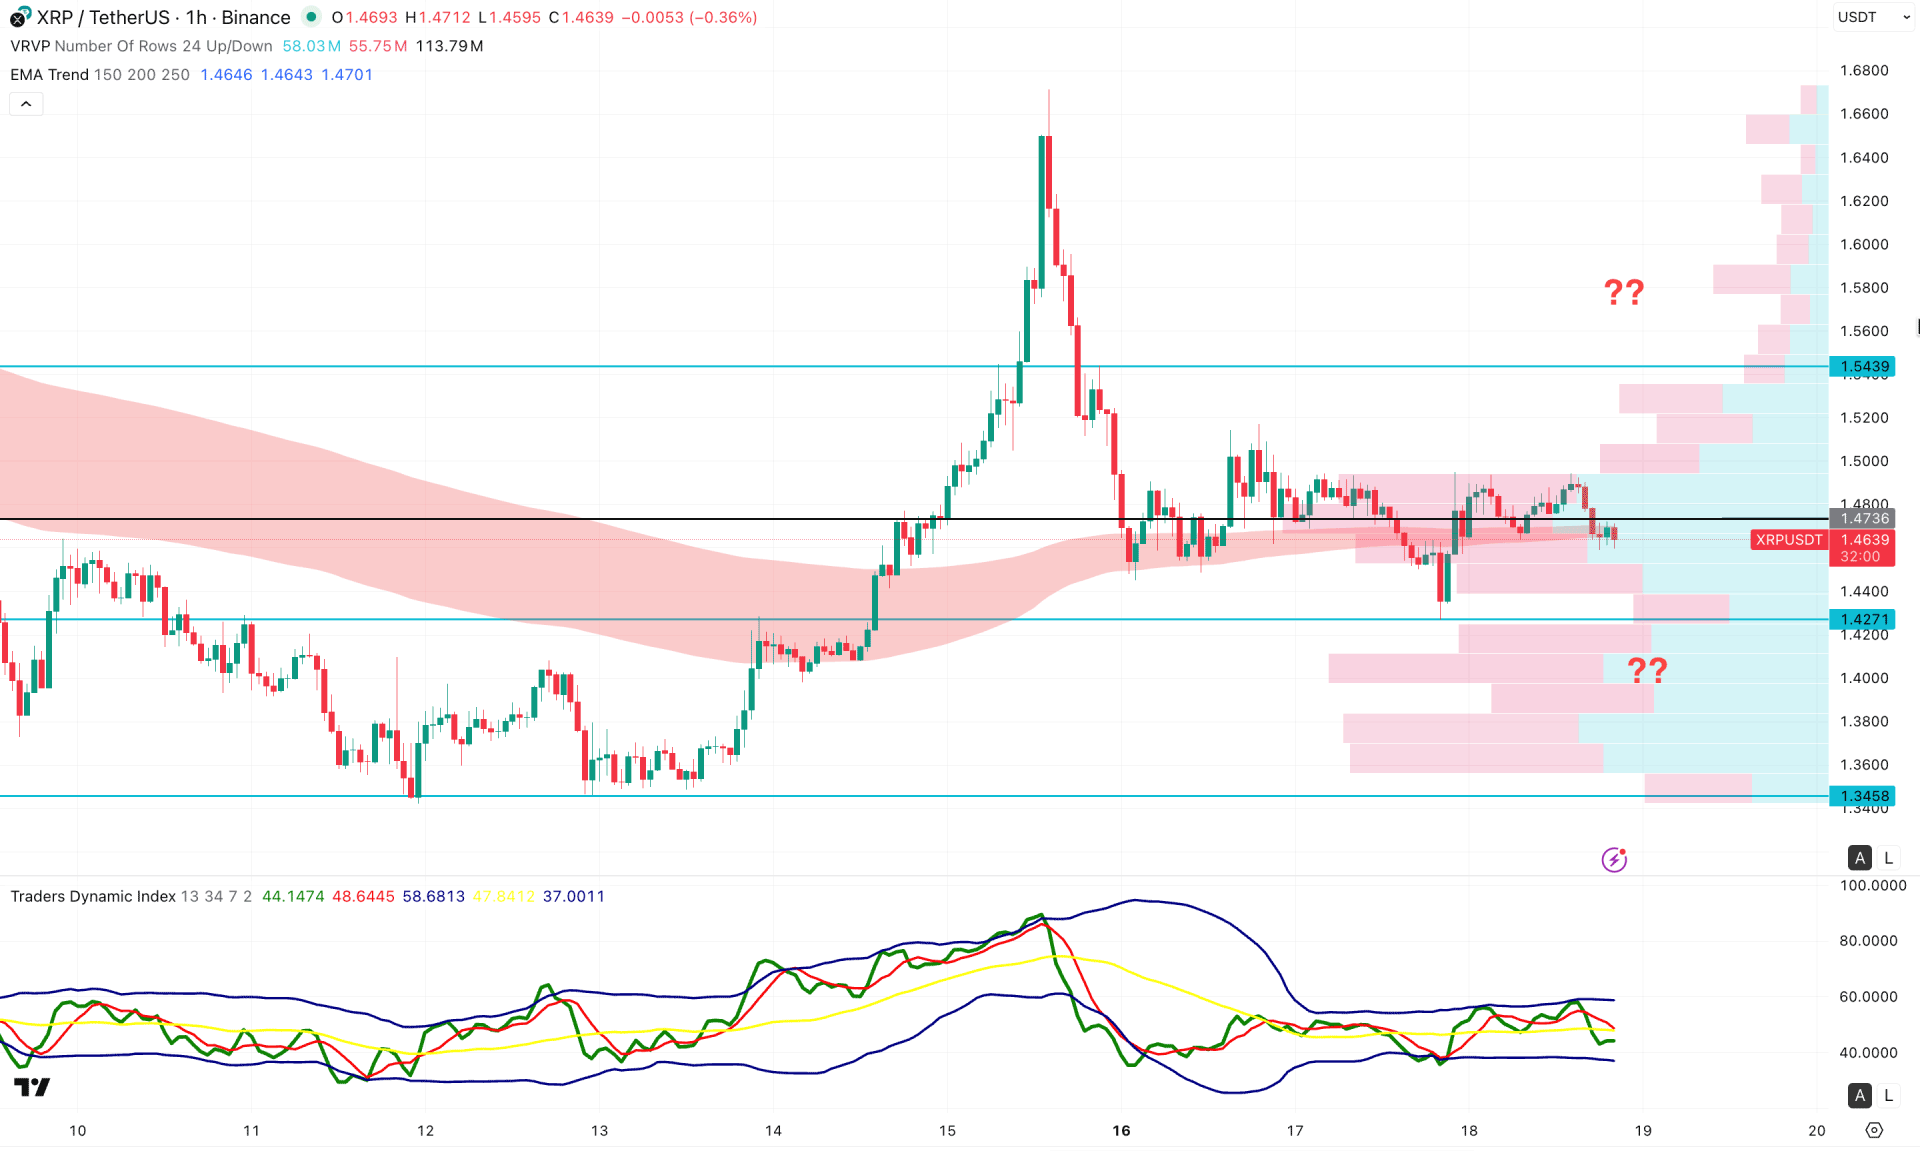
On the hourly timeframe, sideways market momentum is evident, with no clear directional bias in the recent price action. The price is currently moving within a rectangle pattern, indicating consolidation. A valid breakout is required before anticipating a sustained trend.
The price is aligned with the Exponential Moving Average (EMA) wave, signaling corrective momentum rather than impulsive movement. Additionally, the high-volume level is positioned close to the current price, further indicating ongoing sideways pressure.
In the secondary indicator window, the Traders Dynamic Index (TDI) remains below the 50.00 level, with flat upper and lower peaks. This reflects a consolidating market structure, where intraday pressure remains bearish but lacks strong momentum.
Based on the hourly market structure, a bearish breakout with an hourly close below 1.4270 could create a high-probability short opportunity targeting the 1.3458 support zone.
Conversely, a liquidity sweep near the short-term support area, followed by a strong bullish hourly close above the 1.5000 level, could extend the corrective rebound toward the 1.6500 resistance area.
Based on the overall market structure, XRP/USDT remains in a broader bearish trend. While the current price may appear discounted from a long-term perspective, a confirmed bottom has not yet formed. The prevailing momentum remains weak, suggesting further downside before a sustainable bullish reversal develops.


