
Published: April 15th, 2025
According to a post on X by a renowned cryptocurrency analyst, most Binance futures traders who are placing bets on the future price movements of XRP have become optimistic, with 66.86% of all opened positions being long.
Even though this would initially seem like good news, a closer examination of XRP's price behavior in the wake of similar events reveals otherwise. Like on April 5–6, when the longs exceeded 70%, Binance traders in futures were even more optimistic.
However, a day later, Ripple's token dropped to a multi-month low of $1.6, below the critical $2 psychological level.
It is important to remember that when XRP's price fell by 25% last week, it wasn't an isolated asset. The growing animosity between the United States and the remainder of the world caused the whole cryptocurrency industry, Wall Street, and the stock market to plummet.
However, there was another case from late March that was less traumatic. At that time, when seeks on Binance futures surged beyond 72%, XRP was trading at $2.4. Although XRP saw some growth in the following hours, by the close of the month, it had fallen below $2.05.
According to some observers, the futures dealers on Binance appear to be greedy right now, especially when it comes to XRP, which may have already factored in the settlement of the SEC lawsuit.
Let's look at the further aspects of this token from the XRP/USDT technical analysis:
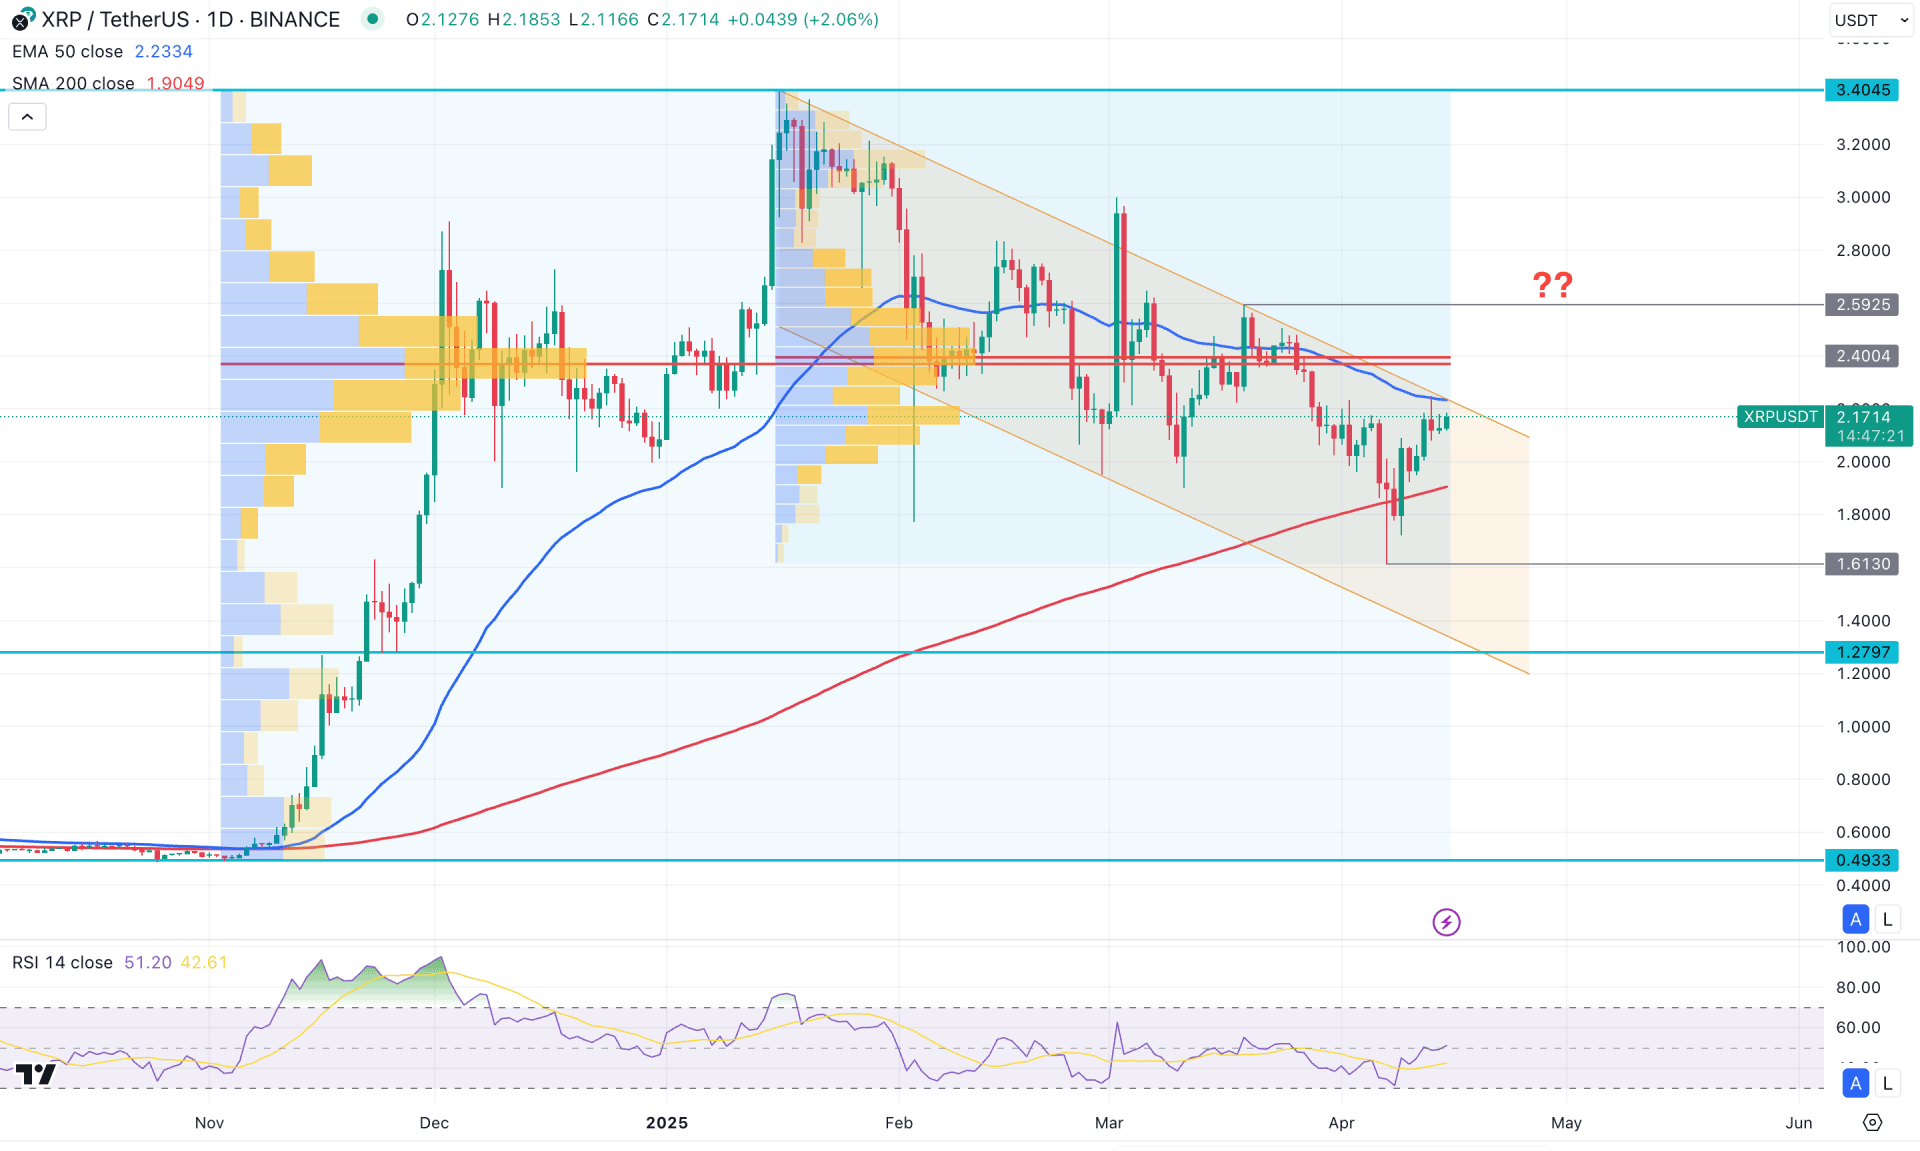
An extended downside correction is visible in the daily chart of XRPSDT after forming a bottom at the 3.40 level. Therefore, the ideal trading approach for this pair is to look for a bullish continuation once the correction is over.
On the other hand, the higher timeframe price action tells a different story, with a clear pump-and-dump pattern visible on the monthly chart, followed by a bearish reversal. Notably, the most recent monthly candle closed as a doji formation, reflecting indecision after the bearish momentum seen in February 2025. As long as the price remains around the February 2025 opening level, further confirmation is needed before anticipating a stable trend.
A potential bullish reversal is visible in the weekly timeframe, sweeping liquidity from an 18-week low. However, the current price is still trading below the 2.240 weekly resistance, which must be broken to validate the bullish pressure.
In the main price chart, the overall market is trading within a descending channel after breaking down from a previous bullish channel. A breakout from the descending channel could present a primary long opportunity. Meanwhile, the 200-day SMA is currently below the price and acting as a major support. However, there is notable high-volume activity above the current price, which is acting as a major barrier, along with the 50-day EMA.
In this case, stable bullish momentum might only appear after overcoming the high-volume area around 2.40. Additionally, the Relative Strength Index (RSI) indicates a bullish possibility, as it currently hovers above the 50.00 level.
Conversely, failure to break out of the descending channel with a valid bullish breakout could be an alarming sign for bulls. In that case, any bearish rejection from the 2.2500–2.2590 area could extend the bearish trend. If that happens, the price might experience further selling pressure and move below the 1.6130 level in the coming days.
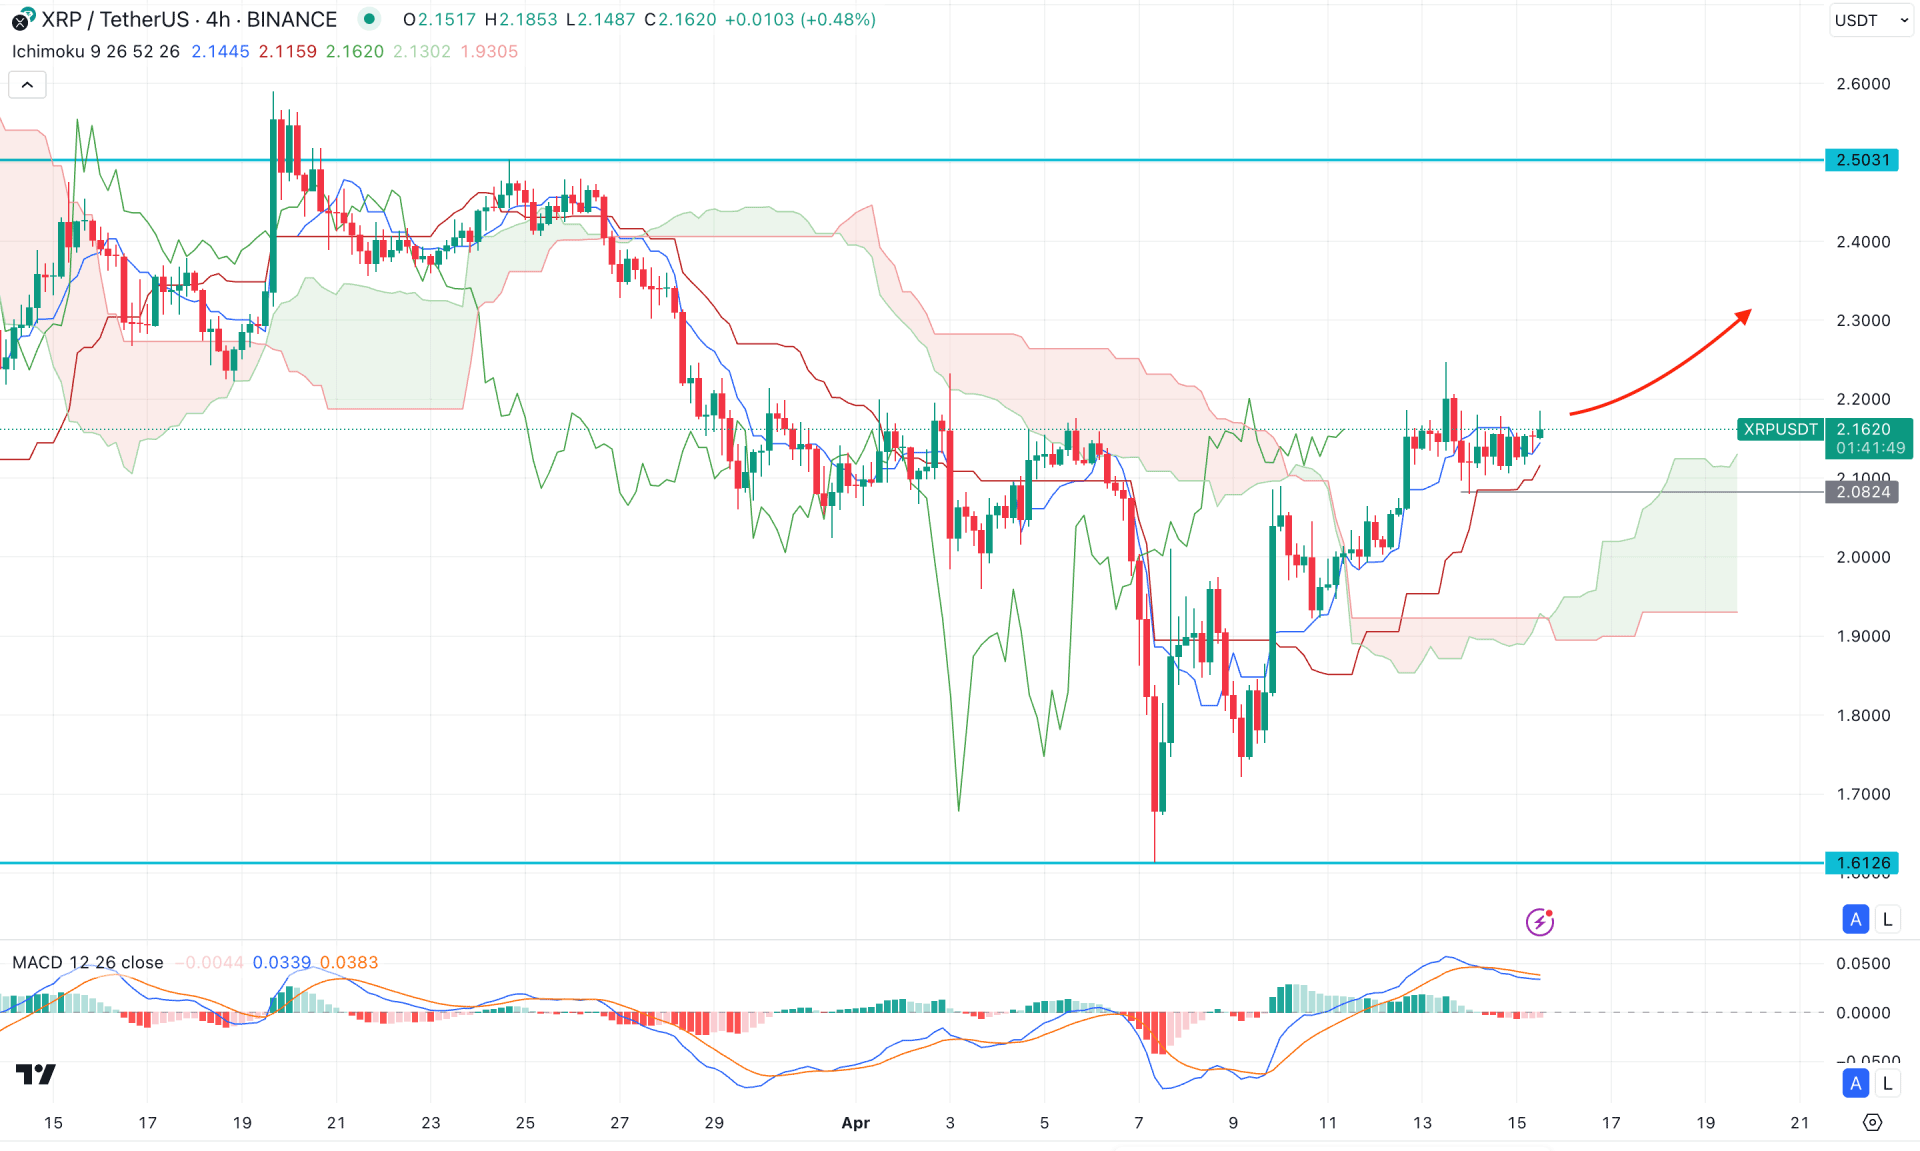
In the H4 timeframe, the overall market momentum is bullish as the recent price has formed a bullish recovery above the Ichimoku Cloud zone. Moreover, the Future Cloud is widened, where the Senkou Span A is above the Senkou Span B.
In the secondary window, the MACD Histogram shows a corrective pressure as the current line is with the neutra point. Moreover, the MACD signal line is at the positive zone, from where a bearish crossover is visible.
Based on this outlook, a bullish rebound is possible from the near-term support level as the current price is facing support from the Kijun Sen level. On the bullish side, the immediate target level is at the 2.501 level before moving beyond the 3.000 area.
On the bearish side, a failure to hold the price above the cloud area could be an alarming sign to bulls. In that case, downside pressure with a stable market below the 1.9000 level could be a bearish opportunity for this pair.
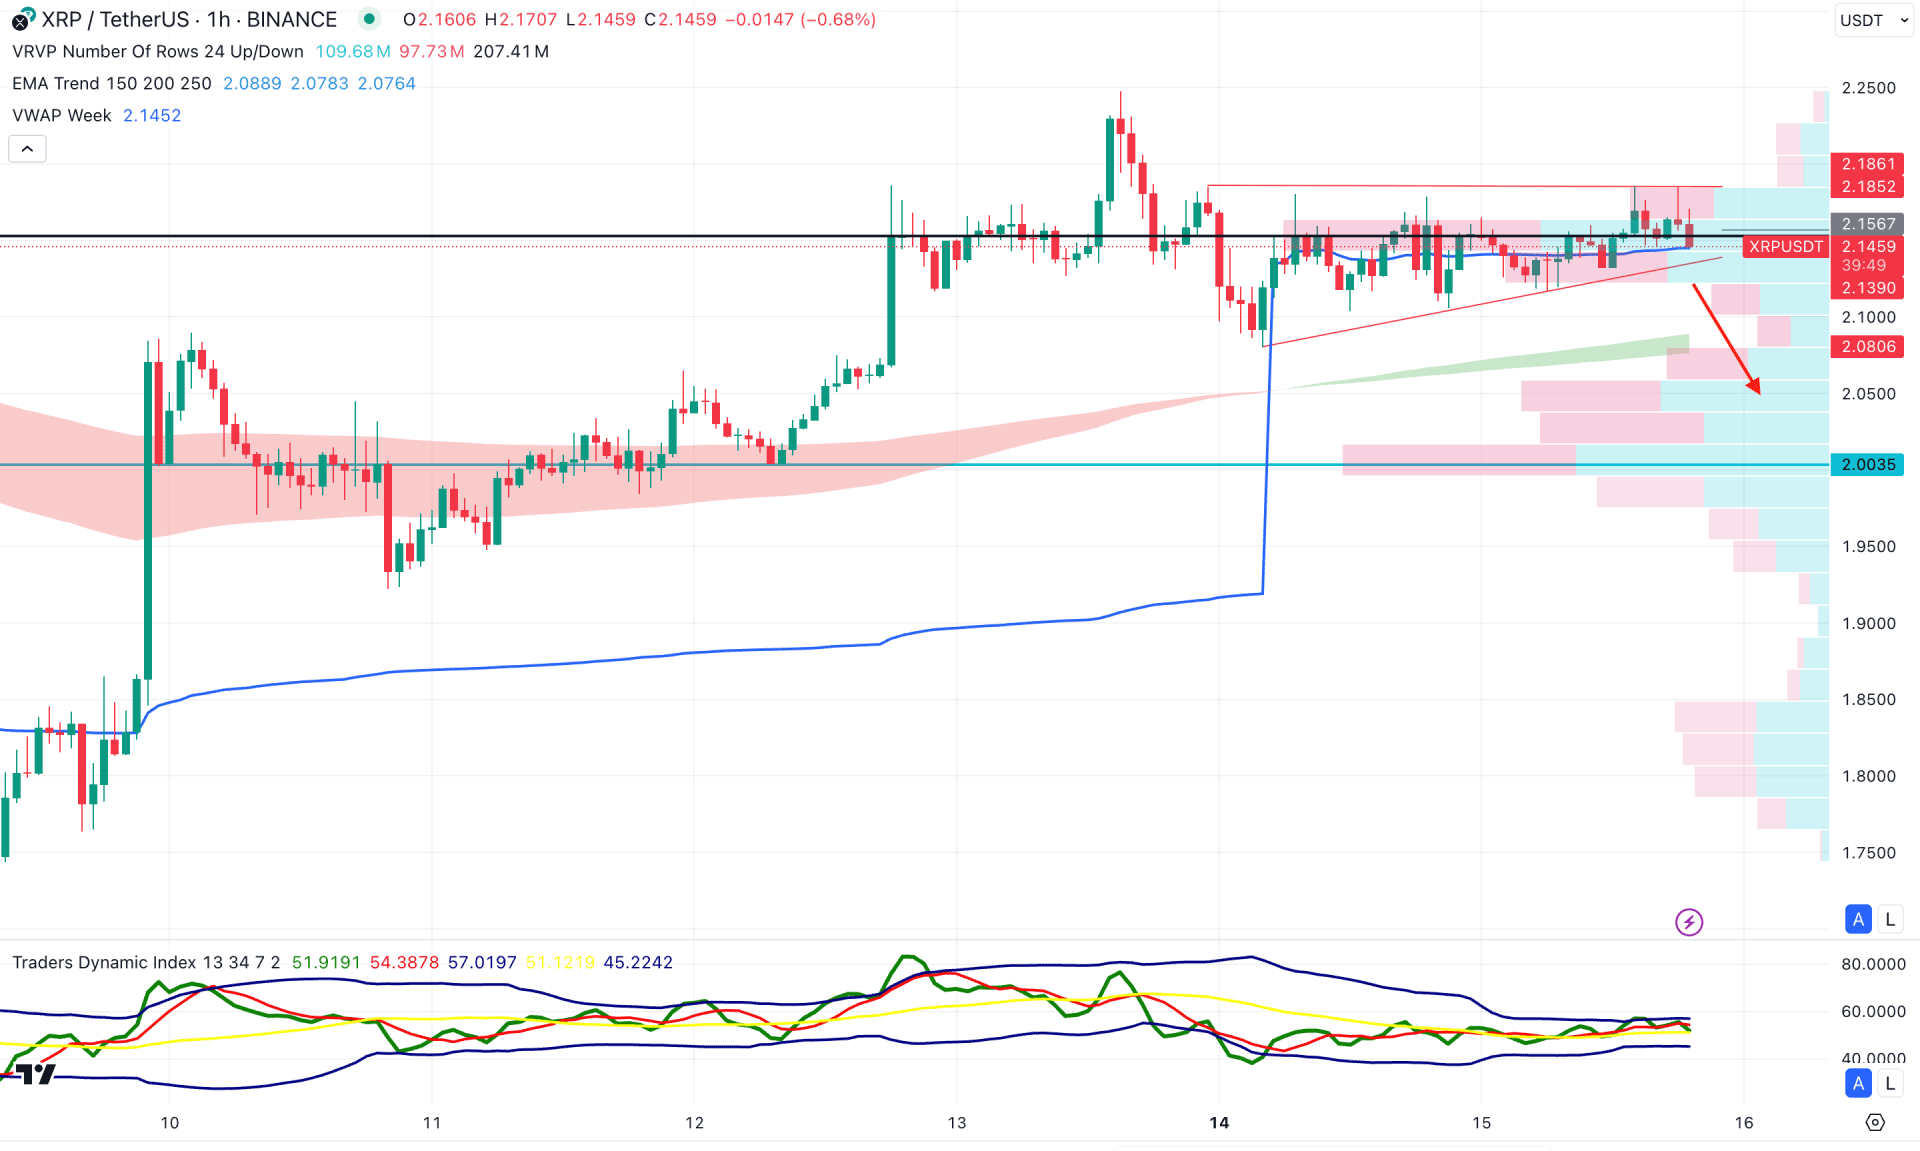
In the hourly timeframe, the XRPUSD is facing an intraday selling pressure as the current price is hovering near the intraday high volume line.
Although the moving average wave is below the current price, the price is trading sideways in the congestion area.
On the other hand, the Traders Dynamic Index (TDI) remains sideways above the 50.00 line, which signals buyers presence.
Based on this outlook, a bearish trendline breakout could be an intraday selling opportunity, aiming for the 2.003 level.
On the other hand, any struggle to hold the selling pressure at the EEMA wave area could increase the selling pressure, following the major bullish trend.
Based on the current market structure, the long-term bullish wave awaits a validation in the XRP/USDT price. Investors should monitor how the price reacts on the daily channel resistance as a valid break could resume the existing bullish trend.


