Published: April 4th, 2023
Reserve Rights Token (RSR) is a cryptocurrency designed to stabilize the value of volatile cryptocurrencies by creating a decentralized stablecoin network. The Reserve Protocol is intended to facilitate the creation of stablecoins tied to any asset, including fiat currencies, commodities, and cryptocurrencies. RSR is used as collateral for stablecoin generation, and RSR holders can earn rewards for network participation.
The Reserve Protocol is based on the Ethereum blockchain and employs a dual token format, with RSR as the utility token and Reserve Stablecoin (RSV) as the stablecoin. The Reserve Protocol is a decentralized and censorship-resistant alternative to centralized stablecoin providers such as Tether and USD Coin.
The team at the Federal Reserve is committed to promoting financial stability to countries with high inflation and limited access to stable currencies. The team has connections with several organizations striving to increase financial inclusion in Latin America, including the government of Venezuela.
The price of RSR is highly variable and is affected by factors such as the demand for stablecoins, the adoption of the Reserve Protocol, and the general market circumstances. As with other cryptocurrencies, investment in RSR includes a significant risk and should be undertaken only after thorough research and evaluating one's risk tolerance.
Let’s see the upcoming price direction from the RSR/USDT technical analysis:
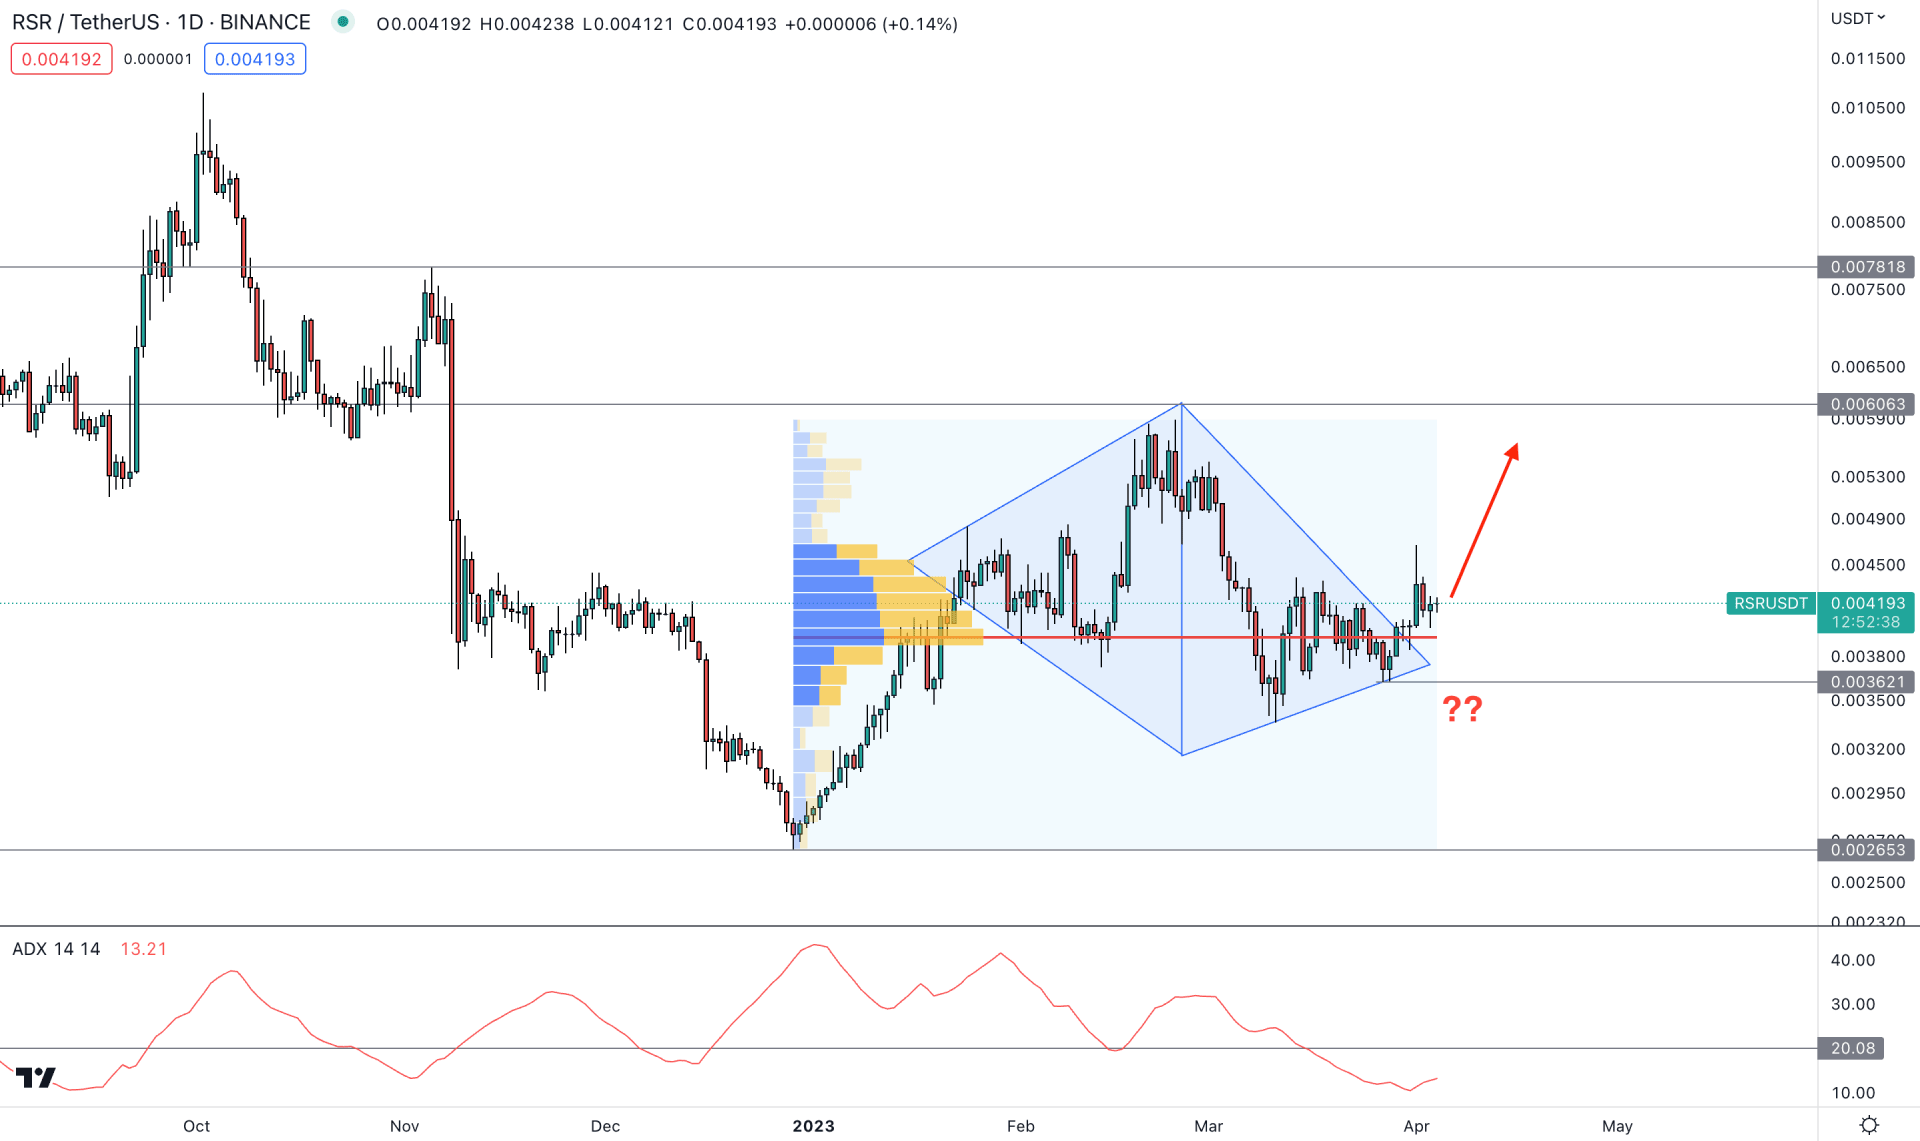
After three sideways weeks, RSR/USDT showed some bullish pressure with institutional traders' interest. Therefore, the primary trading idea of this token is to look for long opportunities as long as the price trades above the 0.003621 key support level.
In the daily chart, the buying possibility is potent from the potential “Diamond Pattern” breakout, where the current price trades higher from the trendline resistance. The momentum during the bullish breakout was solid, which came with impulsive pressure followed by a bearish correction.
The fixed range high volume level since January 2023 is just below the current price, working as an immediate support level. It is a sign that significant buy orders are running in this part that can work as a strong bullish factor.
The current tradable range is clear where the latest bullish pressure after the sell side liquidity gran is available at the 0.003621 level, which would be the bottom of the range. On the upside, the inverse pattern is available at the 0.006063 level, which will be the top. The current price is trading at the discounted zone of this range, which could offer more upside pressure in the coming days.
Although the buying possibility is potent after the pattern breakout, investors should wait until the ADX reaches the 20.00 line before having a trend trading opportunity.
Based on this current outlook, the buying possibility is valid if the price trades above the 0.003621 support level. The primary aim of the buying pressure is to test the 0.00600 psychological level.
However, a bearish pressure may come if the price exceeds the 0.003600 level with a bearish daily candle. In that case, the sell-side pressure can extend towards the 0.00300 level.
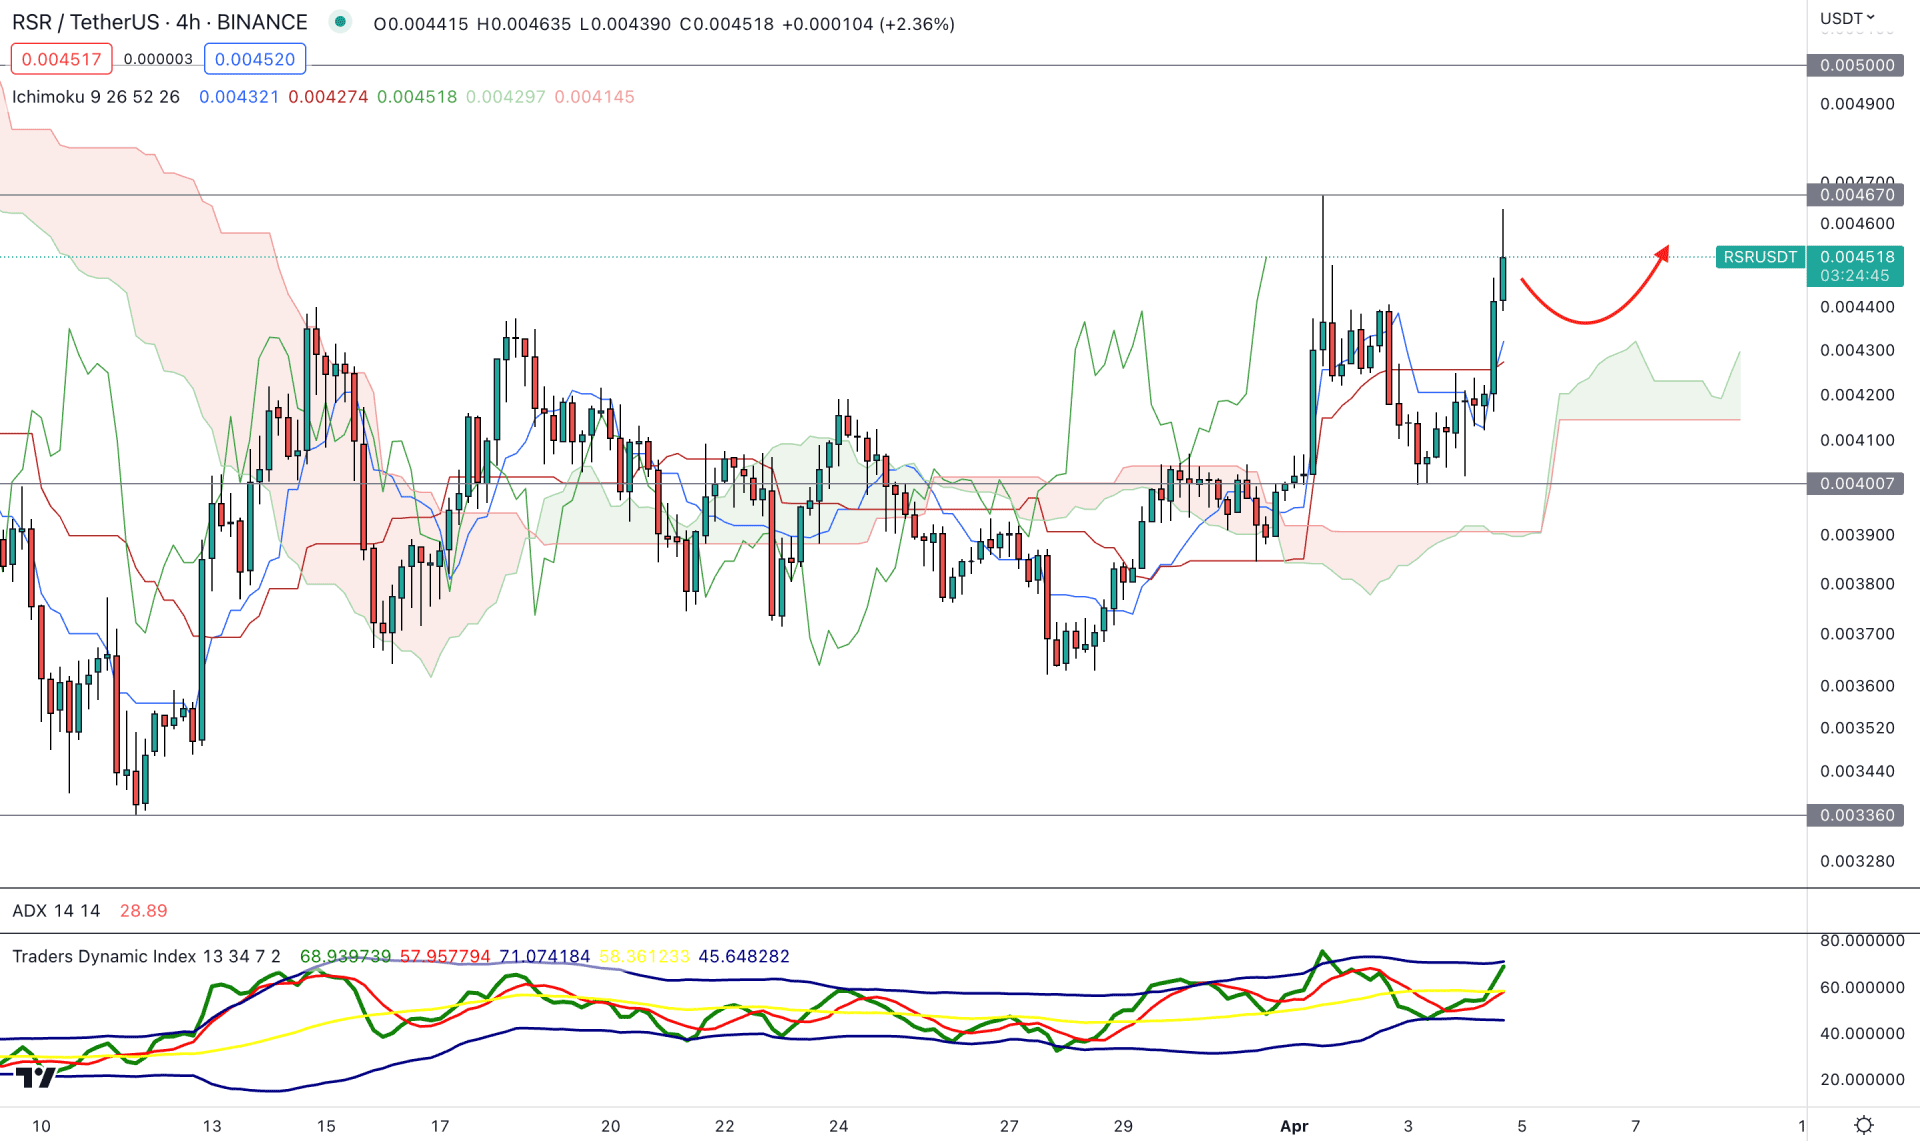
In the intraday chart, the current price is trading higher above the Ichimoku Kumo Cloud, which is signaling a possible buying pressure in the RSR/USDT price.
Although the thickness of the cloud support is not strong, the future cloud’s position is stable where the Senkou Span A is above B. Moreover, the Traders Dynamic Index (TDI) indicator shows a buying pressure as the current TDI level is above the 50.00 line.
Based on the current H4 structure, a bullish trend continuation could extend as the current price is trading above the dynamic Kijun Sen level. In that case, the upside pressure could extend towards the 0.00500 psychological level.
The alternative trading approach is to wait for the price coming below the 0.00400 level before aiming for the 0.00360 level.
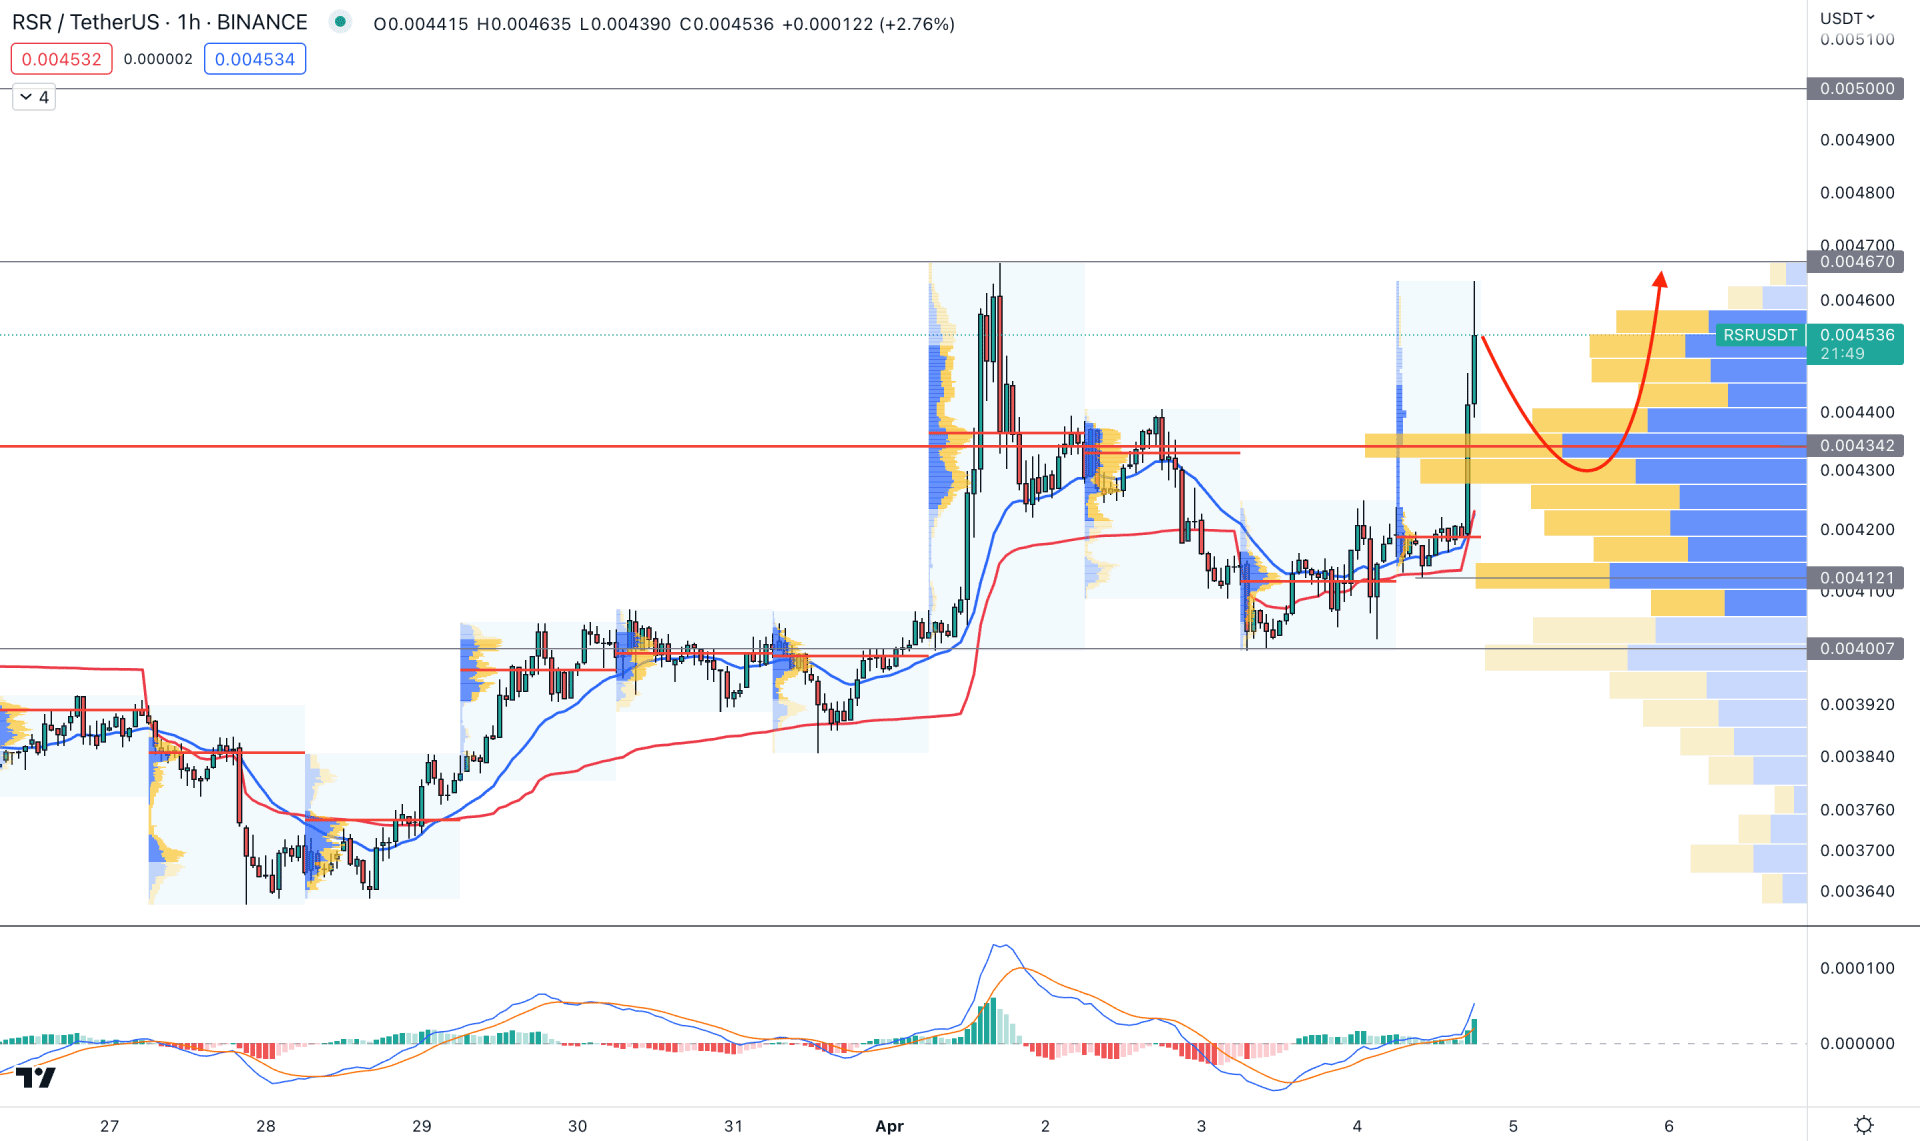
In the H1 chart, the current market outlook is bullish as the latest visible range high volume level is below the current price.
A strong bullish impulsive leg is seen from the dynamic 20 EMA support, which increases the possibility of a downside correction.
In the indicator window, the MACD Histogram is bullish whereas the current MACD EMA is aiming higher with a bullish crossover.
Based on the current price structure, a minor bearish correction and a bullish rejection from the dynamic 20 EMA could open a long opportunity, where the main aim is to test the 0.00500 level.
Based on the current multi-timeframe analysis, RSR/USDT is more likely to increase in the coming days. Investors should wait for the sufficient downside correction before joining the long-term bullish trend.


