Published: December 25th, 2024
On December 3, the Reserve Rights (RSR) token saw a notable 88% increase, peaking at a multi-year record of $0.017. However, the pump and dump are seen from the peak, raising a question of the possible bullish continuation.
The idea that veteran SEC commissioner Paul Atkins may be chosen to be the next head of the Securities and Exchange Commission of the United States (SEC) is substantially responsible for this spike. Atkins is the front-runner, and reports indicate that Donald Trump will probably make this declaration soon.
Prior to this, Atkins was an expert on the Reserve Rights Foundation, which created the RSR token. Nevin Freeman, the CEO and co-creator of Reserve, said Atkins helped steer the project in its early stages. Freeman commended Atkins for having a fair viewpoint on cryptocurrencies and said he hoped that, if chosen, Atkins would provide an equitable approach to rulemaking. According to reports, Atkins has been amenable to collaborating on initiatives involving cryptocurrencies since 2017.
The digital currency sector is excited about the possible appointment, as attorney John Deaton has called Atkins a "solid choice" for SEC authority. The market is hopeful that under his direction, the regulatory landscape for digital assets may improve. Eleanor Terrett, a correspondent for Fox News, speculated on December 2 that Trump would name the fresh SEC chair in a matter of days. It is anticipated that the present SEC Chair, Gary Gensler, who resigned in November, will be replaced shortly.
Let's see the further aspect of this coin from the RSR/USDT technical analysis:

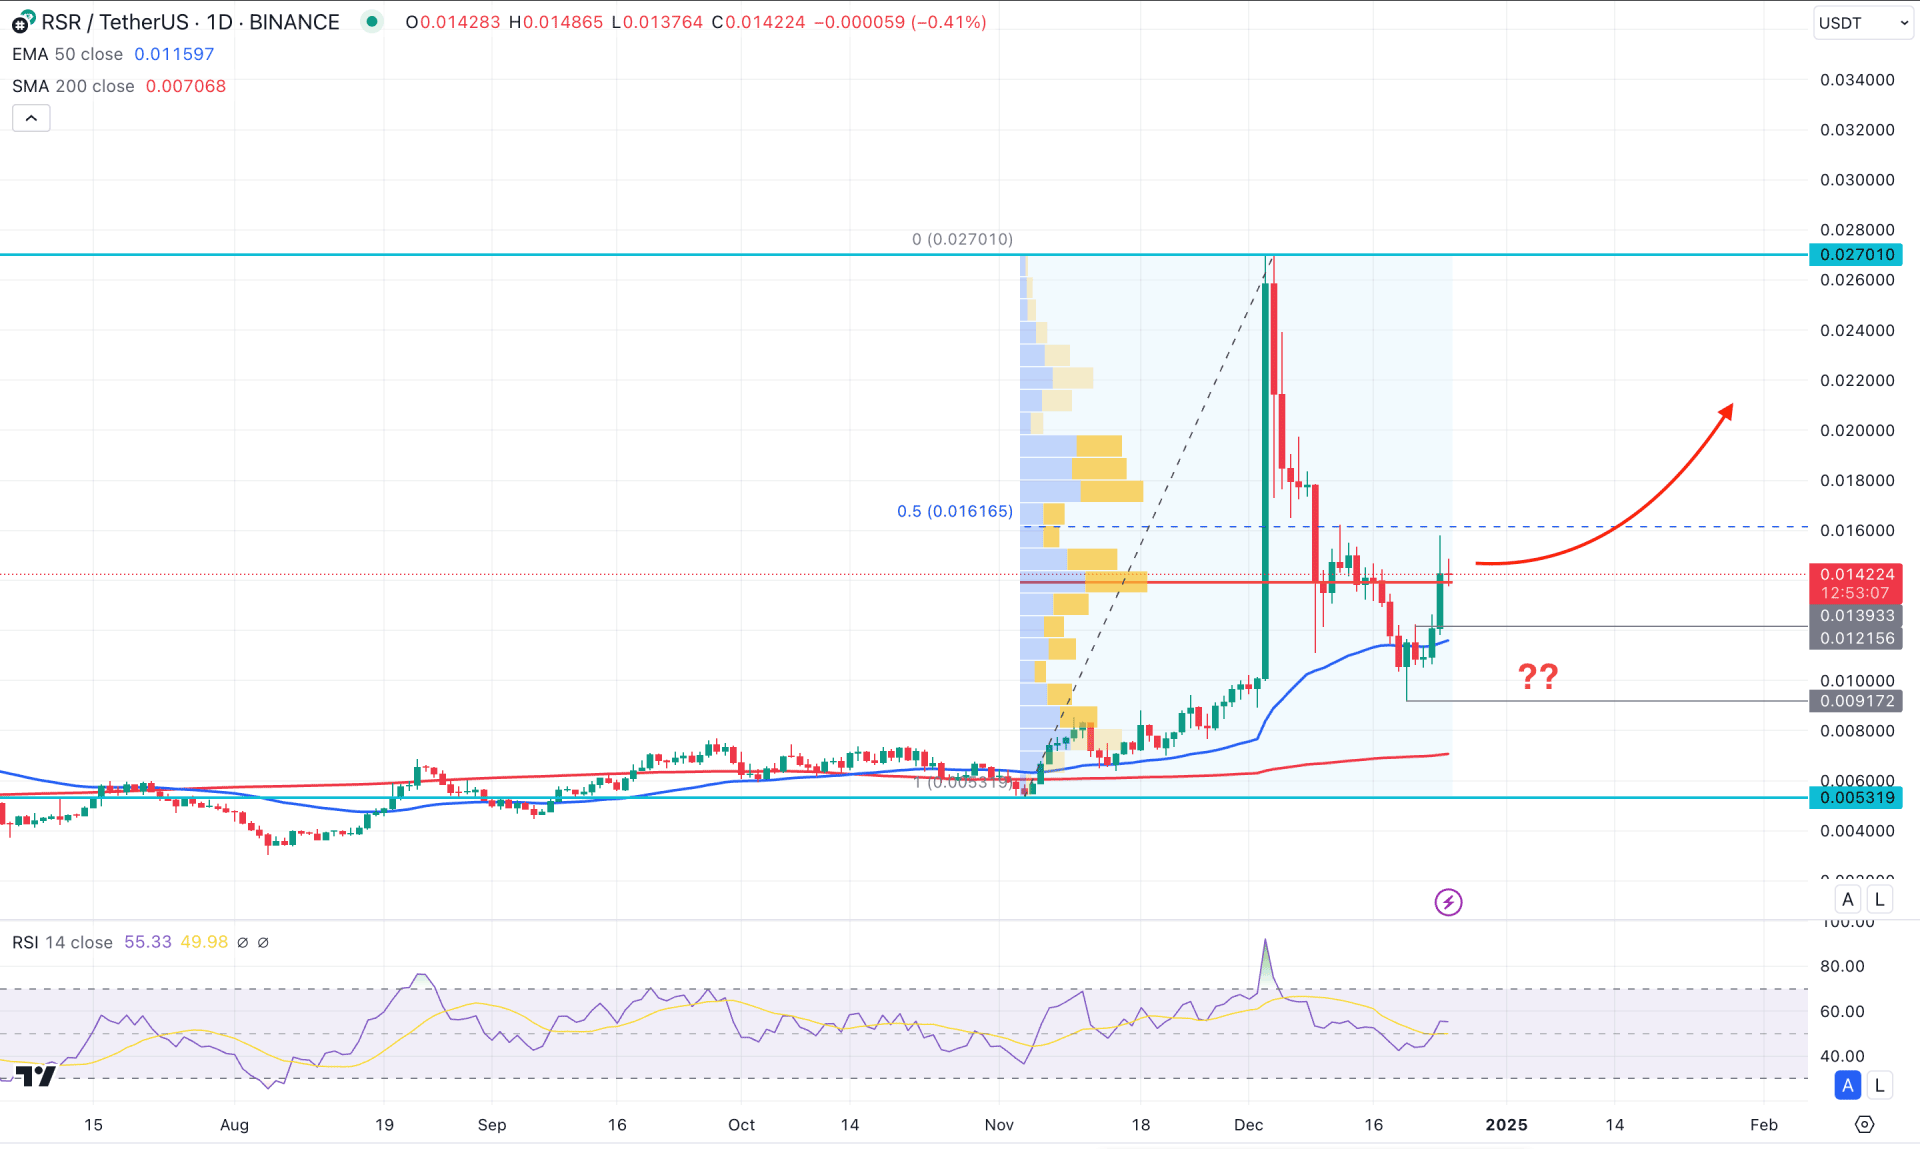
In the daily chart of RSR/USDT, the recent price showed impulsive bullish pressure, creating a potential market reversal. After forming a solid top, the price kept falling to the discounted zone, from which a bullish continuation is possible.
Looking at the structure, the 50% Fibonacci Retracement level from the 0.0270 high to 0.0053 low is at the 0.0161 level, which is above the current price. As long as the price trades below this 0.0161 level, we may find a bullish reversal at any time.
In the higher timeframe, the ongoing market momentum is bullish in the monthly chart, as the current price is hovering at the multi-month high. Moreover, the buying pressure is supported by the existing bullish monthly close, which might work as a confluence buying factor.
In the volume structure, the latest high-volume line since November 2024 is in line with the current price. In that case, a potential bullish reversal from the high volume line might resume the existing bullish trend.
In the main price chart, the 200-day Simple Moving Average is below the current price, working as a major support level. The primary anticipation for this pair is to open long trades as long as the 200-day SMA is protected. Moreover, the 50-day EMA is also below the current price, working as an immediate support.
Based on the current market outlook, the bullish rebound in the RSI with support from the 50-day EMA could offer a long opportunity, aiming for the 0.0200 level. Moreover, overcoming the 0.0161 level could boost the buying pressure, aiming for the 0.0240 level.
On the bearish side, the current selling pressure from the high volume line could be a challenging factor for this pair. In that case, more bearish pressure might come after having a valid daily candle below the 0.0100 psychological line.

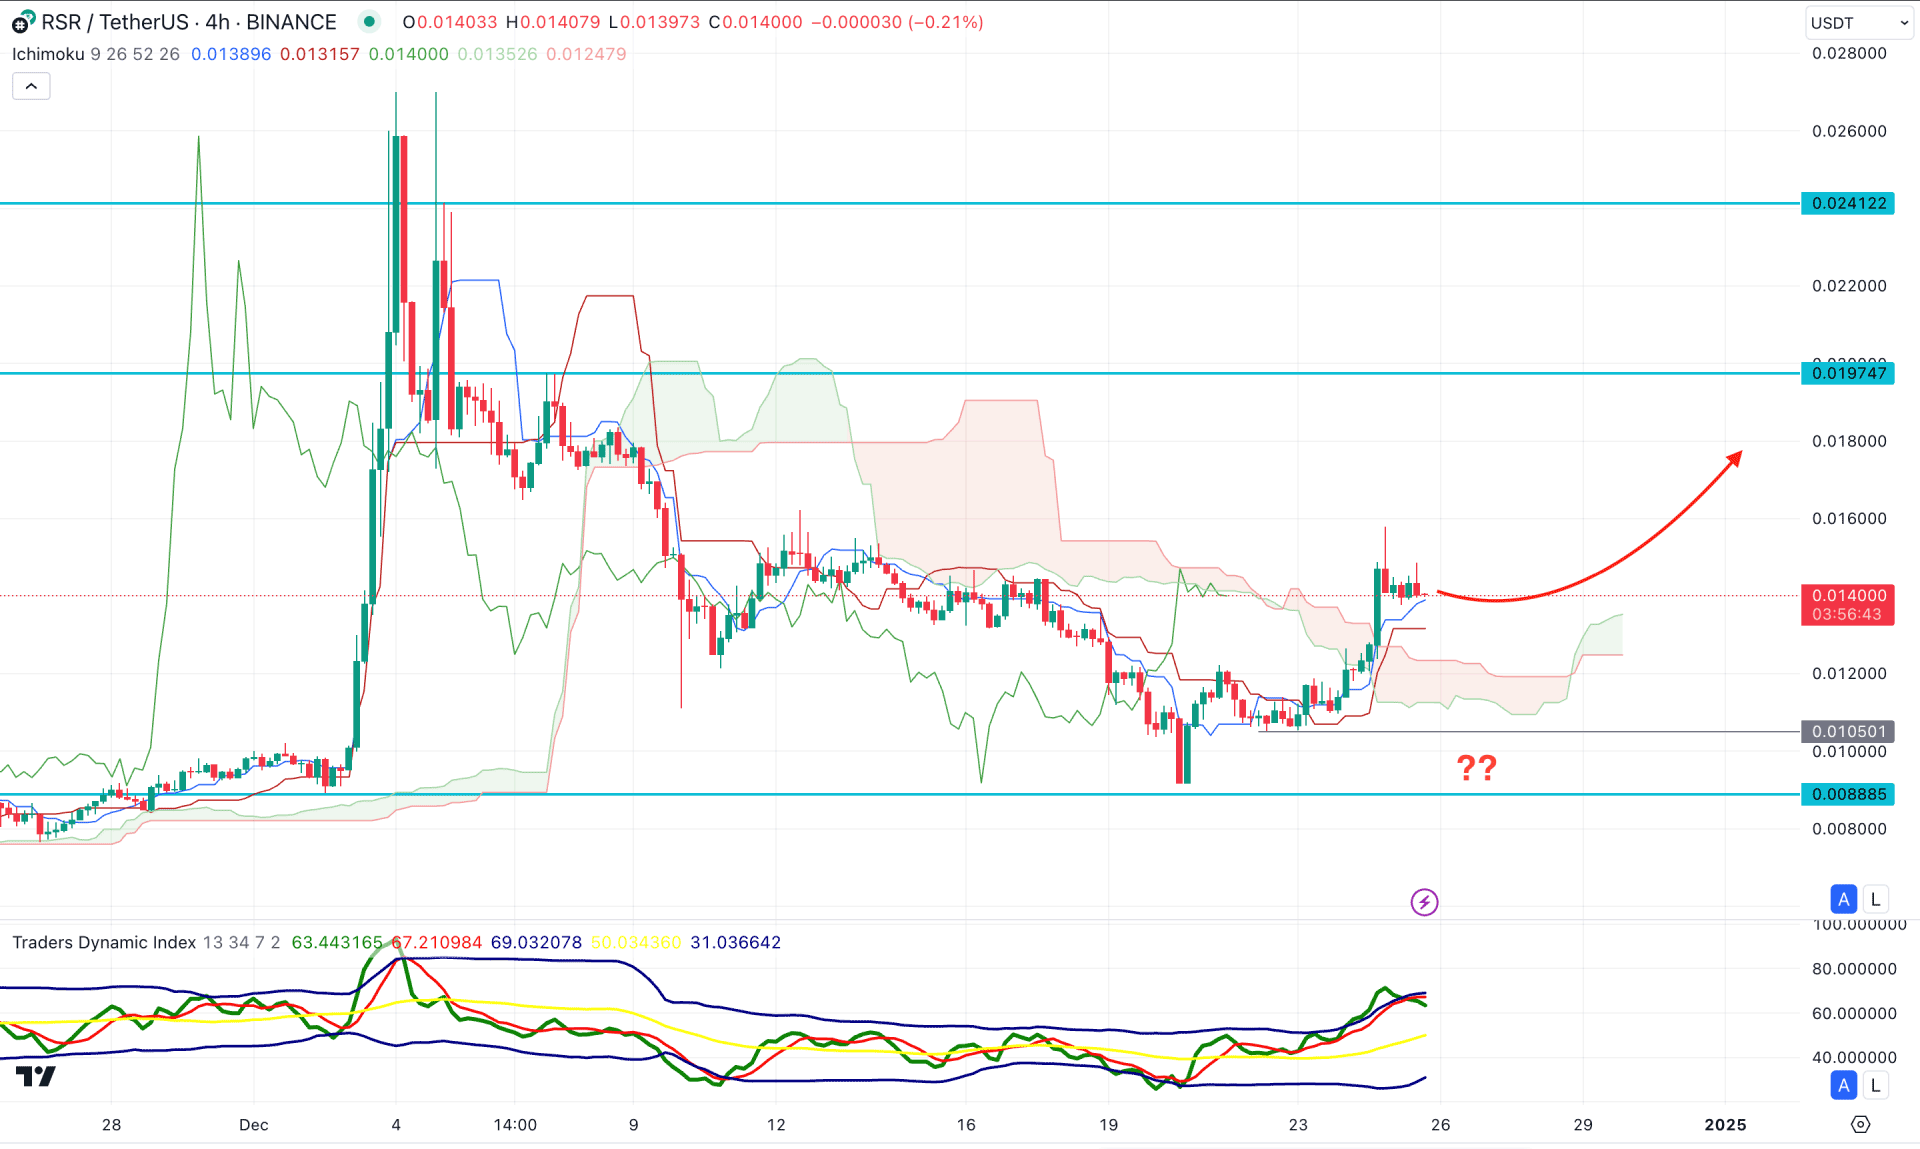
In the H4 timeframe, the recent price showed a bullish reversal above the Ichimoku Kumo Cloud, which has appeared after three weeks bearish trend.
Moreover, the Future Cloud looks positive to bulls as the current Senkou Span A is above the Senkou Span B with a bullish slope.
In the secondary window, the Traders Dynamic Index (TDI) has reached its peak, suggesting an overbought condition.
Based on this outlook, investors should closely monitor how the price trades above the Ichimoku Cloud zone. Any minor downside correction towards the dynamic support area coil increases the bullish pressure.
However, an immediate bearish break below the Cloud low could signal a false break, which might extend the selling pressure toward the 0.0080 level.

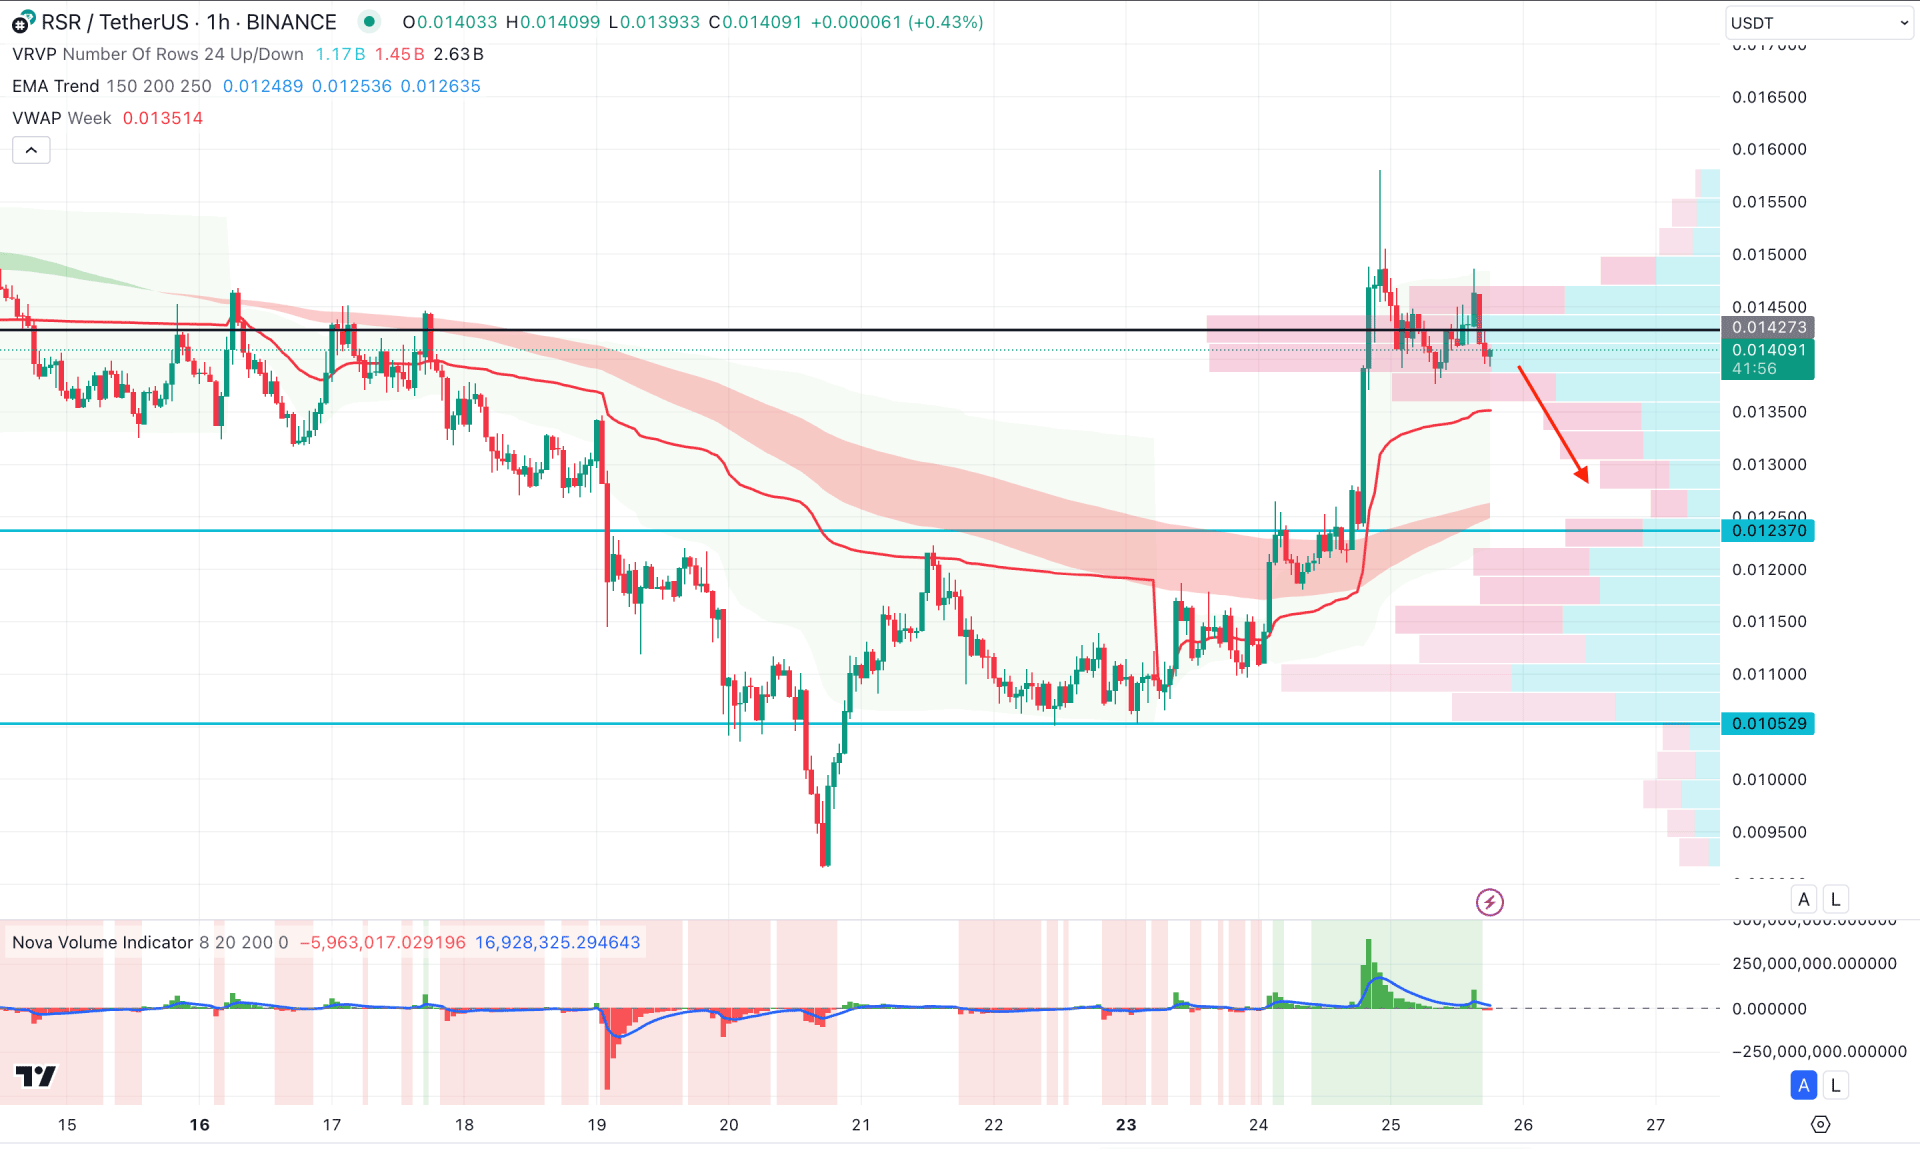
In the H1 timeframe, the recent price showed a bearish pressure from the high volume line, signalling a potential downside recovery. However, the weekly VWAP line is still below the current price, working as a support. In this indecisive scenario, investors should wait for a valid breakout before anticipating a stable trend.
In the indicator window, the Volume Histogram suggests a weaker buying pressure as the current line is just above the neutral point after a bullish peak.
Based on this outlook, an immediate selling pressure might extend and find support from the MA wave area. However, extending the downside pressure below the 0.0123 support level might fail to grab buyers' attention and extend the loss toward the 0.0105 level.
Based on the current market outlook, an immediate bullish rebound is pending before forming a bull run. The primary anticipation is to wait to overcome the high volume line, which might initiate the long wave towards the existing swing high.