
Published: March 16th, 2020
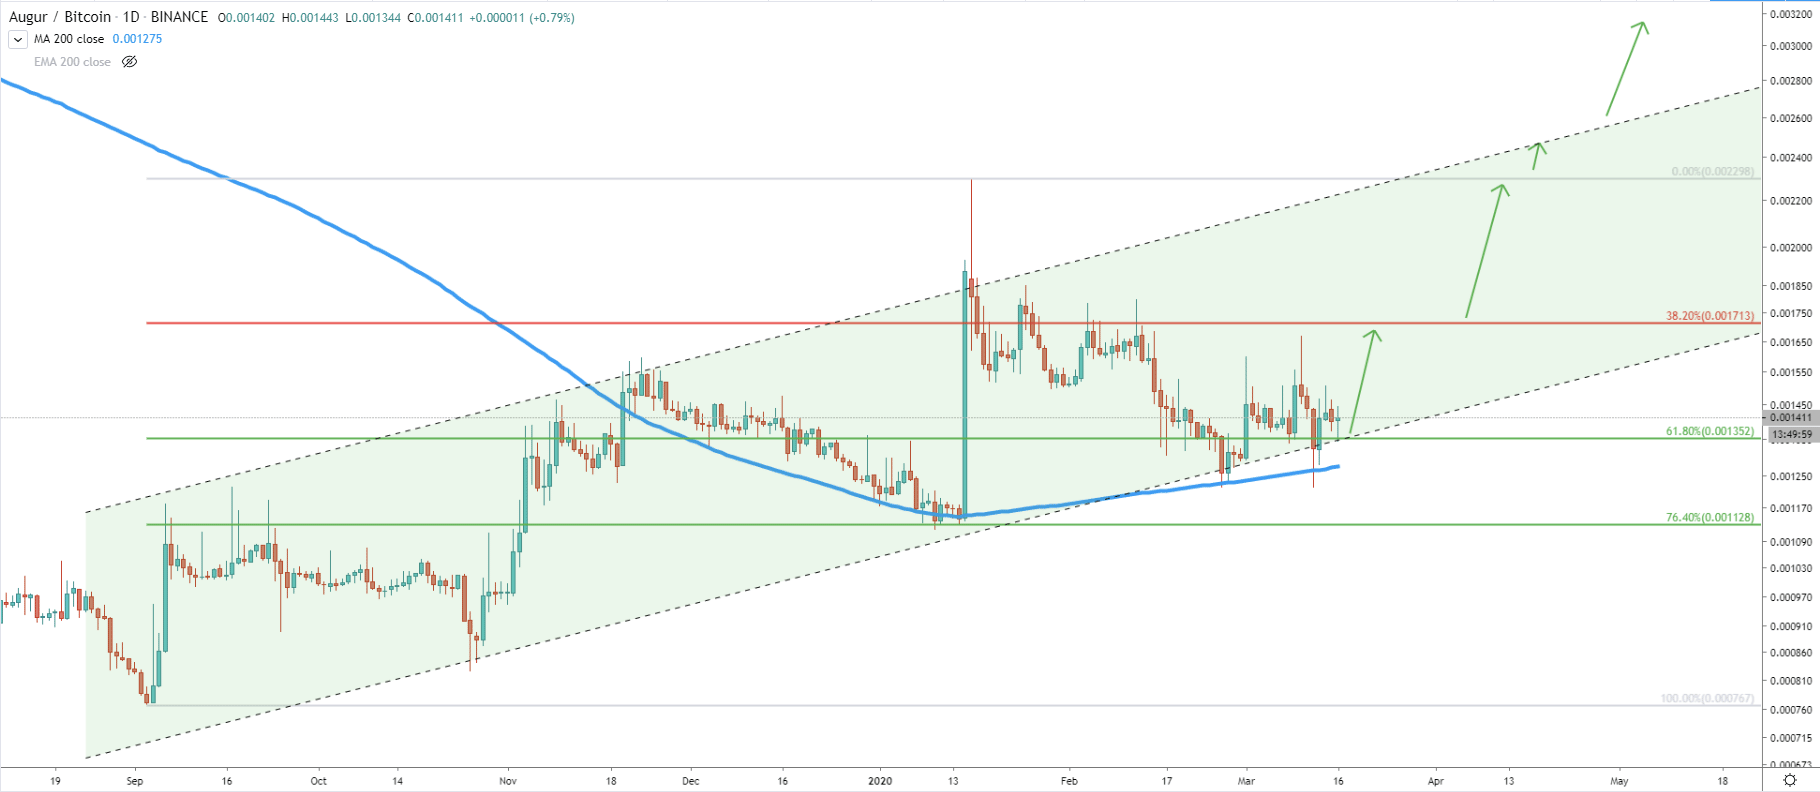
Augur remains one of the few coins that remain in an uptrend against the Bitcoin. Since September 2019 REP/BTC is trending up and so far this rise resulting in a 79% growth. Price went up from 0.000767 btc low, up to 0.002300 high. All-in-all, the price remains within the descending channel and at the same time above the 200 Exponential Moving Average. What is important to note, is that recently REP bounced off the 200 EMA, where if found the support by producing a double bottom. Currently, Augur is trading at 0.001375 btc level, prior to which price rejected the 61.8% Fibonacci support level at 0.001350 btc.
This short term consolidation phase could trigger yet another wave up, which might be much stronger than previous ones. Yet, the price must remains above the recently printed double bottom at 0.00122 btc.
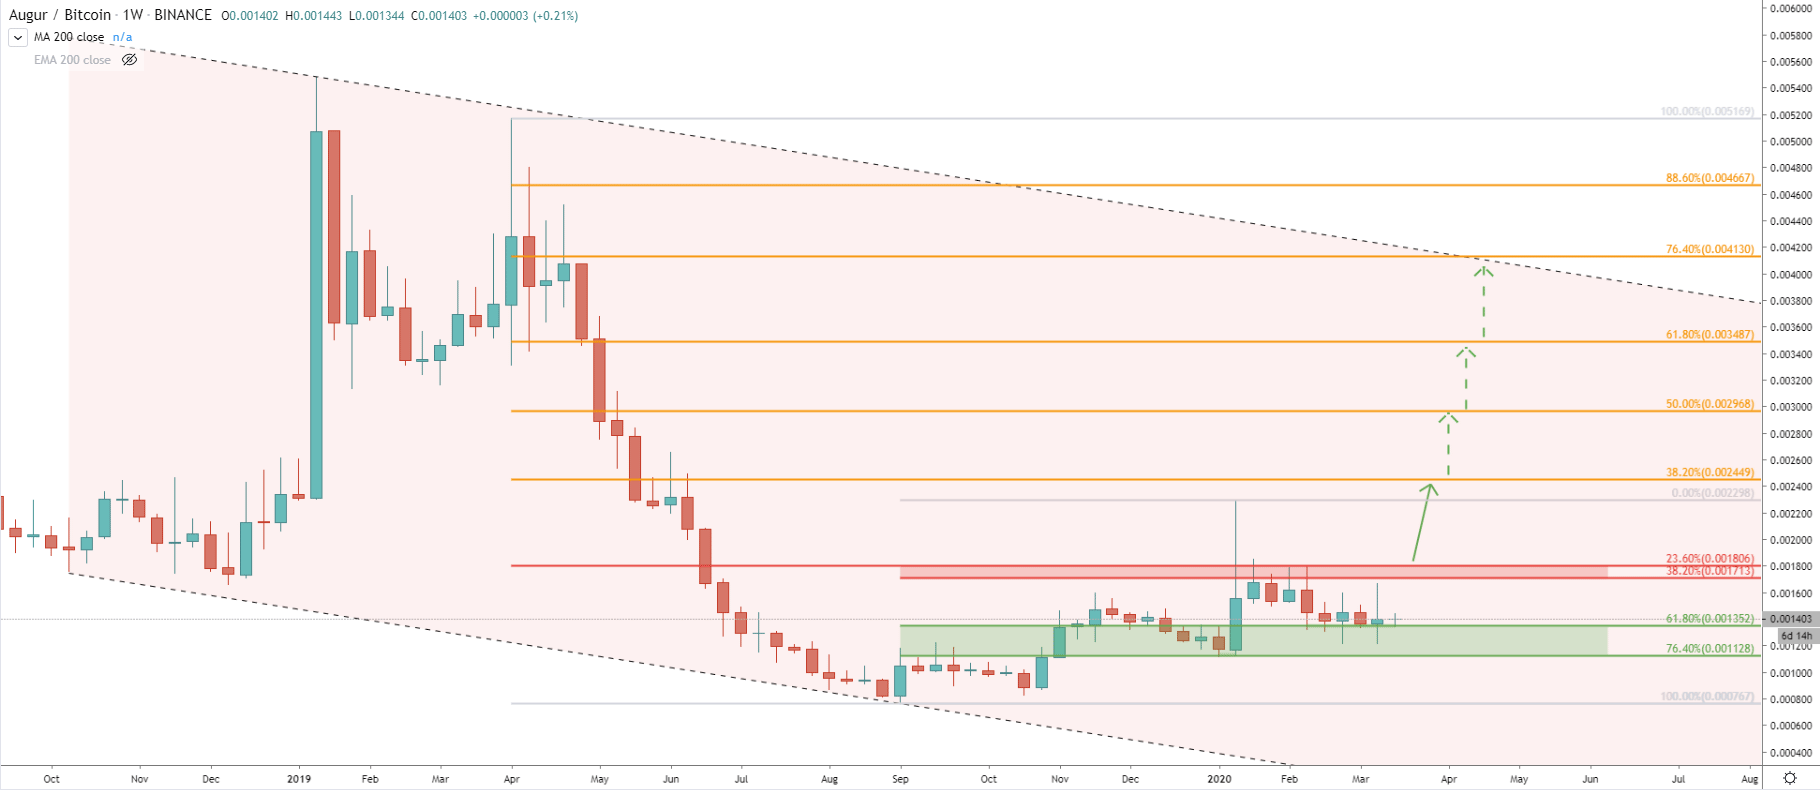
On a weekly chart, we can see a huge descending channel, where the upper trendline could be the end of the potentially incoming rally to the upside. If the previously mentioned support will hold, REP/BTC could rise as high as 0.00413. This would result in a 200% growth against the Bitcoin over the medium to long term.
Nevertheless, there is a strong resistance formed between 0.0017 - 0.0018 btc, and for now, this is the key resistance. In the short term, Aurug can be expected to move higher and should reach the 0.0017 btc resistance. Although to confirm the validity of a long term uptrend it must break and close above 0.0018 btc on a daily timeframe. Only such price action might trigger a strong impulsive wave up, towards 0.004 area.
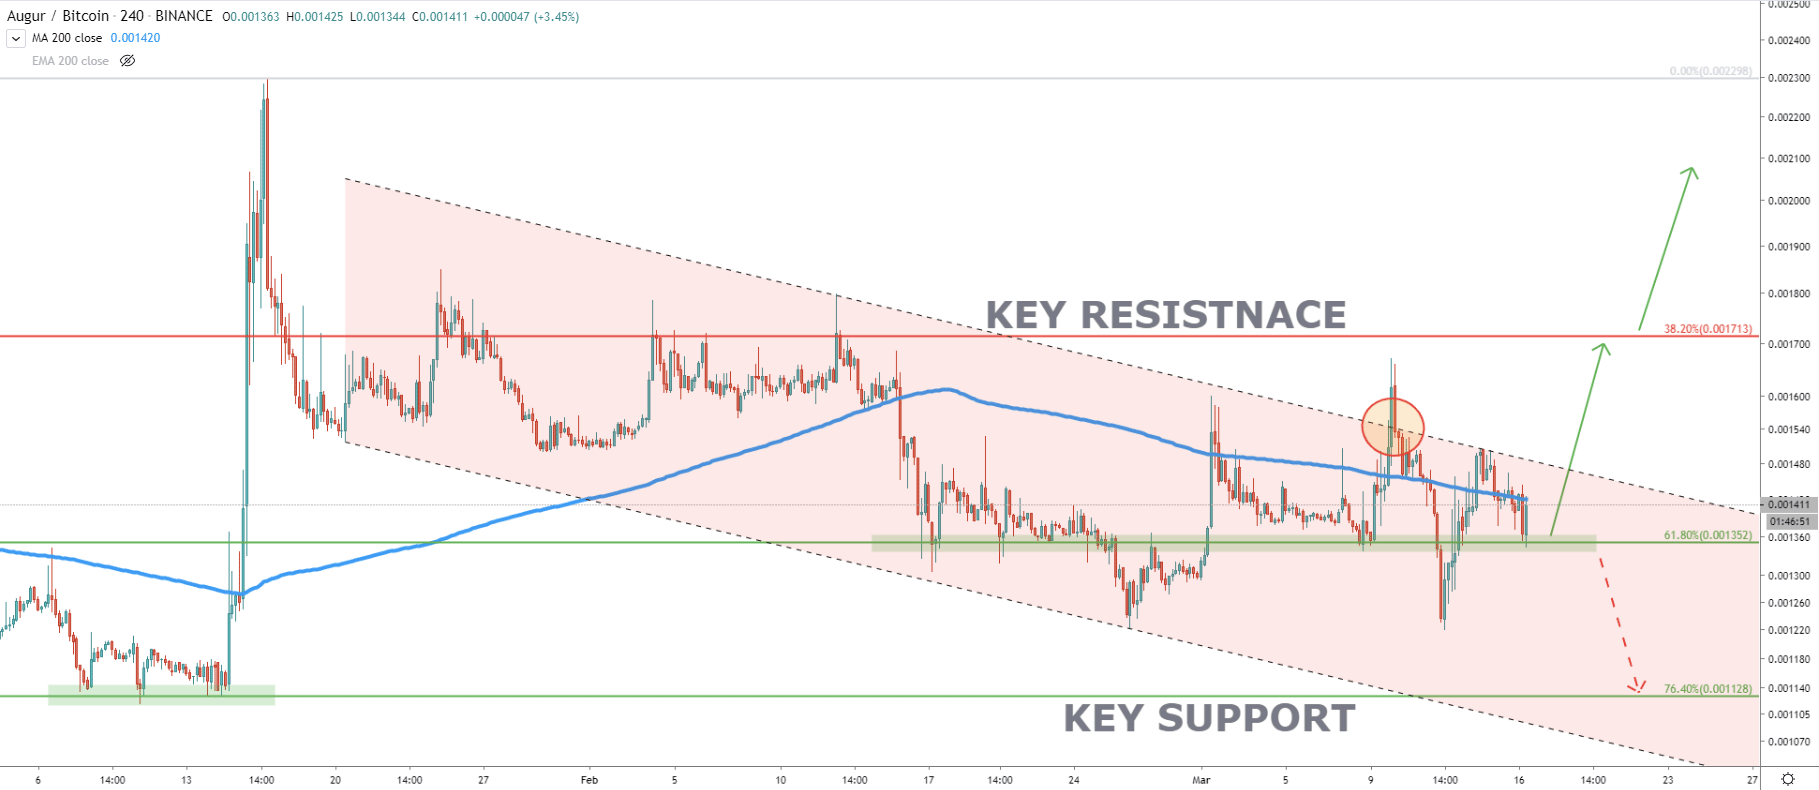
Above, on a 4H chart, price is within the descending channel. Although there was a break and close above the upper trendline as well as a double break above the 200 EMA. It looks like price continues to range before the next big move. And based on all the facts mentioned, it is likely to move north.
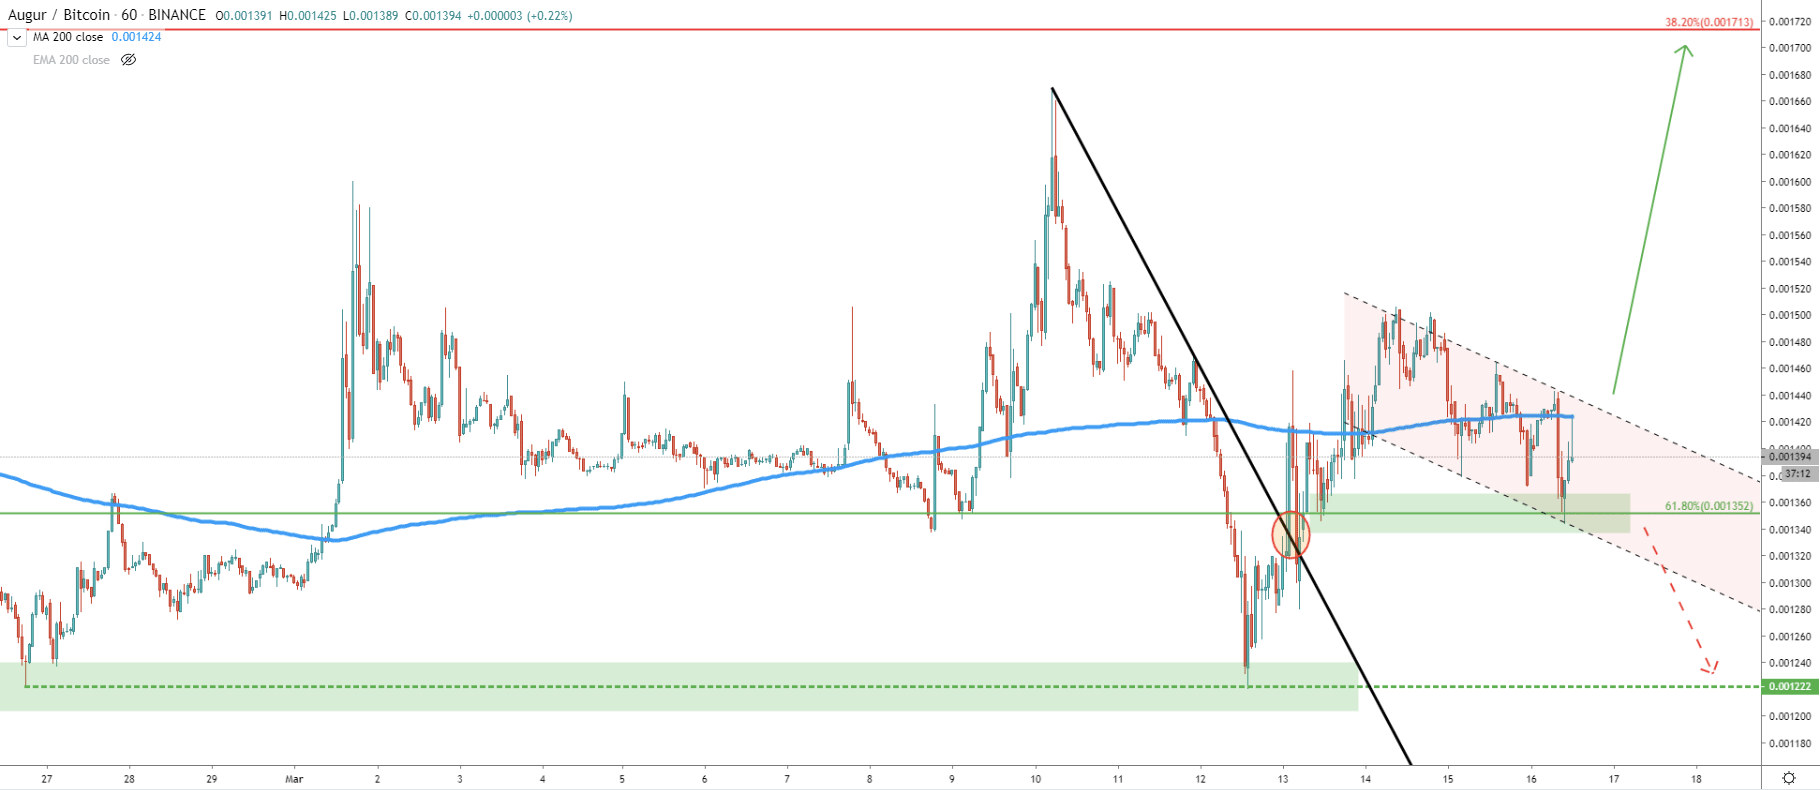
The smallest timeframe we are going to observe is a 1H chart. Here price broke above the downtrend trendline and found the support at 61.8% Fibonacci retracement level at 0.00135 btc. This looks like an are of demand for REP, and if price manages to hold this area, then rally towards 0.0017 is inevitable. Perhaps what we see now, is a formation of a bullish flag, and therefore, break and close above the upper trendline of the descending channel could be the confirmation of the incoming rally.
Augur is clearly trending up, while the price continues to produce higher highs and higher lows. Curently, the price has corrected by 40% and this can be a good entry point for the long term investors.
The key resistance area is between 0.0017-0.0018, and this is the nearest upside target for REP/BTC. If/when price manages to break above, then the next targets are 0.00245, 0.00300, 0.003500, 0.004130.
If price breaks below 0.00135 btc, which his 61.8% Fibonacci support, then the bullish outlook will be invalidated, and REP/BTC can drop down, back to the 0.00122 btc support. But an only daily break and close 0.00122 btc can result in a continuation of a long term downtrend.
Support: 0.00135, 0.00122, 0.00113
Resistance: 0.00170, 0.00180, 0.00245, 0.00300, 0.003500, 0.004130.