Published: September 10th, 2025
A ground-breaking distributed GPU rendering technology called The Render Network links GPU owners who are eager to share their computer resources with artists that require rendering capacity.
Without having to purchase expensive gear, artists can utilise high-performance graphics capabilities through this creative system, which functions like a global market for GPU computing capacity.
Since its inception, the network has expanded significantly, handling millions of frames and serving a diverse range of digital innovators in the rapidly evolving Web3 and AI landscape.
The network uses smart contracts to oversee transactions and guarantee equitable remuneration for each member.
Recent technical breakthroughs have enabled AI-assisted rendering capabilities, enhancing efficiency and unlocking new creative possibilities.
Following Nvidia's market share, RNDR has recently shown buying pressure, while the ongoing surge in AI could drive the price even higher.
Let's examine the future price direction using RNDR's technical analysis:
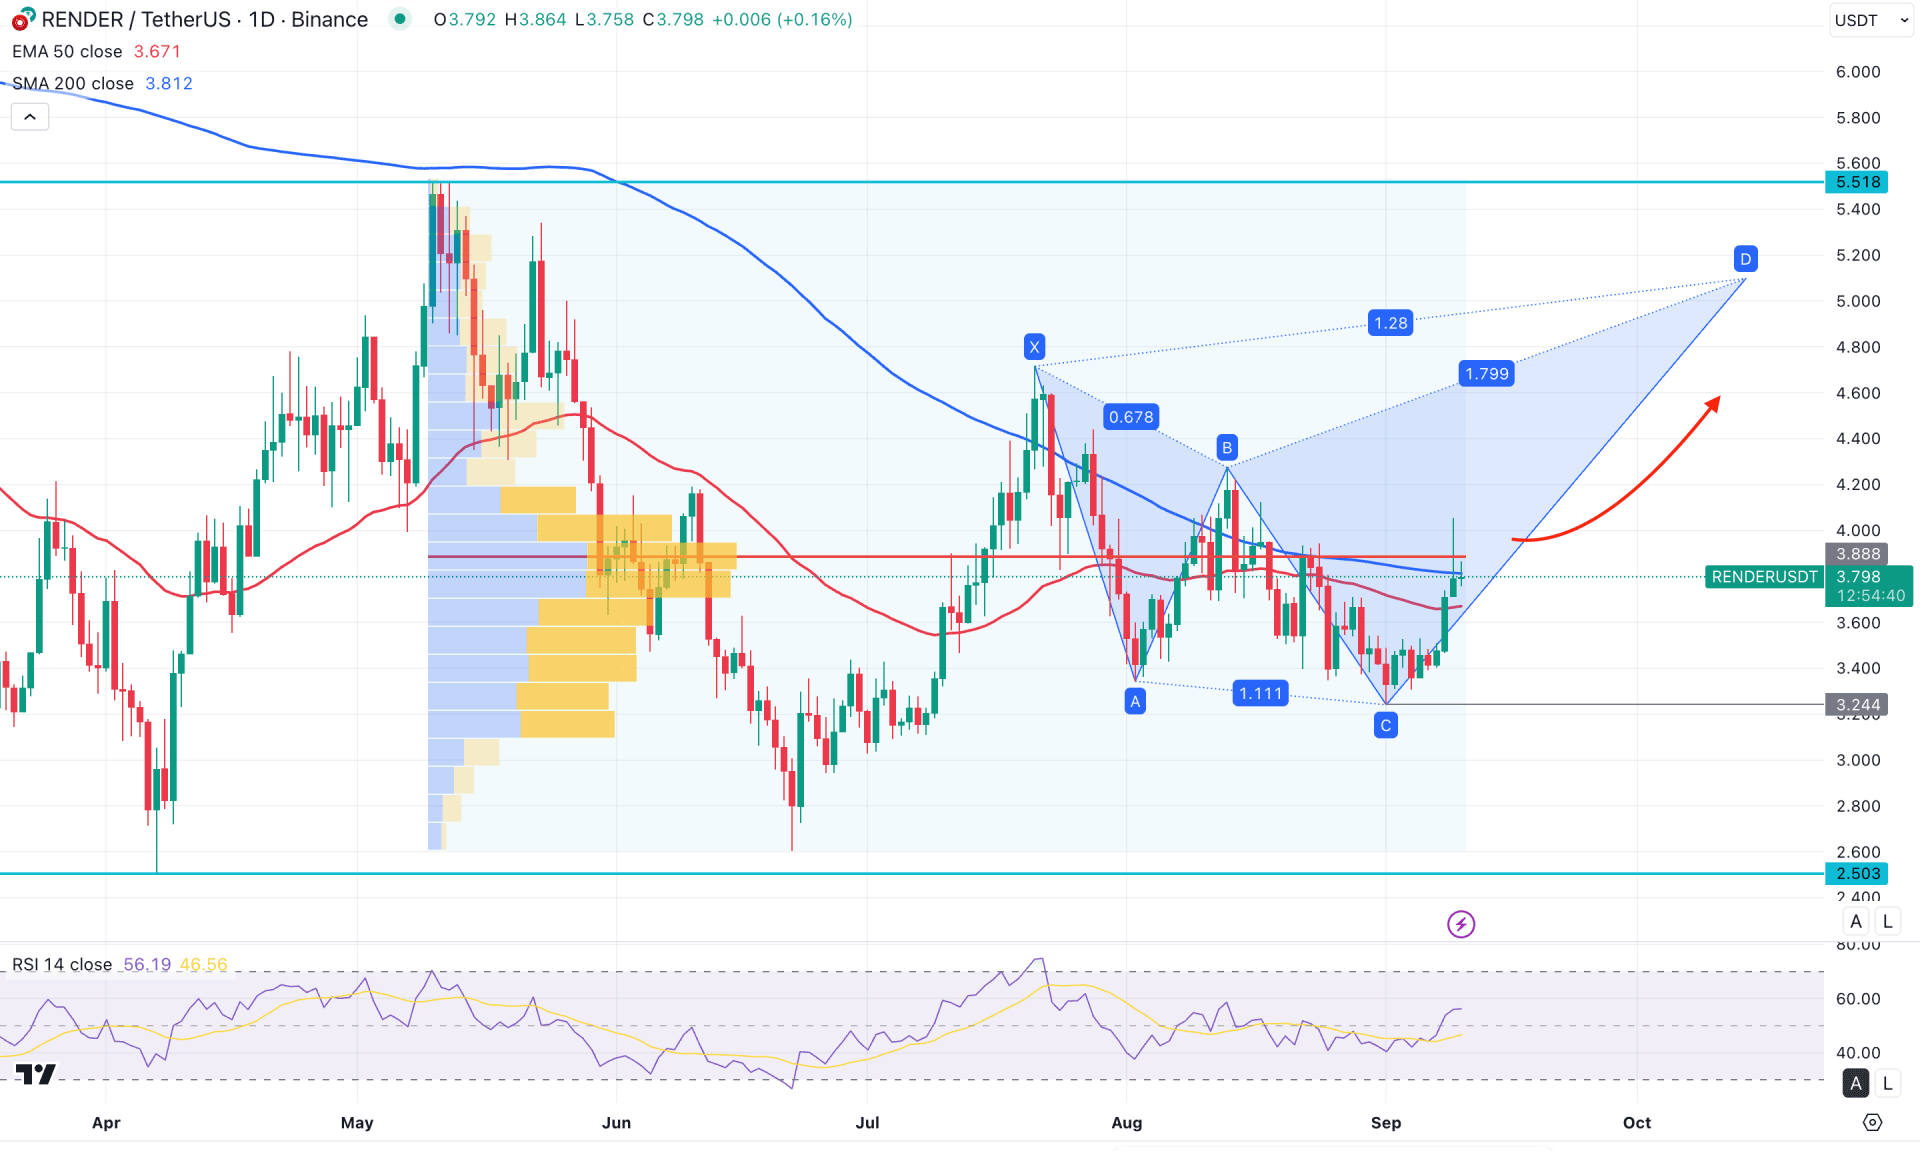
In the daily chart of RNDR/USDT, the most recent price is trading sideways in the discounted zone, where a potential bullish reversal could occur. The price is also forming a harmonic pattern, which may provide a clearer directional move.
Looking at the higher timeframe, the price has been trading sideways for seven consecutive months with no clear direction. However, the most recent monthly candle is showing bullish momentum, suggesting the possibility of a reversal. On the weekly chart, a similar structure is visible, with the price aiming higher following a doji formation at the bottom area. In this case, a simple range extension could present a long opportunity, as the next weekly resistance is located at 0.935, which is about 24% above the current price.
In terms of volume, buying pressure is still weak, as significant consolidation is present around the current price area. Furthermore, the most recent daily candle failed to close above the Williams line, signalling continued resistance. However, since the price is trading near the bottom, investors should closely monitor how it reacts around the high-volume area before anticipating the next move. A successful break above 3.888 with a daily close could open a long opportunity targeting 4.80.
On the daily chart, the 50-day EMA and 200-day SMA are acting as resistance, with the price moving between these two lines. A valid breakout above these moving averages with strong price action could provide a bullish opportunity in the coming days.
Additionally, the price is forming a butterfly harmonic pattern, which often serves as a crucial reversal setup. The most recent price action has completed the CD leg, and a breakout from this point could activate a long opportunity.
The pattern started at 4.715, with the primary bottom forming at 3.351. After that, a minor correction occurred towards 4.426 (point B) before the final validation point at 3.244.
Indicators are showing a similar story, as corrective momentum seems to be over with the RSI moving above the 50.0 level.
Based on the current market structure, a bullish outlook remains valid as long as the price holds above the 3.244 swing low. In that scenario, the primary target would be 5.099, which is the 1.272 Fibonacci extension of the BC swing. The ultimate resistance to watch is around 5.518, which could act as the final target for this bull run.
On the other hand, failure to sustain above the 50-day EMA could trigger immediate selling pressure. Still, the butterfly bullish pattern will remain valid as long as the 3.244 level holds. A decisive break below this level, followed by consolidation, could extend losses and drive the price toward the 3.000 psychological level.

Within the H4 timeframe, RNDR/USDT is trading within a bullish trend, supported by the breakout of the Falling Wedge. As the current price is hovering above the Ichimoku Kumo Cloud area, we may expect the buying pressure to continue.
In the secondary indicator window, the MACD Histogram failed to sustain the pressure above the neutral line. Moreover, the MACD Signal line hovers at the upper peak area with a potential bearish crossover formation.
Based on this outlook, a bullish momentum is solid, and the price is likely to grow after a decent bearish recovery. Investors should closely monitor how the price trades at the 3.743 static support level, as a bullish rebound could be a long opportunity.
On the other hand, the Ichimoku Kumo Cloud could be the ultimate support zone to look at. A break below this line, with a consolidation below the 3.443 line, could extend the loss at any time.

In the hourly timeframe, the RNDR/USDT price is trading bullish as the dynamic EMA wave is below the current price, with a bullish slope. Moreover, the most recent price showed a bullish reversal from the weekly VWAP line, suggesting a bullish continuation.
On the other hand, the Volume Histogram suggests a potential buying pressure as the recent vertical line has started to lose the bearish pressure.
In that case, the potential bullish continuation is valid, where an hourly candle above the current range could be a long opportunity, targeting the 4.000 level.
On the other hand, a bearish pressure below the 3.742 level with an immediate recovery could be another long signal. However, bearish pressure with a consolidation could extend the loss towards the 3.600 level.
Based on the broader market outlook, RNDR/USDT is more likely to extend the buying pressure in the coming days. As the potential Harmonic pattern is in play with an ongoing buying pressure from the intraday price, an early long opportunity is valid from the near-term support area.


