Published: June 25th, 2024
Render (RNDR), an AI-themed token that experienced a substantial price surge last week. The upward pressure is supported by on-chain metrics, where active addresses have increased by 13.37% in the past seven days.
Another positive indicator is the increase in new and zero-balance addresses. An increased number of participants initiating transactions on the network indicates a project's expansion as new addresses are added.
In contrast, a decrease in the number of new addresses indicates a need for more new entrants and a loss of momentum. In the past week, the number of new and zero-balance addresses for RNDR has increased by 3.47% and 6.75%, respectively. This surge in adoption may increase the token's price.
The In/Out of Money Around Price (IOMAP) is another pertinent indicator identifying critical buying and selling zones that may serve as support or resistance. The addresses are categorized as either breakeven or out of the money.
There are 2,760 addresses out of money, with 11.35 million RNDR valued between $7.19 and $7.40. Furthermore, 6.84 million tokens were purchased by 1,040 addresses that are in the money at a price between $6.97 and $7.18.
Another tool for finding the future price is the CMF, which differentiates between periods of accumulation and distribution. An increase in the CMF number, with downside pressure in the main price, indicates a distribution.
The CMF on the RNDR/USDT chart is -0.14, confirming the distribution. However, the more precious outlook for this stock might come from the Render technical analysis:
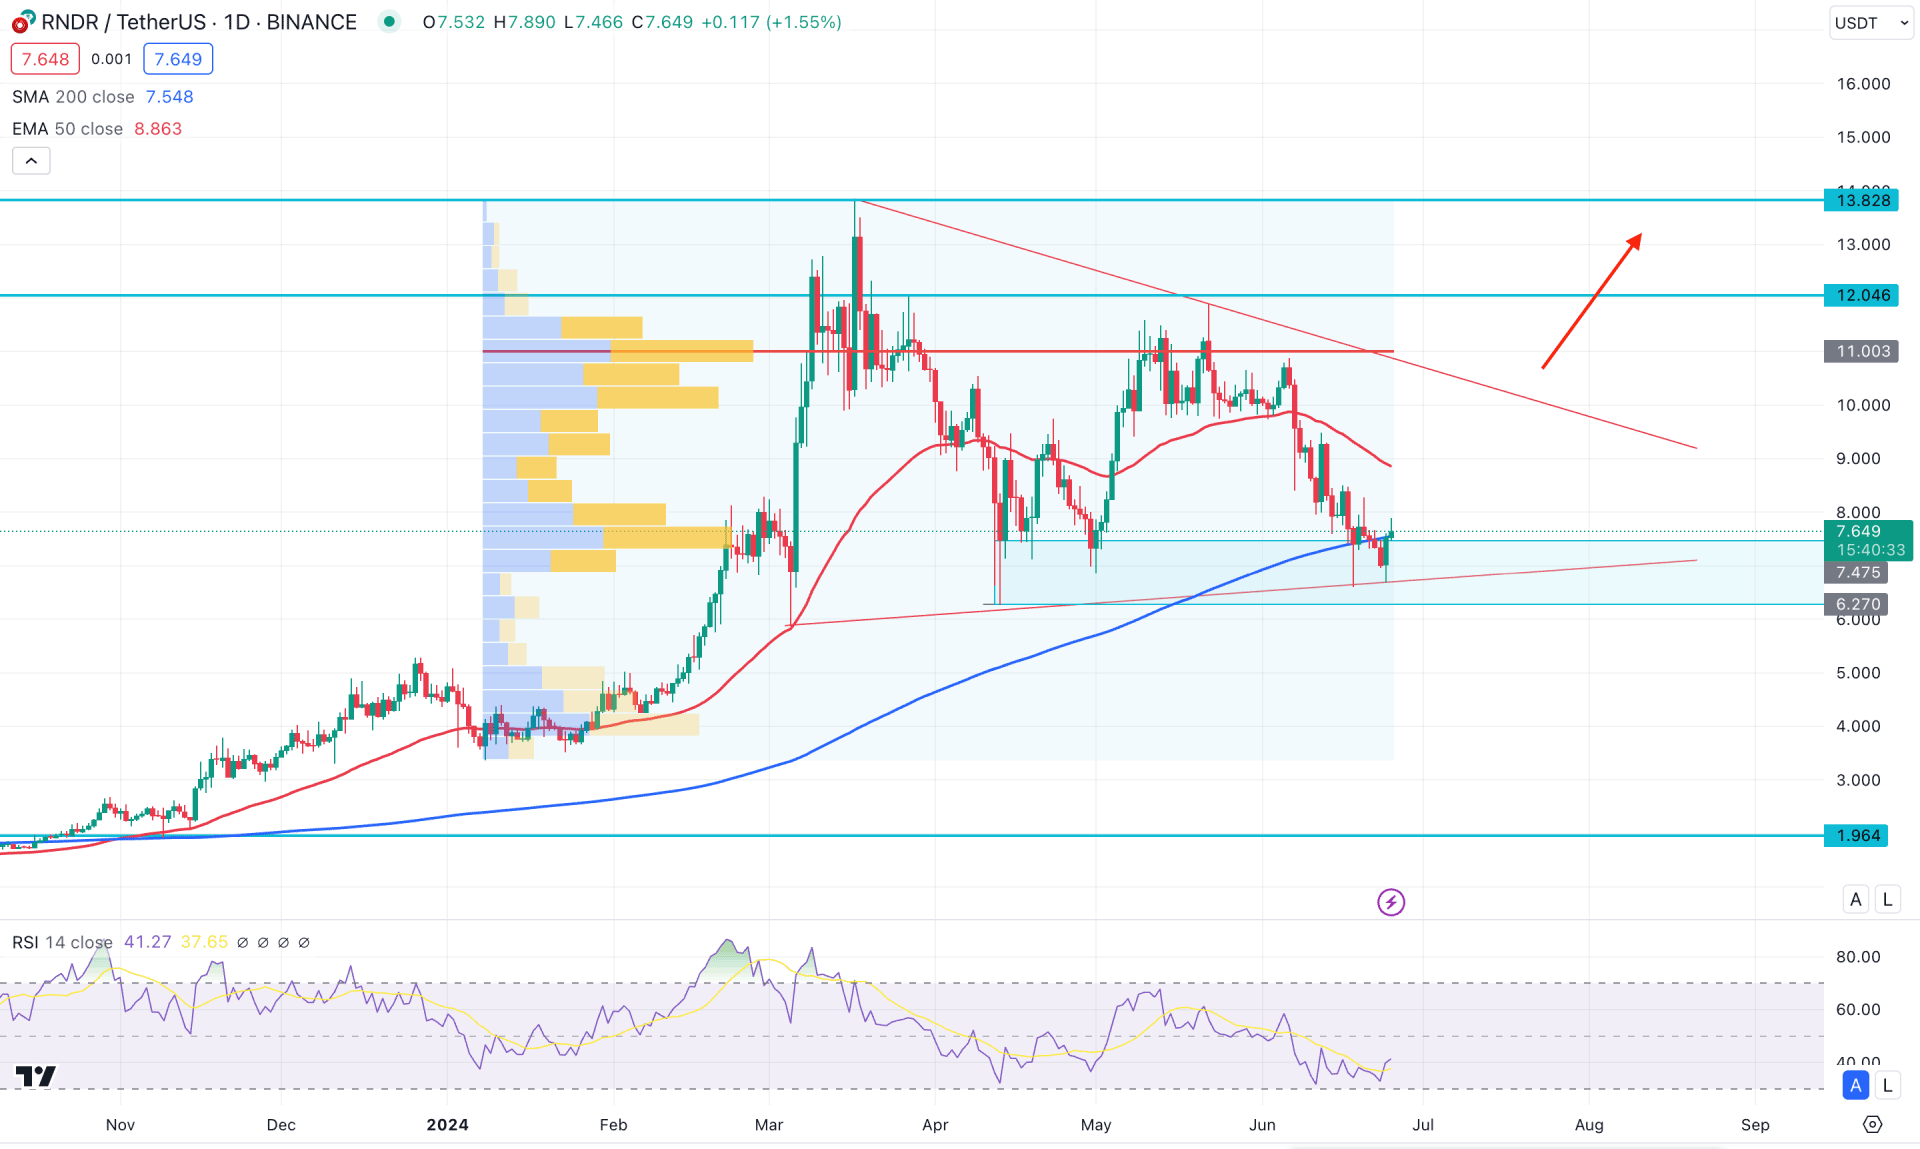
In the daily chart of RNDR/USDT, the recent price was traded as bearish, but support was found from the bullish order block. Moreover, the broader outlook is within a bullish pattern, from which a valid breakout could initiate a highly probable trend trading opportunity.
Since the top formation at the 13.828 level, the price has gone bearish below the 50-day Exponential Moving Average level. Moreover, the downside momentum is supported by the volume structure. The high volume level since March 2024 is still above the current price, suggesting active downward momentum.
In the higher timeframe, the price has been sideways for the last four months, with a running bearish candle in June. It is a sign that the current price is trading within a bullish re-accommodation phase from where the price is likely to offer a high probable long signal.
On the main chart, the current price hovers within the bullish pennant pattern, with a minor bullish recovery present from the dynamic 100-day Simple Moving Average. However, the 50-day EMA is still above the current price, which needs to be overcome before anticipating a long-term bull run.
The 14-day Relative Strength Index indicator still remains below the 50.00 neutral point, indicating active selling pressure.
Based on the daily market outlook, a bullish continuation with the daily candle above the 50-day Exponential Moving Average could resume the existing trend as a golden cross continuation. A valid break from the bullish pennant pattern could validate the long-term continuation heading toward the 15.00 psychological level.
On the bearish side, the current price is trading within a crucial order block supported by the 100-day Simple Moving Average. A move below the 100-day SMA could be challenging for bulls, and in that case, the price might come down towards the 1.96 level.
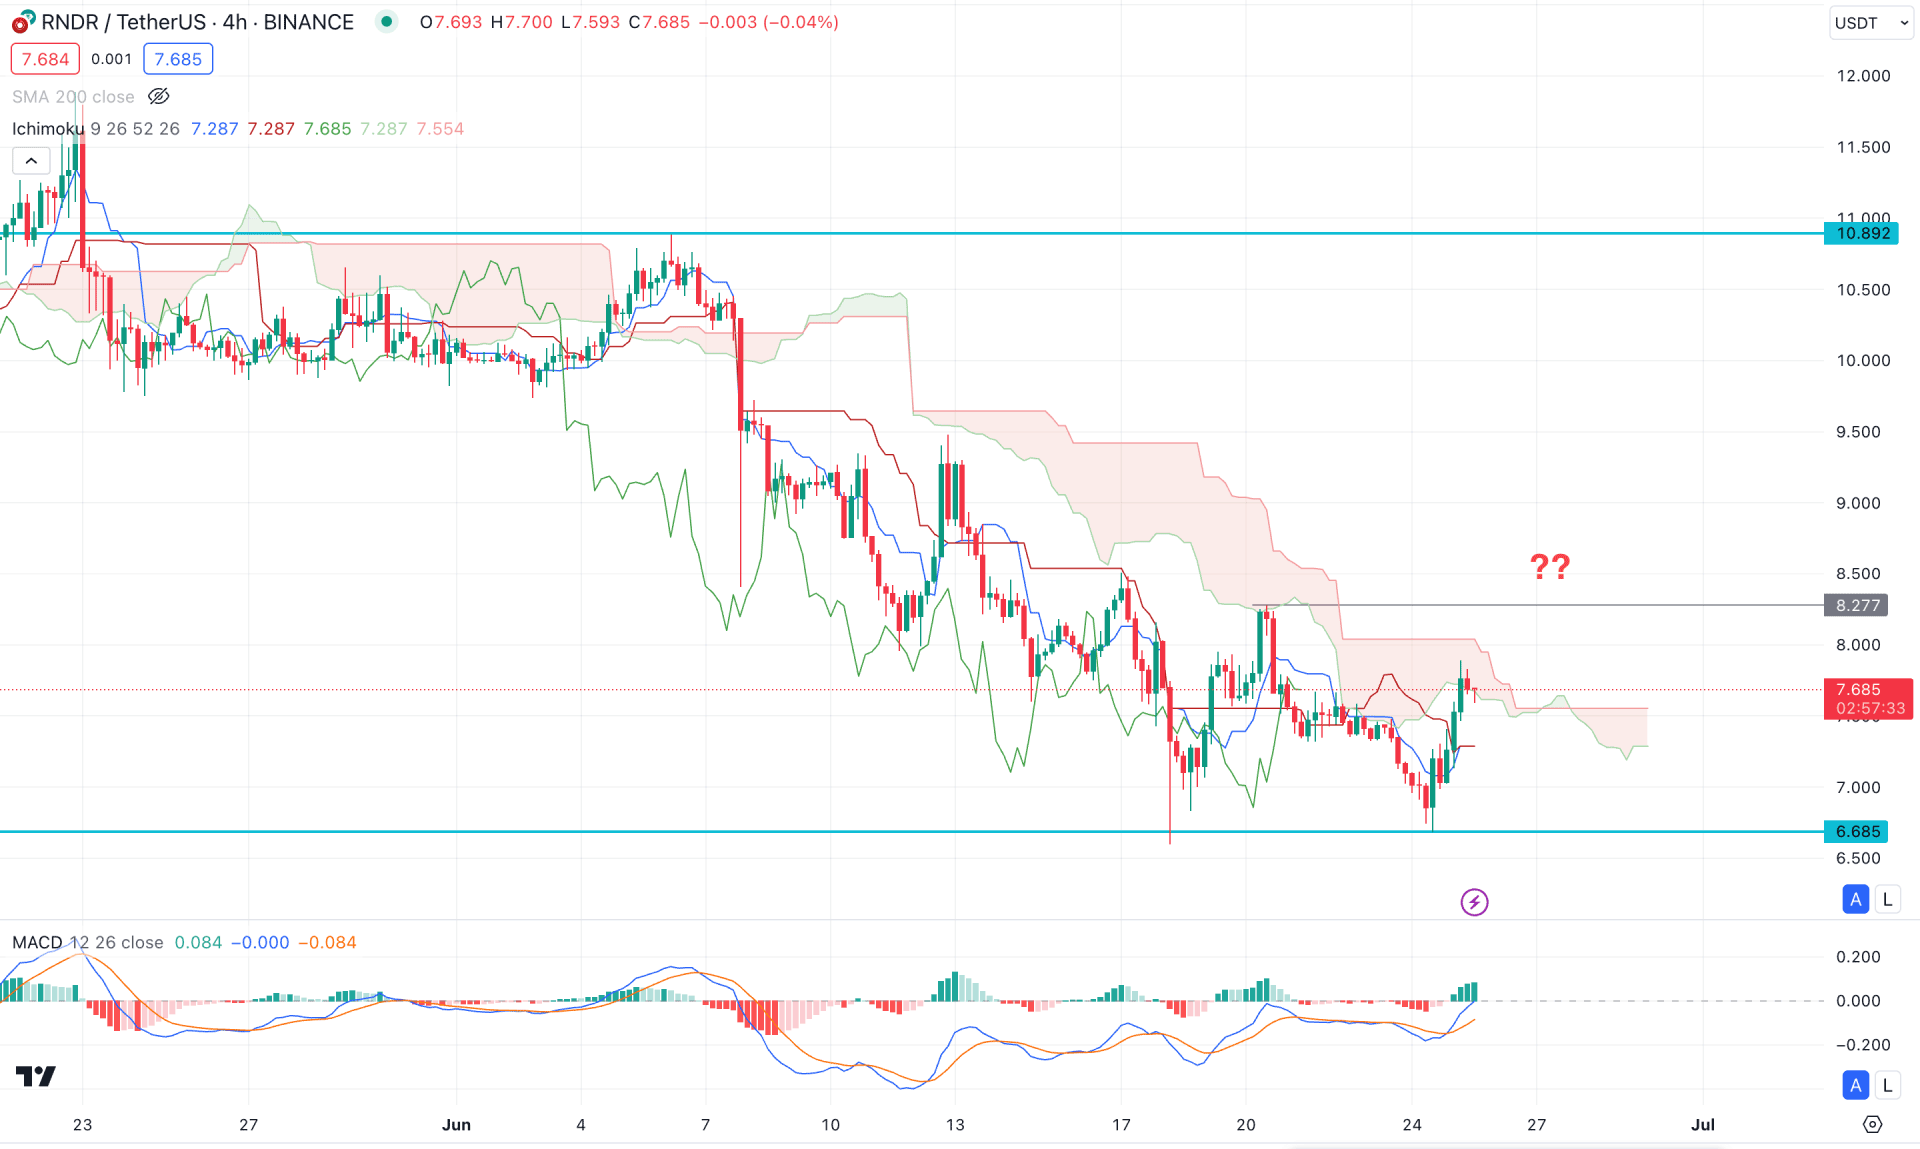
According to the 4-hour chart analysis, the current price is trading sideways below the Ichimoku Cloud zone. In the future cloud, the Senkou Span B remains flat, suggesting neutral activity from medium-term traders. However, the recent price shows a decent bullish recovery above the dynamic Kijun Sen line and reached the cloud area.
The MACD Histogram provided a bullish continuation by moving above the neutral point. However, as no divergence was seen, investors should wait for a valid cloud breakout before anticipating a bullish trend.
Based on the H4 outlook, an H4 candle above The 8.277 high could increase the possibility of reaching the 13.00 level. On the other hand, any immediate recovery from the cloud area could resume the existing trend toward the 6.00 area.
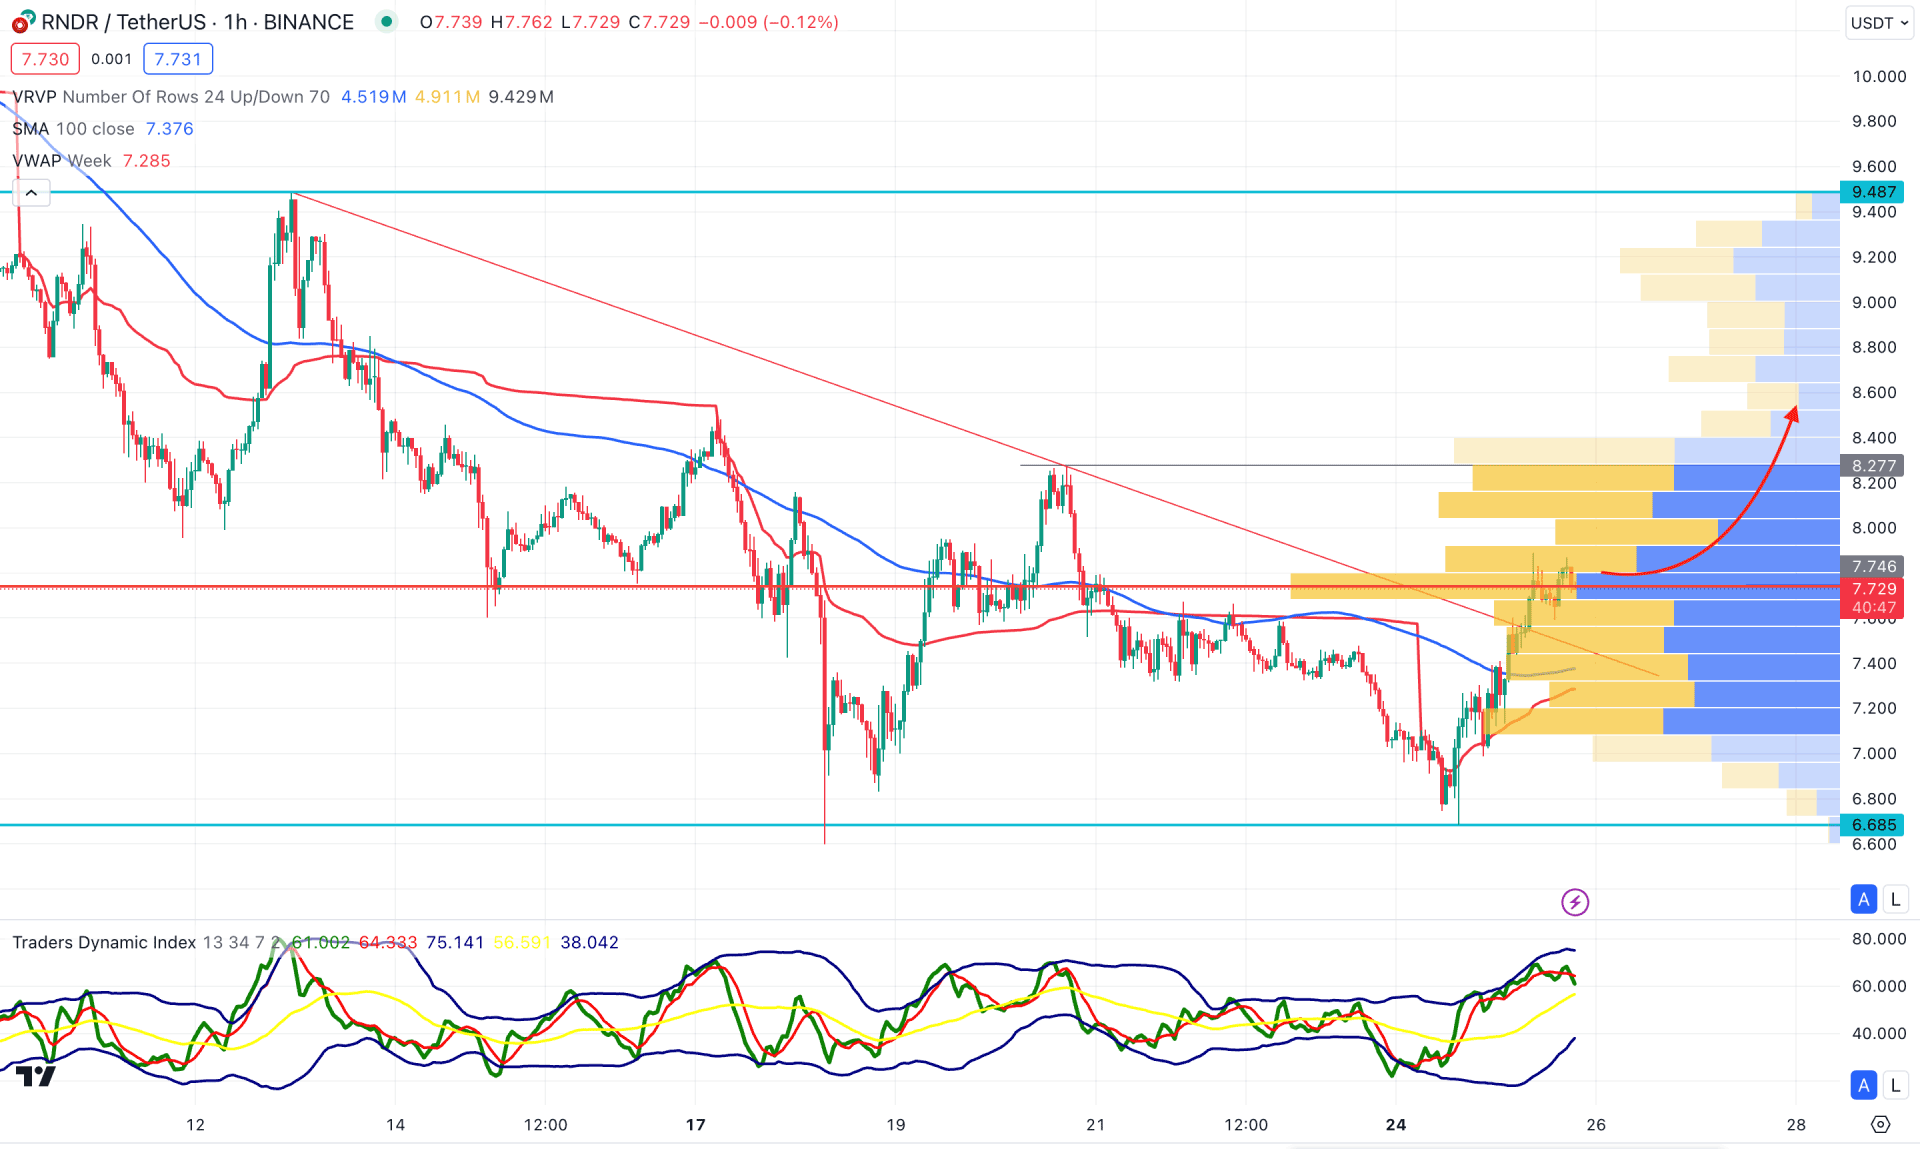
In the H1 chart, the current price trades higher from the trendline resistance, creating a minor bullish opportunity. However, the visible range high volume level is at the 7.746 level, which is at the current price area.
In the Traders Dynamic Index indicator, the current TDI level remains steady above the 50.00 neutral level, suggesting ongoing buying pressure. Moreover, the dynamic 100 SMA is below the current price, which aligns with the weekly VWAP, suggesting a bullish continuation.
Based on this outlook, a conservative buying approach might come after overcoming the 8.277 resistance level. In that case, the bullish trend might extend towards the 9.487 resistance level. However, the failure to hold the price above the current trendline could be a bearish factor, targeting the 6.685 level.
Based on the current multi-timeframe analysis, RNDR/USDT is more likely to extend the buying pressure after having a bullish pennant pattern in the daily chart. Moreover, the intraday price already showed a buying pressure, which might create an early long opportunity before validating the long-term bull run.


