
Published: September 8th, 2022
The Quant operating system, Overledger, grabbed users' attention recently as the price gained 12% from the recent swing low. Moreover, the last 24 hours' trading volume was changed by 9.47% to $27,964,163. The overall market cap of this token is $1,186,794,649, and the max supply is 14,612,493.
Since the launch, Quant has become a strong option to connect blockchains and networks globally by keeping the efficiency unchanged. It is the first project to solve the interoperability problem through blockchains that came through creating the first ever blockchain operating system.
The Overledger was created to make a connection between different blockchains through the Overledger network, which Quant bills as an ecosystem. Using Overledger, developers can build decentralized multi-chain apps, but they must hold a certain amount of Quant tokens (QNT).
Let’s see the future price direction of the Quant token from the QNT/USDT Technical analysis:
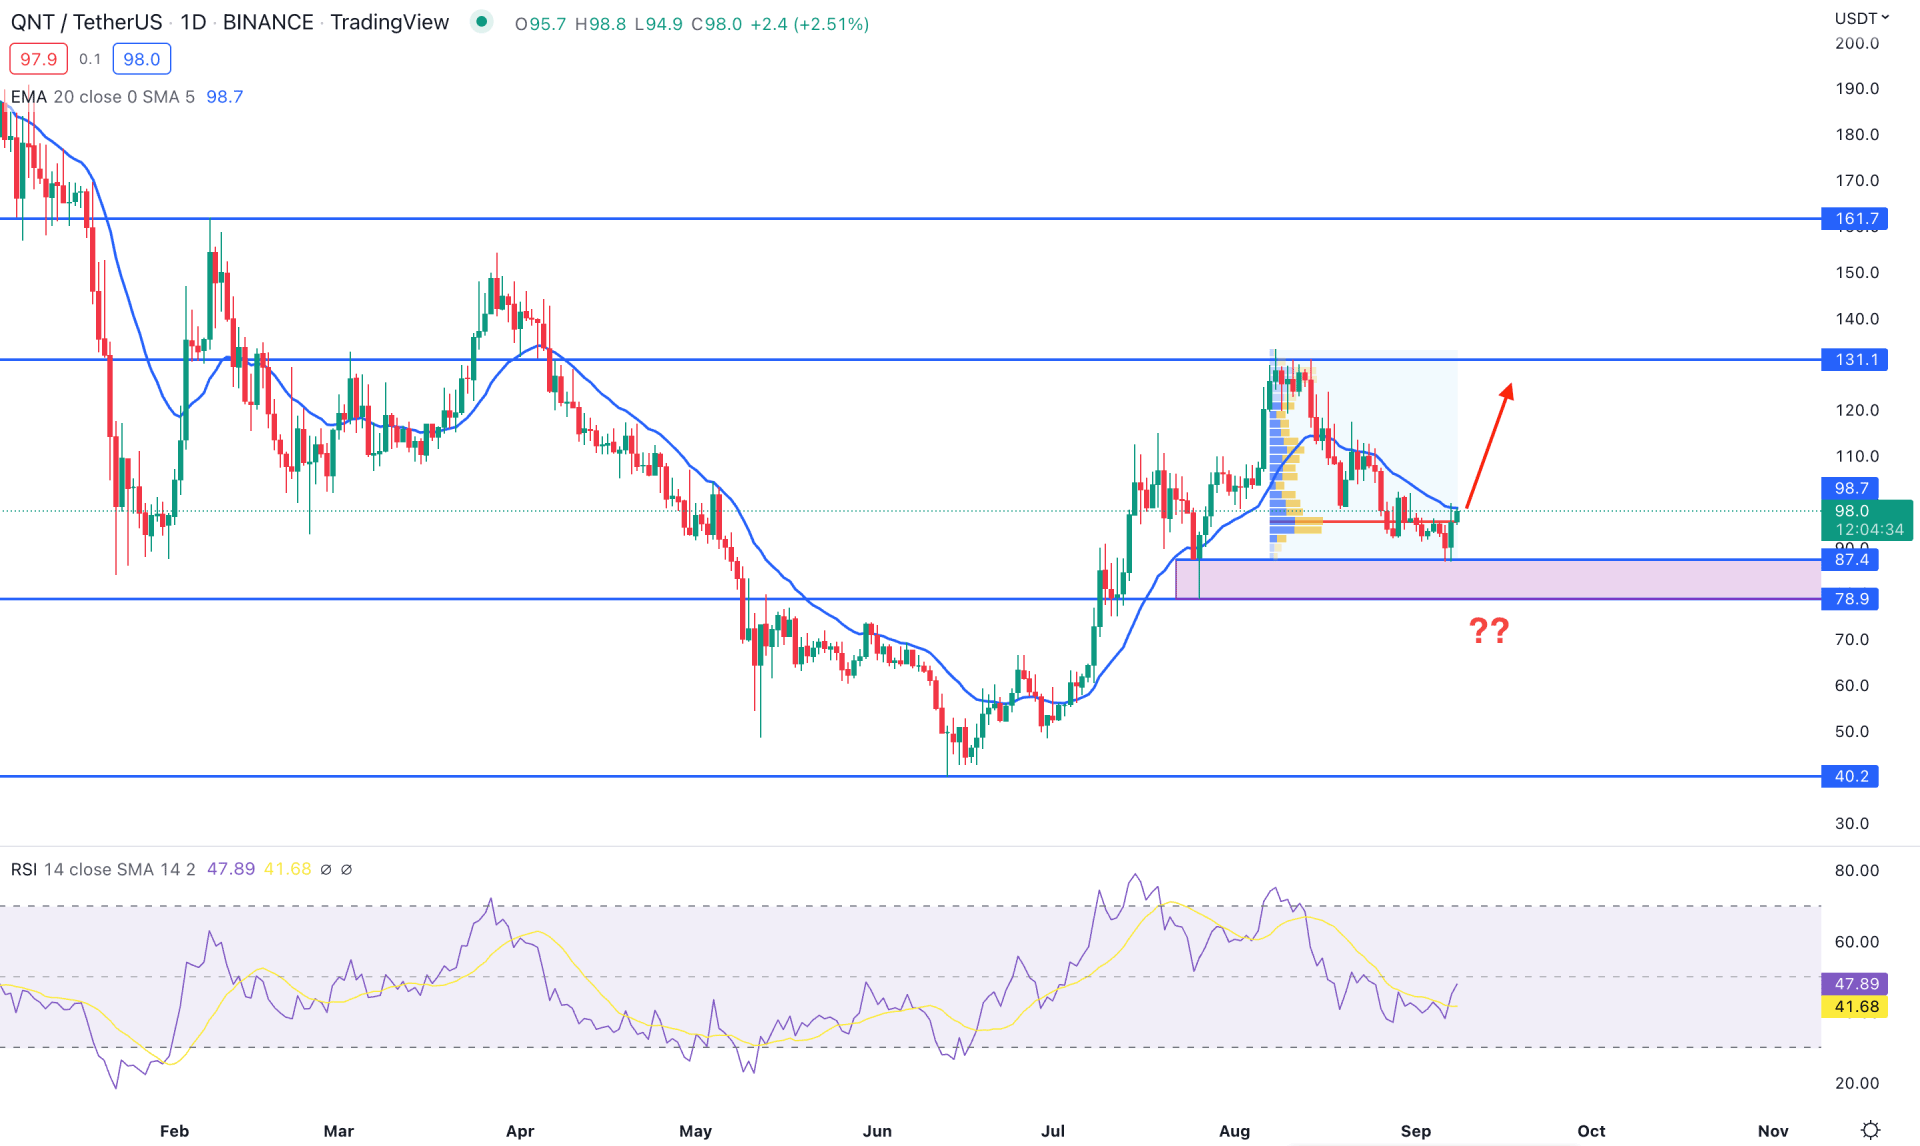
In the QNT/USDT daily chart, the current price trades within a bullish pressure where the existing demand zone of 87.40 to 78.90 is working as a bottom. Therefore, the primary trading idea of this pair is to find a bullish opportunity as long as it remains above the 78.90 support level.
Based on the volume structure, the highest trading volume from August high to September low is at 96.00 level, which is near the current price. As the current daily candle is above the high volume level, a bullish daily close might extend the buying pressure in the coming days.
The dynamic 20 Exponential Moving Average is above the current price, acting as an immediate resistance level. Moreover, the Relative Strength Index (RSI) is still below the 50% level but showed buying pressure after a correction.
Based on the daily price structure of QNT/USDT, a bullish daily candle above the dynamic 20 EMA would open a buying possibility that may increase the price towards the 131.1 level. On the other hand, if bears join the market and take the price below the 78.90 level, it may open a short opportunity toward the 40.20 support level.
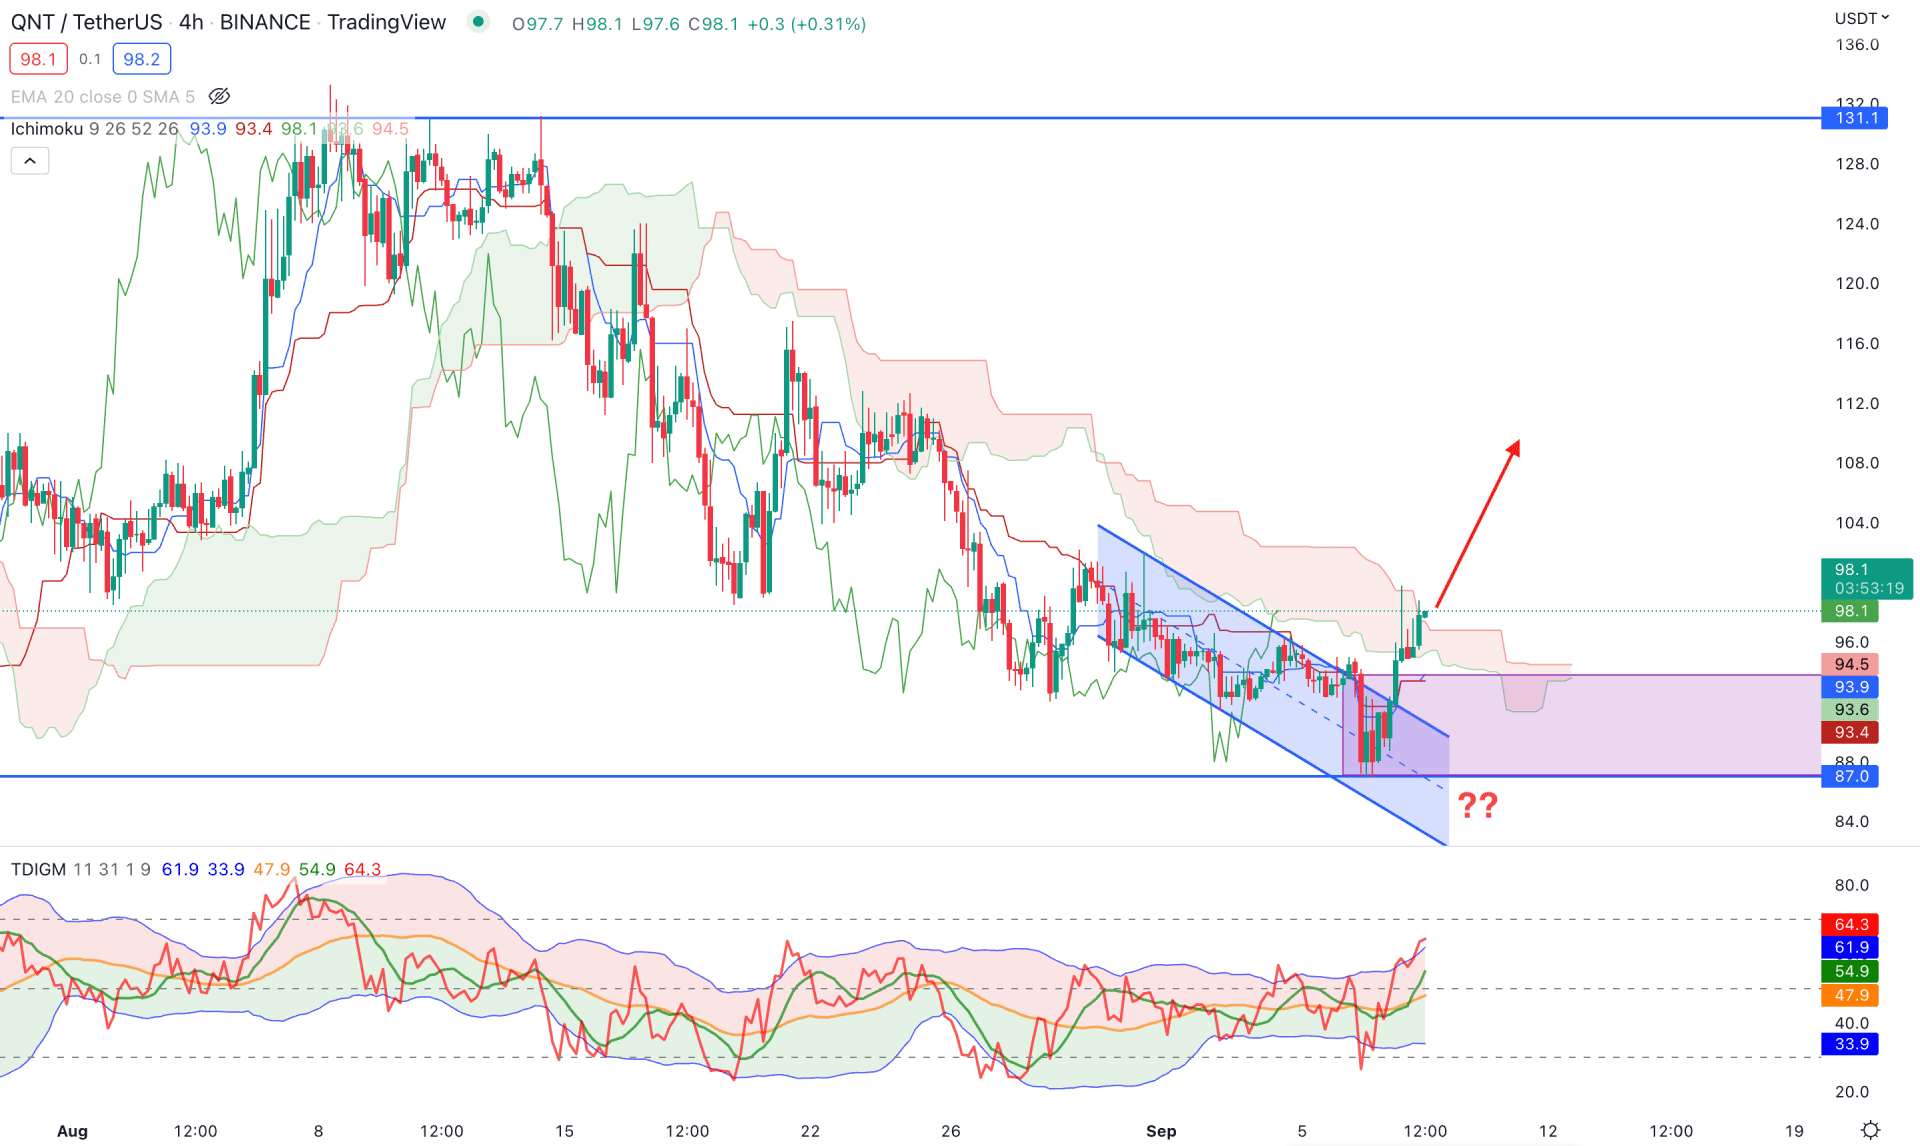
In the H4 timeframe, QNT/USDT price is still trading below the Kumo Cloud, while the most recent price showed a buying attempt from the 87.00 key support level. However, the price is still within the Kumo Cloud, where a bullish break and an H4 close is needed to consider it a valid breakout.
In the future cloud, the Senkou Span is still below the Senkou Span B, while the thickness of the cloud area is getting weaker. In this situation, investors should closely monitor the price area from 93.00 to 87.00, which is the last bearish H4 candle before the bullish breakout. If the price comes to the zone and forms a bullish rejection, it might open a bullish opportunity.
In the indicator window, the TDI Level reached the upper band, indicating an extreme buyers’ presence in the market. However, the buying possibility is valid as long as the TDI level remains above the 40% area. In the main window, the Kijun Sen line is below the price and might work as an immediate support level.
Based on the H4 QNT/USDT price forecast, any bullish rejection from the 93.00 to 87.00 area would be a potential buying opportunity where the primary aim is to test the 116.00 resistance level. On the other hand, a break below the 87.00 level with a bearish H4 candle would lower the price towards the 70.00 level.
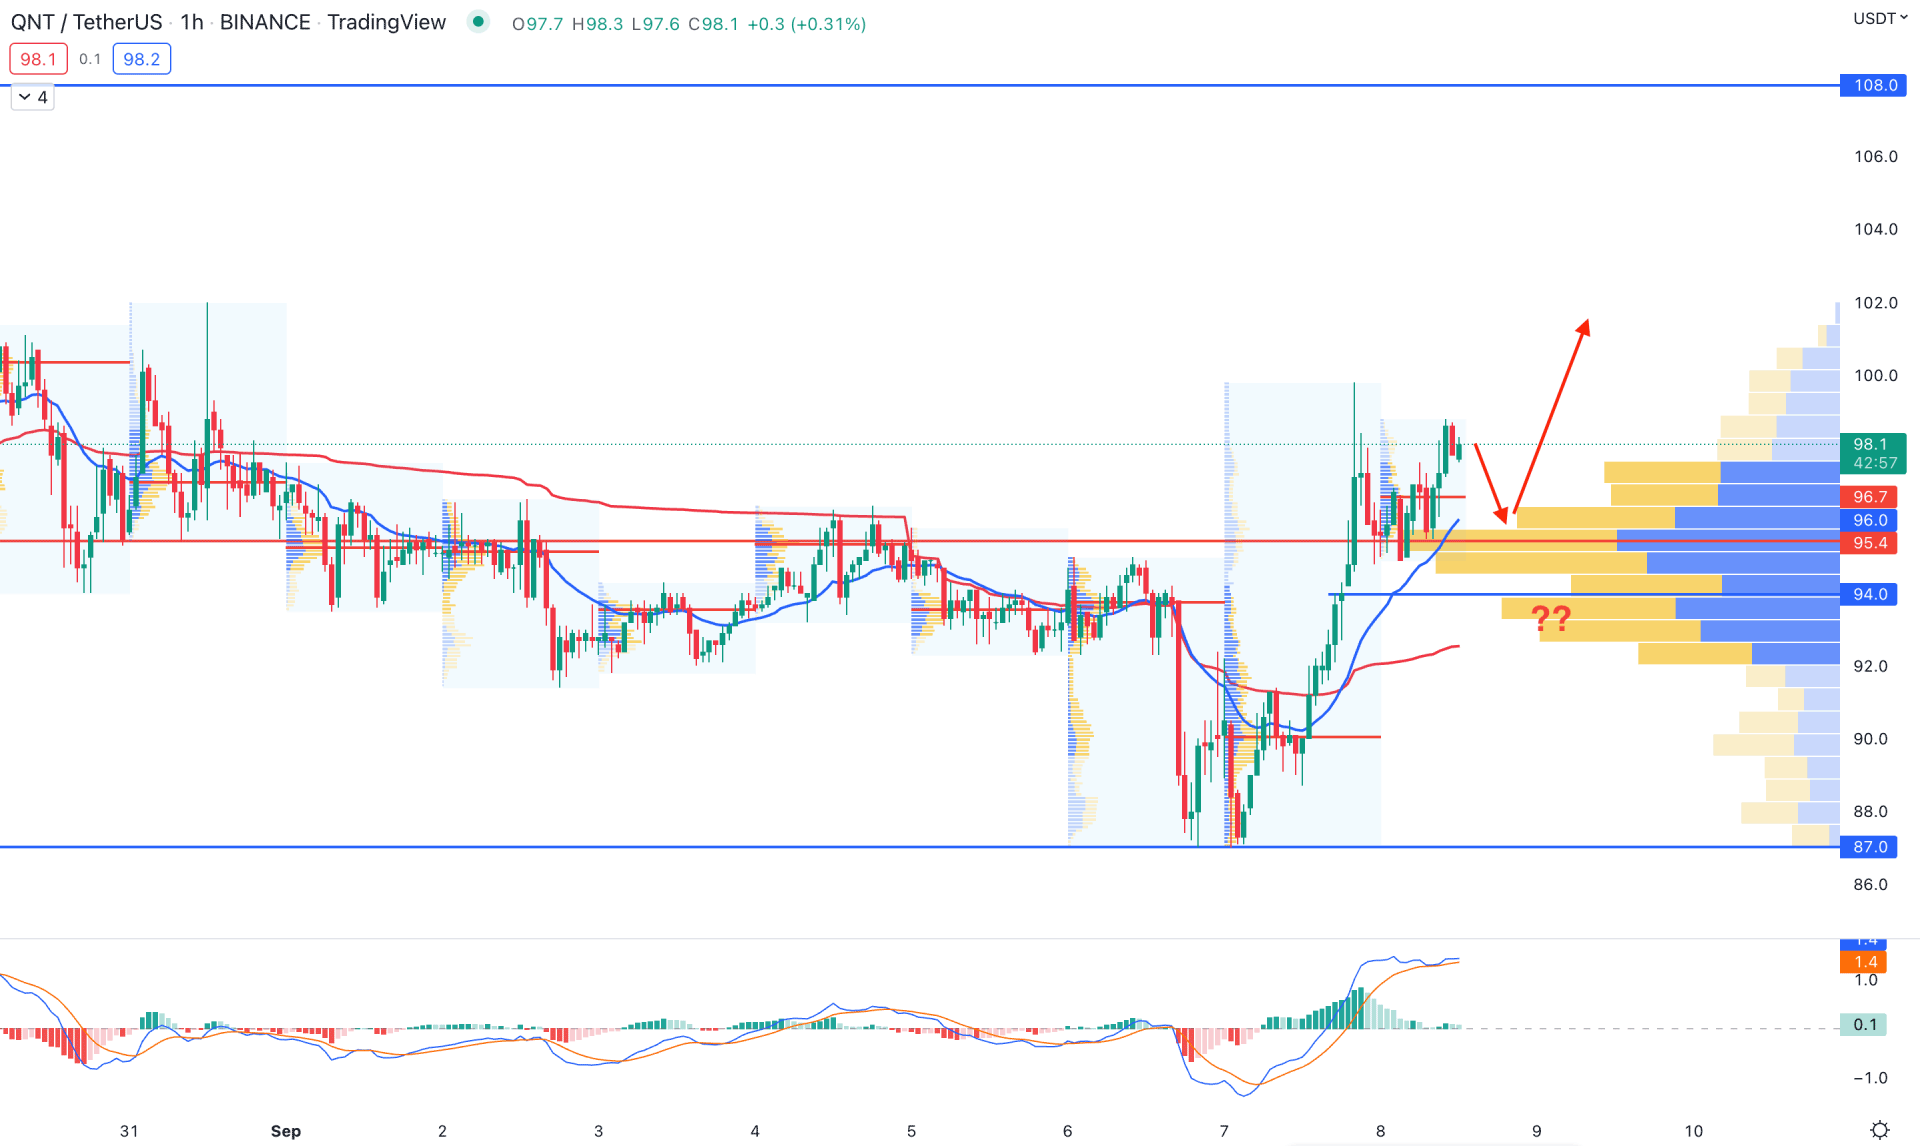
In the QNT/USDT H1 chart, the current price is above the visible range high volume level at 95.40 area, indicating that current buying pressure came with a massive buyers activity. Moreover, the recent static support level is 94.0, slightly below the high volume level. In that case, the trading zone from 95.40 to 94.00 is the area to look at from where a bullish rejection might increase the price.
The dynamic 20 Exponential Moving Average is below the current price with the dynamic weekly VWAP. The indicator window shows buyers' presence in the market while the current MACD Histogram is above the neutral level.
Based on the H1 structure, a bullish rejection from 95.40 to 94.00 would open a long opportunity in this pair. On the other hand, the break below the 93.80 level with a bearish H4 candle might alter the current market structure and lower the price towards the 90.00 level.
Based on the current multi-timeframe analysis, QNT/USDT might open a buying opportunity if the daily candle closes above the 20 EMA. On the other hand, the break below the 94.00 level with a bearish H4 candle might lower the price in the coming days.


