
Published: June 6th, 2023
Quant (QNT) started the year 2023 with bullish sentiment, taking the price to an all-time high of $165. This represents a 58% increase in just one month. However, the rally was short-lived, as QNT/USDT price fell to a support level of $107.5, where it found some buying interest.
There are a few factors that could support QNT in the near future. First, Bitcoin is starting to rally, which could help to lift all altcoins. Second, Quant is involved in the Rosalind project, which is a CBDC project organized by the Bank of England and the Bank of International Settlements. This could bring attention to Quant and its token, QNT.
Recently, QNT has found support at the $99 level, from where a bullish recovery is seen. This support level is important because it is the 200-day moving average. If bulls can hold above this level, they can move higher. However, if the price breaks below this level, it could fall to new lows.
A few factors could support the price in the near future. Investors should keep an eye on the 200-day moving average and the price of Bitcoin. If QNT can hold above these levels, it could move higher.
Investing in a crypto token needs a systematic approach. Let’s see the broader market outlook of QNT/USDT from the QNT technical analysis.
In the higher timeframe price action, the broader market direction is bullish, while the last two monthly candlesticks are showing a buyers presence with a long wick on the downside.
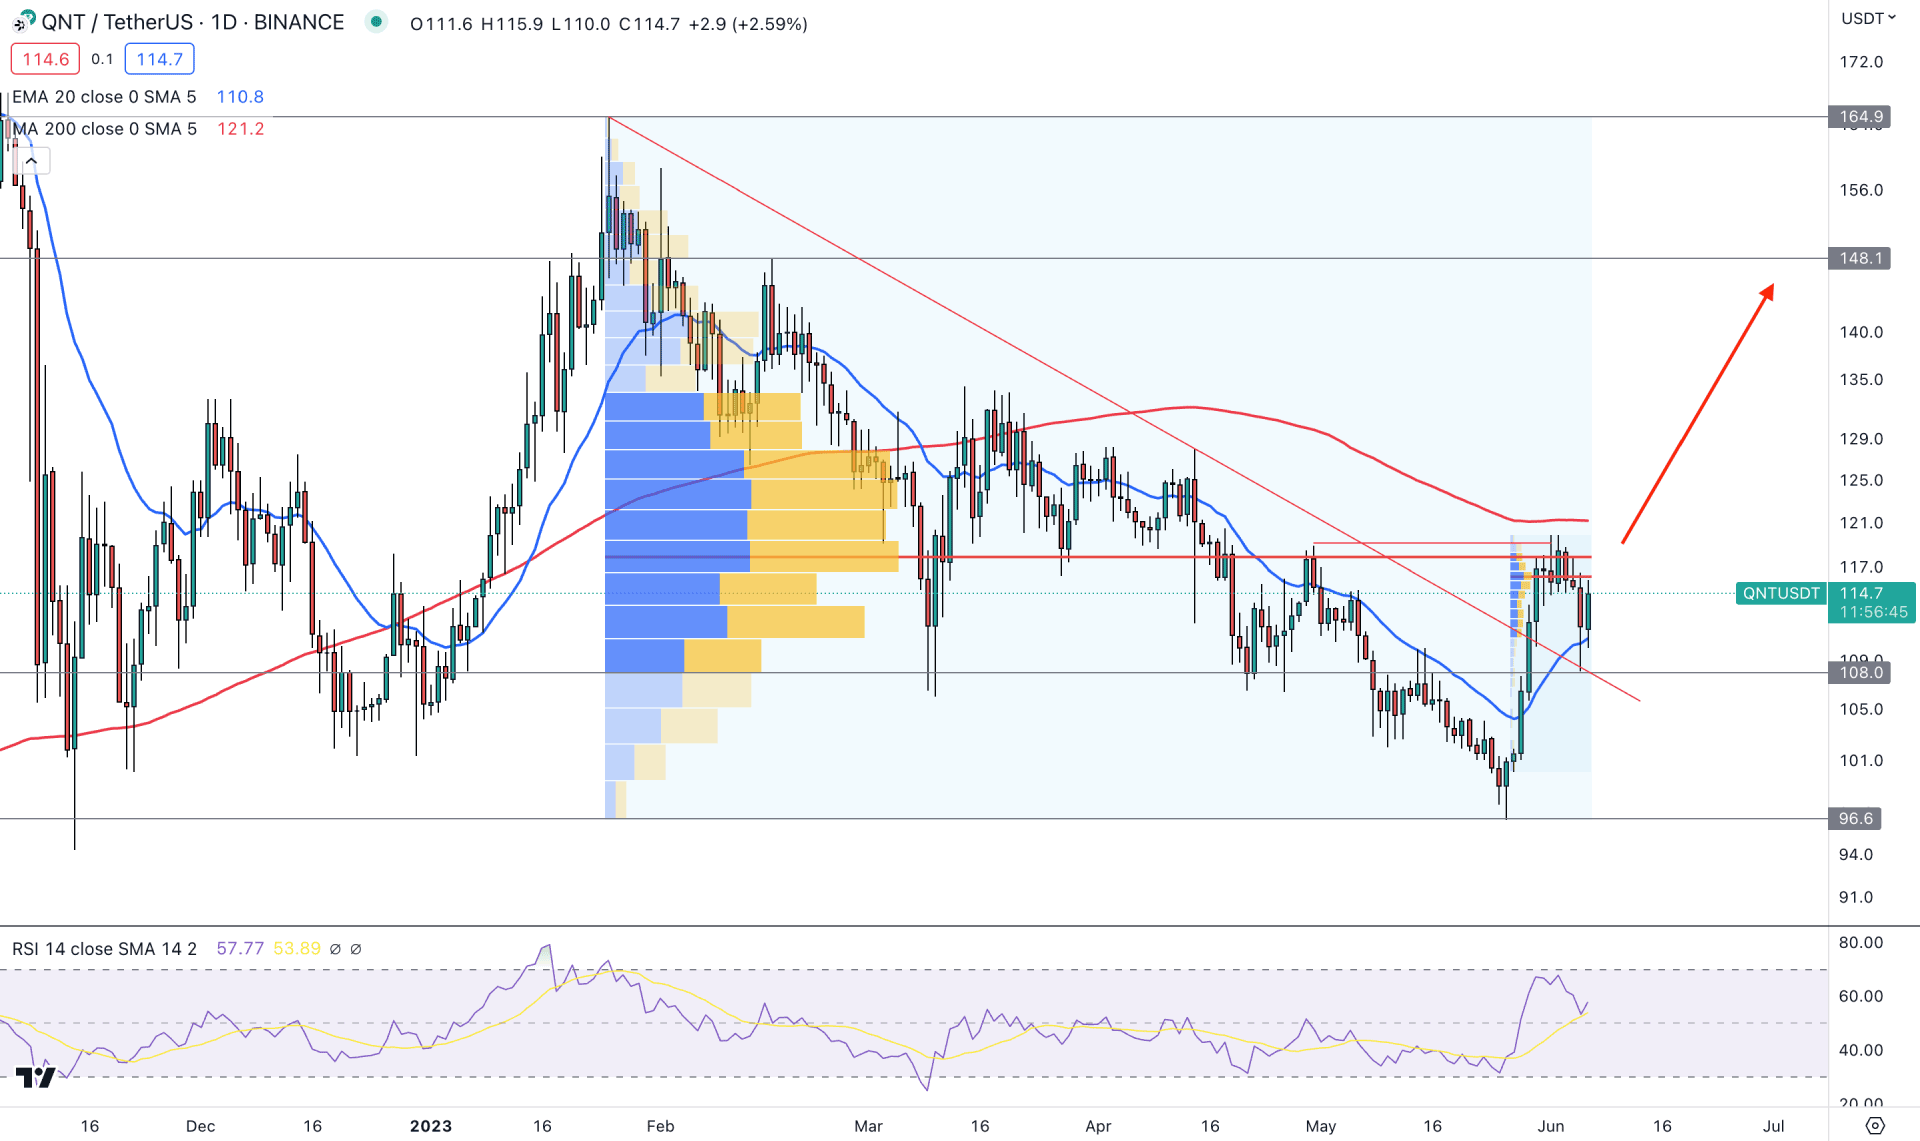
The bullish channel breakout justifies the weekly price, while the clearer view is visible on the daily chart. A strong impulsive price action is visible on the channel resistance, which came with a valid bullish breakout. Moreover, the buying pressure is supported by the 20-day Exponential Moving Average.
In the latest price, the highest activity level since 22 May 2023 is spotted at the 115.50 level, which is just above the current price. Moreover, another high volume level from the 23 January 2023 peak is at the 117.90 level, which is also above the current price. Based on these levels, we may expect a strong bullish trend once the price moves above it with a daily candle close.
The 100-day Simple Moving Average level is above the current price, indicating that the long-term bullish trend needs a proper breakout. The indicator window shows a positive sign as the current RSI is at the 58.00 level with an upward slope.
Based on the daily price outlook of QNT/USDT, any buying opportunity could work well in this structure. A proper breakout and a retest might open an immediate long opportunity but the conservative approach is to wait for a daily candle above a high volume level. The ultimate target of the bullish price action is 148.10 and above this level; the next target is 165.00.
On the downside, a bearish pressure below the 108.00 static support could invalidate the channel breakout and lower the price toward the 96.60 support level.
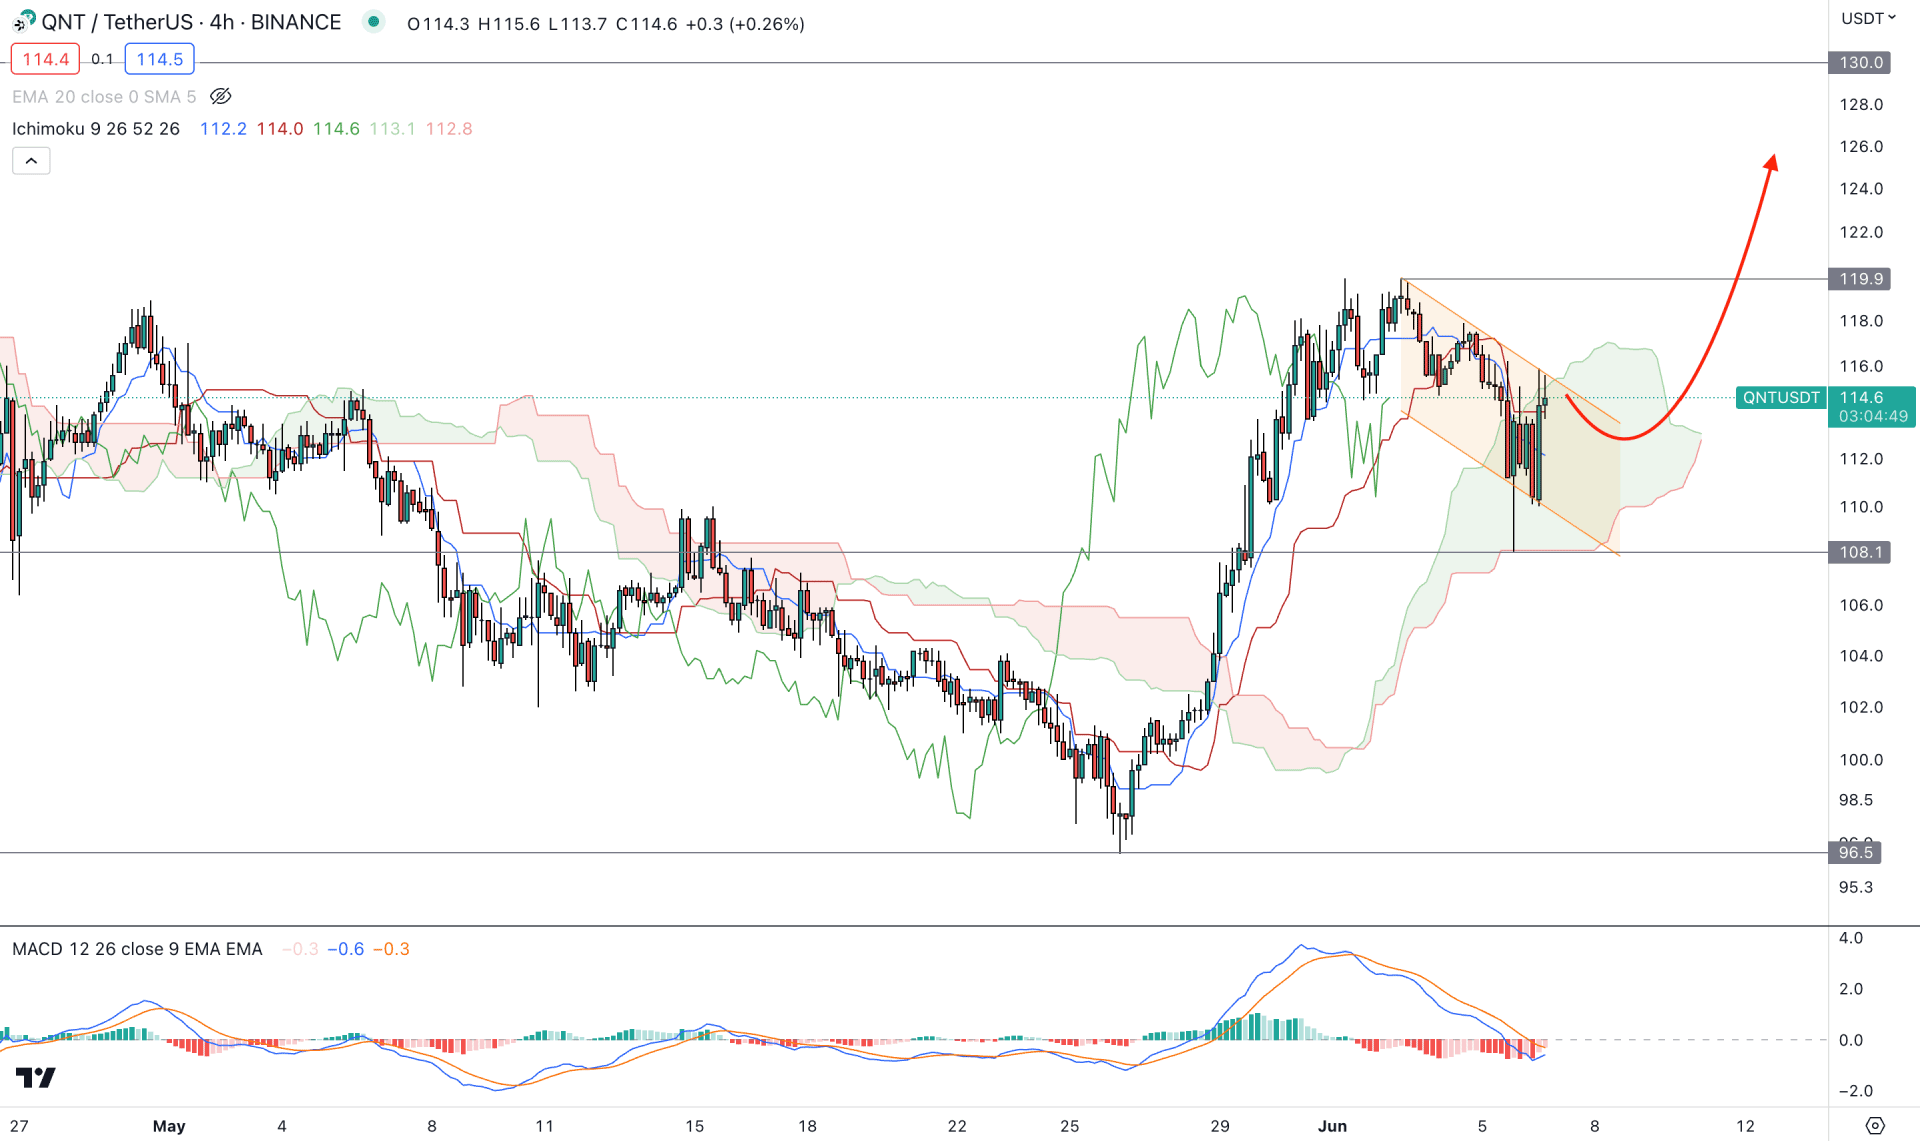
In the H4 chart, a strong bullish impulsive wave came with an Ichimoku Cloud breakout, increasing the possibility of a bullish trend continuation opportunity. Later on, the price went sideways, which is a sign of a bullish trend extension.
In the indicator window, the current MACD Histogram is neutral, while Signal lines are flat below it. Based on the MACD’s outlook, a bullish crossover in signal lines with a positive Histogram would create a long opportunity in this pair.
Based on the H4 outlook of QNT/USDT, the current market trend is bullish, and any bullish setup could work well as long as the price trades above the 108.00 key support level. The ideal trading approach is to look for the channel breakout or a strong bullish rejection from the dynamic Kijun Sen support.
On the buy side, the first target level would be at 119.90 level, but breaking above the level could increase the price towards the 130.00 level.
On the downside, a bearish H4 candle below the 100.00 line could invalidate the buying possibility and could open a strong bearish trend towards the 70.00 level.
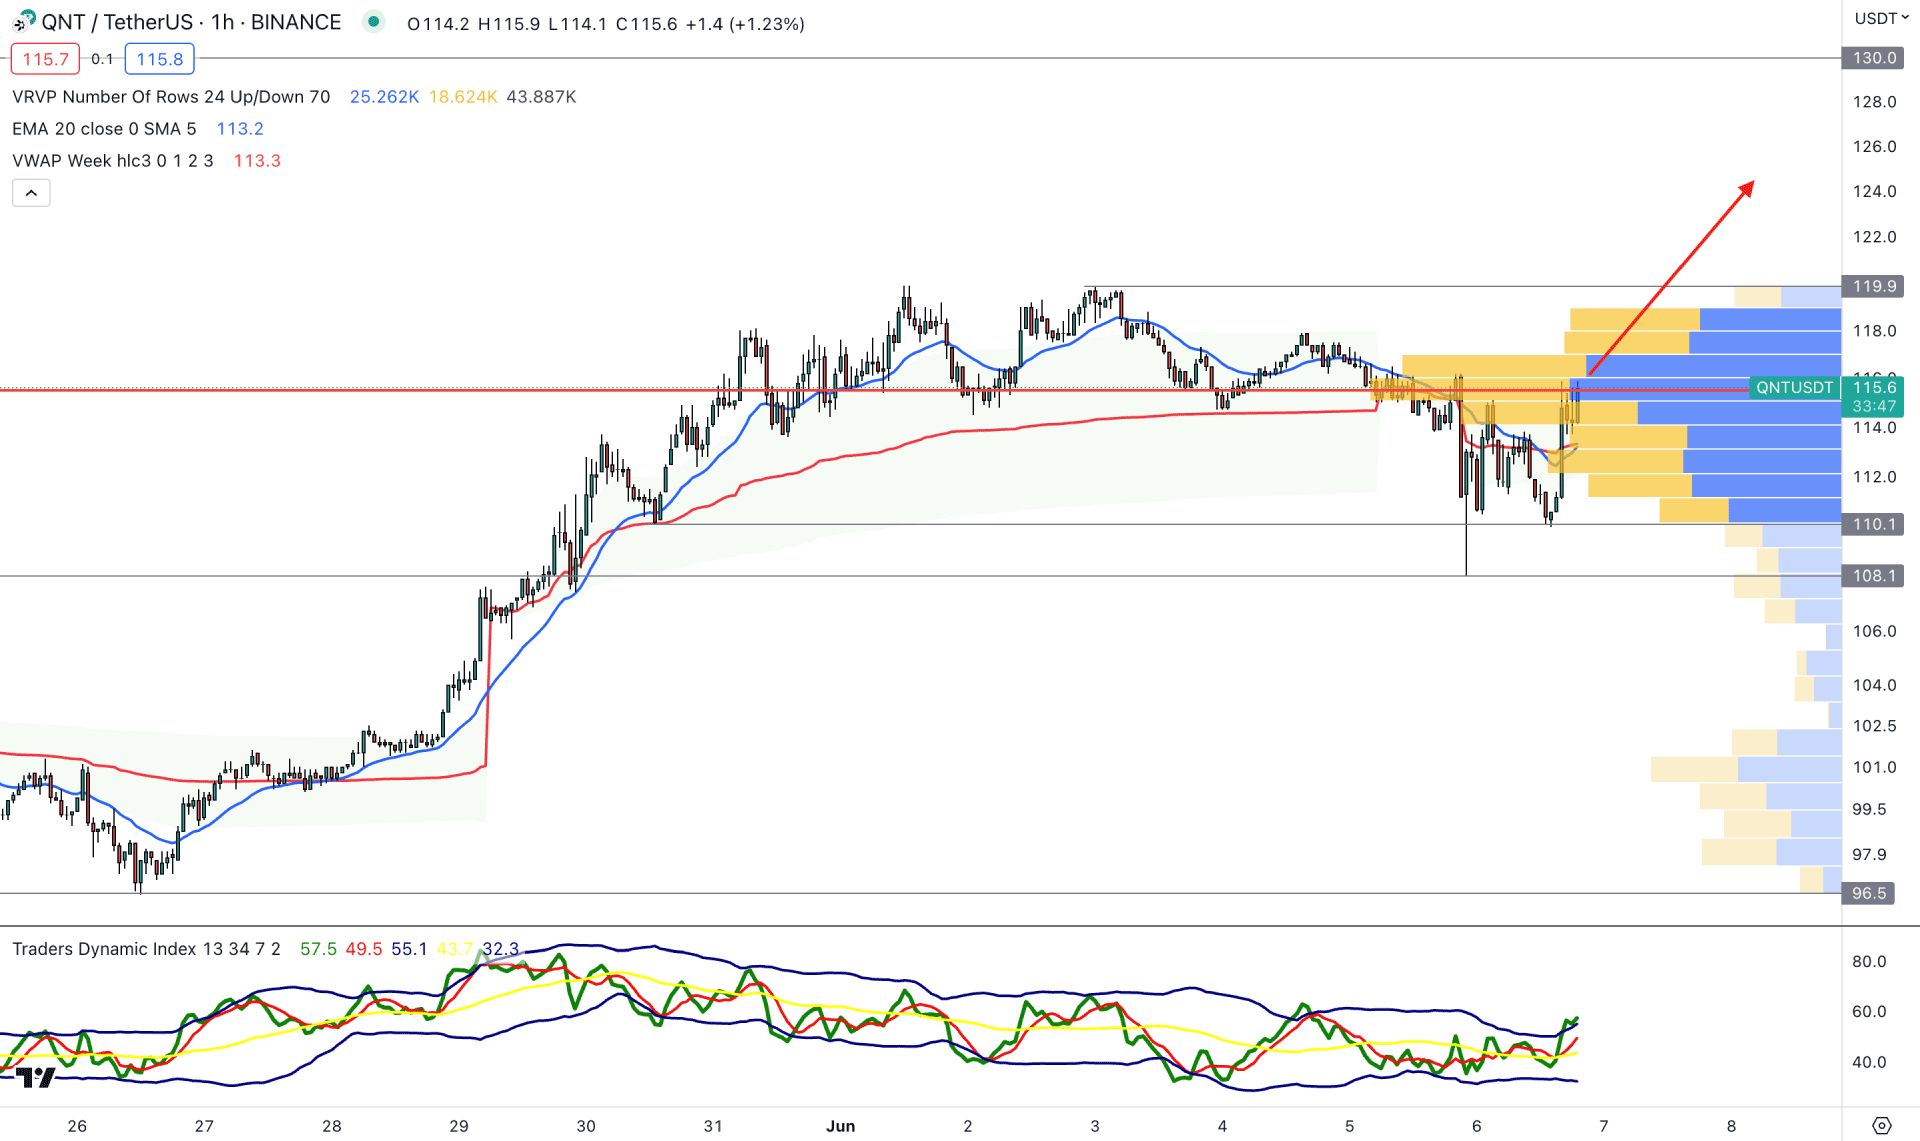
In the H1 chart, the current market outlook is corrective as the latest visible range high volume level is working as a resistance at the 115.60 level. Also, the price trades below the 119.90 critical resistance level while dynamic levels push higher.
The indicator window shows an overbought condition as the current TDI level is at the upper boundary.
Based on the H1 structure, a bullish break with an H1 candle above the visible range high volume level could open a long opportunity in this pair. However, breaking below the 108.00 line might lower the price toward the 100.00 level.
The broader outlook of Quant (QNT) is bullish, but a proper validation is needed in the intraday chart before opening a long trade. Investors should closely monitor the H4 channel from where a bullish break could open an early trading opportunity.


